Abstract
Background
Evidence from a canine experimental acute myocardial infarction (MI) model shows that until the seventh week after MI the relationship between stellate ganglionic nerve and vagal nerve activities (SGNA/VNA) progressively increases.
Objective
We evaluated how autonomic nervous system activity influences temporal myocardial repolarization dispersion at this period.
Methods
We analyzed autonomic nerve activity as well as QT and RR variability from recordings previously obtained in 9 dogs. From a total 48 short-term electrocardiographic segments, 24 recorded before and 24 seven weeks after experimentally-induced MI, we obtained three indices of temporal myocardial repolarization dispersion: QTe (from q wave T to wave end), QTp (from q wave to T wave peak) and Te (from T wave peak to T wave end) variability index (QTeVI, QTpVI, TeVI). We also performed a heart rate variability power spectral analysis on the same segments.
Results
After MI, all the QT variables increased QTeVI (median [interquartile range]) (from - 1.76[0.82] to −1.32[0.68]), QTeVI (from −1.90[1.01] to −1.45[0.78]) and TeVI (from −0.72[0.67] to −0.22[1.00]), whereas all RR spectral indexes decreased (p<0.001 for all). Distinct circadian rhythms in QTeVI (p<0.05,) QTpVI (p<0.001) and TeVI (p<0.05) appeared after MI with circadian variations resembling that of SGNA/VNA. The morning QTpVI and TeVI acrophases approached the SGNA/VNA acrophase. Conversely, the evening QTeVI acrophase coincided with another SGNA/VNA peak. After MI, regression analysis detected a positive relationship between SGNA/VNA and TeVI (R2: 0.077; β: 0.278; p< 0.001).
Conclusion
Temporal myocardial repolarization dispersion shows a circadian variation after MI reaching its peak at a time when sympathetic is highest and vagal activity lowest.
INTRODUCTION
Mortality from sudden cardiac death (SCD) is notoriously high within the first month after acute myocardial infarction (MI)1 and remains high in the first six months thereafter.2 Post-MI and congestive heart failure (CHF), its frequent complication, are both conditions characterized by sympathetic hyperactivity3 that is so important in triggering potentially life-threatening cardiac arrhythmias that in selected patients with CHF, some investigators even propose ablating the stellate ganglion.4 Ample evidence nevertheless shows that in CHF, vagal activity protects against SCD5,6 through its direct antiarrhythmic action mediated by nitric oxide.7–10 Accordingly, others suggest intracardial or extracardial vagal nerve stimulation as useful therapeutic option devices.11,12
A study conducted in recent years in our laboratory, in an experimental canine acute MI model, showed that left stellate ganglion nerve activity (SGNA) increases immediately after an MI but is concurrently counterbalanced by increased vagal nerve activity (VNA). However, the relation between these two autonomic variables (SGNA/VNA ratio) tends to increase progressively until it peaks around the seventh week post-MI and its circadian rhythm resembles that described for heart rate variability (HRV).13 What remains unclear is how autonomic nervous system activity influences myocardial repolarization dispersion. This information would help to understand some of the mechanisms underlying SCD after an acute MI and, possibly, to identify patients at highest arrhythmic risk.
In this pathophysiological study, we therefore re-analyzed the autonomic nerve activity and the electrocardiographic (ECG) recordings previously obtained from 9 dogs13 and selected one single 5-minute ECG segment hourly during the day, under baseline conditions and seven weeks after experimentally-induced acute MI. We then performed a short-period HRV power spectral analysis and calculated temporal dispersion in myocardial repolarization.14–18
MATERIALS AND METHODS
Surgical preparation and electrical recording
The data analyzed came from a previous study conducted in 9 mongrel male dogs.13,19–23 The methods of electrode placement for nerve recordings have been previously reported.22,23 Detailed methods of nerve activity measurements can be found in the report by Han et al.13 In brief, each dog was implanted with a Data Sciences International (DSI) D70-EEE transmitter with 3 bipolar recording channels for simultaneous SGNA, VNA and ECG recordings. One bipolar recording electrode pair was implanted under the LSG fascia, another one on the left vagus nerve located above the aortic arch, and the last electrode pair was placed in the subcutaneous chest wall to simulate the ECG orientation in lead I. After two weeks to allow for the dogs recovery, data for all channels were recorded simultaneously for 7 days. Dogs then underwent the following procedure to induce acute MI: a bolus of unfractionated heparin (3,000 UI) and amiodarone (150 mg) were infused before the procedure and after this procedure amiodarone (150 mg/h) was continuously infused. After left coronary cannulation using a 7-F Judkins JL guiding catheter, a balloon was inflated for one hour to occlude the left anterior descending coronary just below the first diagonal branch in 6 dogs and the left circumflex artery below the second obtuse marginal branch in 3 dogs. During balloon inflation, the surface ECG showed an ST segment elevation indicating an acute MI and, to confirm myocardial necrosis, cardiac troponin I levels were assayed at baseline and 24 hours after this procedure. Left ventriculography was done immediately before the MI was induced. The dogs were allowed to recover for 2 months and during this time they underwent continuous ambulatory recordings. The animal experiments were approved by the Institutional Animal Care and Use Committee.
Direct Measurement of Nerve Activity
Data were recorded real time at a sampling rate of 1000 samples per second per channel, then analyzed off-line. High-pass (50 Hz) filtering was used to reduce the ECG signals from the left stellate ganglion (LSG) recording channel, and wavelet filtering was used to eliminate the electrocardiographic signals from the vagus nerve recording channels. Most signals recorded from LSG were low-amplitude burst discharge activity.20–23 Autonomic nerve activity was integrated over 100 ms and multiplied by the sampling time. The 5-minute integrated nerve activity recording was used to quantify SGNA and VNA and we calculated QT and RR variability from the simultaneous ECG. Last, we calculated the SGNA/VNA ratio. For each dog we obtained one recording hourly per day at baseline and seven weeks after MI.
HRV power spectral analysis
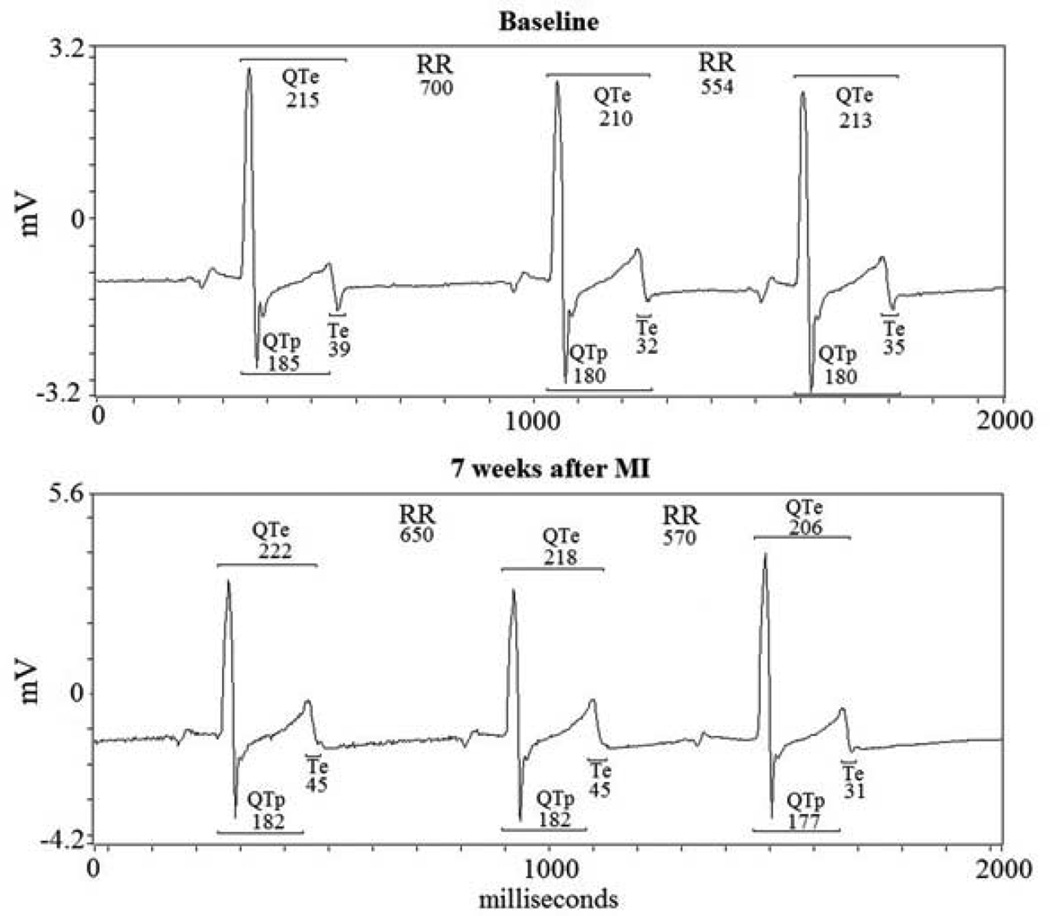
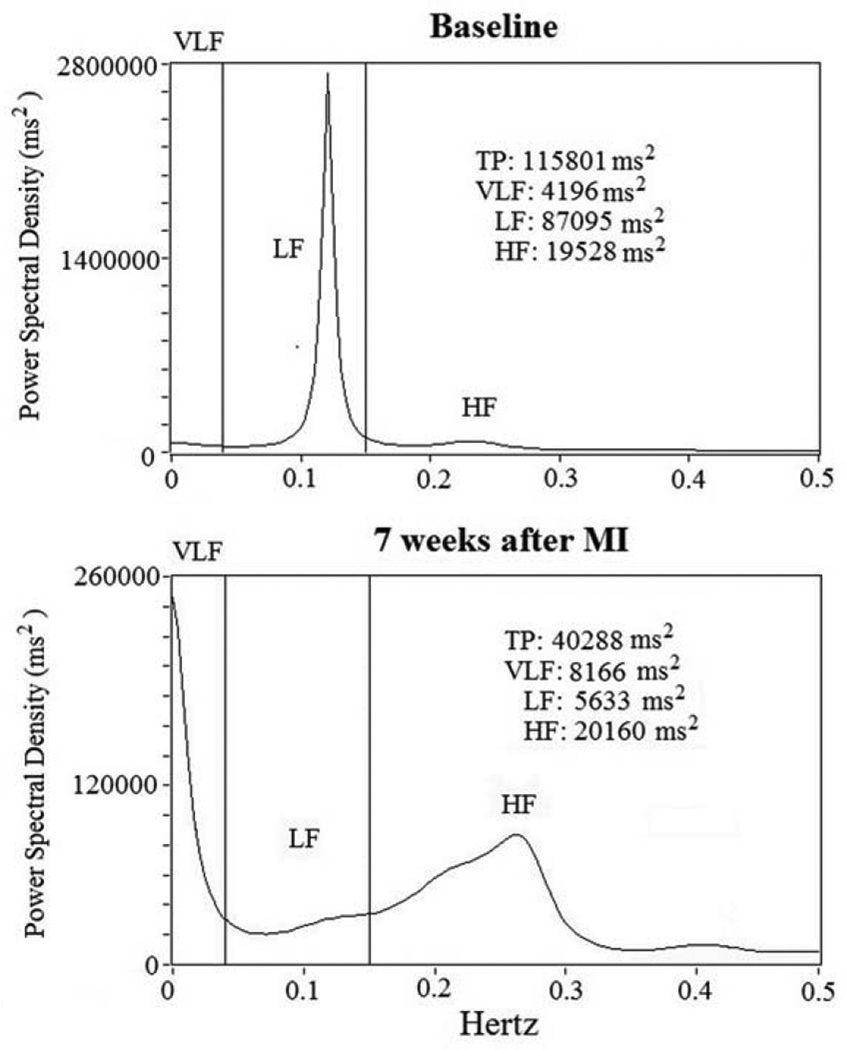
Spectral power for HRV was analyzed on 5-minute ECG recording segments and an autoregressive algorithm was used to analyze digitized signals from the ECG recordings (Figure 1).21 We then determined the following power spectral variables: total power (TP) (total spectral density); the high-frequency (HF) component (from 0.15 to 0.40 Hz); low-frequency (LF) component (from 0.04 to 0.15 Hz); and a very-low-frequency (VLF) component (below 0.04 Hz) (Figure 2).21 We also reported in Hz the central frequency (CF), the predominant LF and HF power oscillations.
Figure 1.
RR, QTe (from q to end of T wave), QTp (from q wave to T wave peak) and Te (from peak to the end of T wave) baseline and 7 weeks after MI.
Figure 2.
RR power spectral analysis at baseline and 7 weeks after acute myocardial infarction (MI). Short-term power spectral analysis components are very-low frequency (VLF), low-frequency (LF) and high-frequency (HF) power components. Total power was almost all area-under-the-curve (0 to 0.40 Hz). After MI, total power (TP) and low-frequency (LF) power diminish from baseline.
Temporal myocardial repolarization dispersion and QT-RR coherence
From the respective 5-minute ECG recordings we calculated mean and variance for the following intervals: RR, QTe (from the Q-wave to the T-wave end), QTp (from the Q-wave to the T-wave peak) and Te (from the T-wave peak to the T-wave end) (Figure 1).14–16 We then used the original Berger et al. formula, which quantifies the magnitude of QT interval fluctuations normalized by both the mean QT duration and the magnitude of the heart rate fluctuations, to obtain the three indices for temporal myocardial repolarization dispersion:17
DVI= log10{[(Dvariance)/(Dmean)2]/[(RRvariance)/(RRmean)2]}
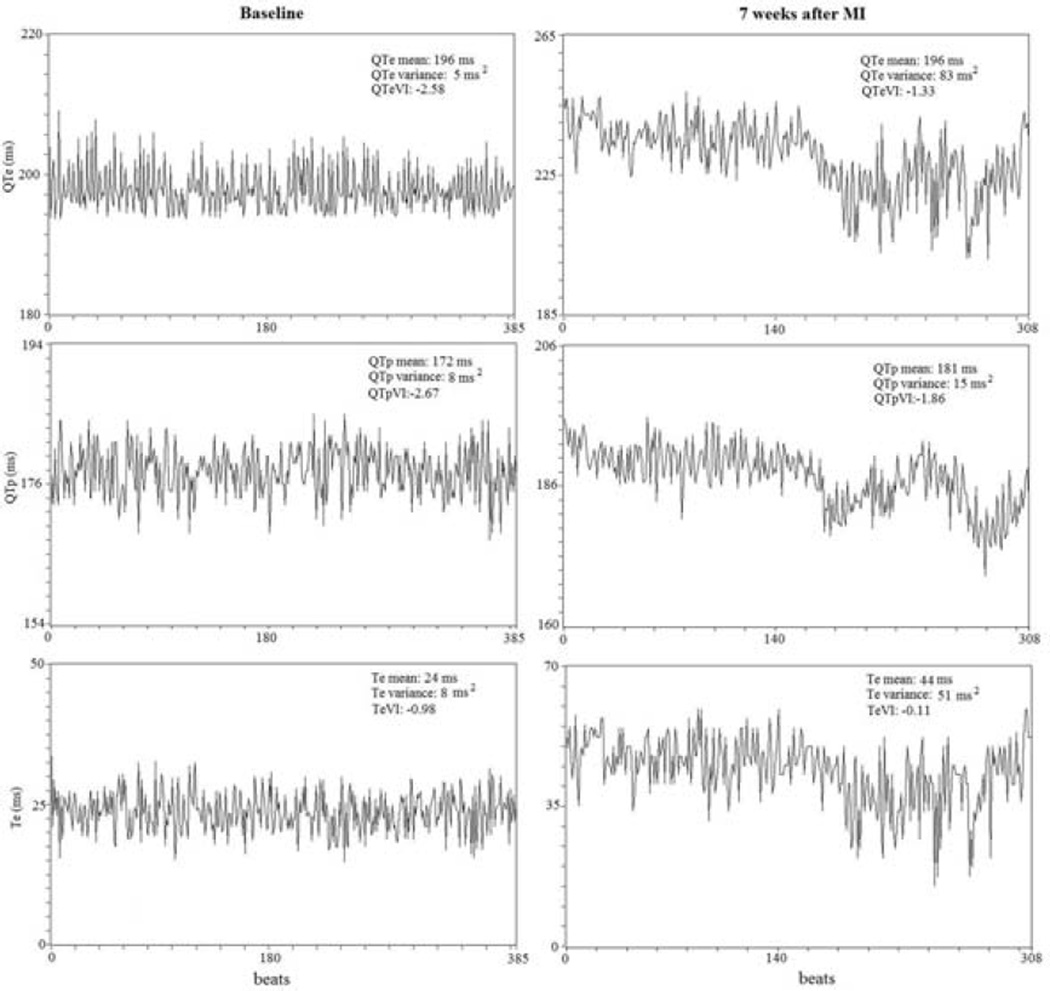
where D was the interval duration of QTe, QTp, and Te (Figure 2, 3).
Figure 3.
Representative example of a 5-minute ECG recording and derived variables on QTe, QTp and Te intervals and the different variability indexes (QTeVI, QTpVI and TeVI). Different scales are used in each panel.
The next variable estimated was the coherence function for the RR and the various repolarization intervals.17,19 Coherence expresses the power fraction oscillating at a given frequency in either time series and is explained as a linear transformation of the other thus indicating a linear association between the two signals. The coherence function γ(f) was then computed according to the formula:
 |
where f is frequency, Pxx (f) is the spectrum of an RR interval, Pyy(f) are the QTe, or QTp, or Te interval spectra, and Pxy(f) is the cross spectrum. Mean coherences were measured by averaging γ(f) over the frequency bands: from 0 to 0.50 Hz. The coherence function provides a measure between zero and unity in the degree of linear interaction between RR and QTe, or QTp, or Te interval oscillations as a function of their frequency. More in general, the QT-RR interval spectral coherence evaluates temporal patterns in oscillating signals and it hypothetically reaches the maximum (unity) when QT and RR interval oscillations proportionally correspond. Although QT-RR interval spectral coherence remains relatively low (less than 0.400) even under healthy conditions, nevertheless it tends to dramatically decrease further in CHF models (less than 0.300), a phenomenon thought to reflect a worsening of the sinus node function.19–21
A single physician (G.P) analyzed all digitalized signal recordings.
Data and Statistical Analysis
Unless otherwise indicated, all data are expressed as means ± SD. Data with skewed distribution are given as median and interquartile range (75th percentile - 25th percentile). For each dog, 24 recordings (one per hour per day) were obtained at baseline and seven weeks after acute MI.
Paired t-test was used to compare data for the normally distributed variables (including RR mean, QTe mean, QTp mean, Te mean, coherence functions, SGNA and VNA) whereas Wilcoxon test was used to compare non-normally distributed variables (including RR variance, QTe variance, QTp variance and Te variance, QTeVI, QTpVI, and TeVI) at baseline and after MI.
Cosinor tests were used to detect and quantify significant circadian variations and reported the following variable: mesor (m) (the value midway between the highest and lowest values in the curve), amplitude (amp) (the difference between the peak and mean wave value), acrophase (ac) (the time when the rhythm reached its peak) and trough (th) (the time when the rhythm reached its lowest value).
Stepwise multiple regression analysis, using as dependent variables the natural logarithm (ln) SGNA and (ln) VNA, was used to assess the relationship between ANS activity and all the other studied variables at baseline and seven weeks after MI.
All data were evaluated with the database SPSS-PC+ (SPSS-PC+ Inc, Chicago, Illinois). A p value of less than or equal to 0.05 was considered statistically significant.
RESULTS
Because ECG recordings for 3 of the 9 dogs contained excessive background noise, data were analyzed for only 6 dogs. We therefore analyzed a total of 288 recordings for each dog, 144 obtained at baseline and 144 after MI.
Mean cardiac troponin I values increased from < 0.2 ng/ml at baseline to a median values of 85 mg/ml (interquartile range, 79 mg/ml) 24 hours after acute MI. When the study ended (two months after the MI), the left ventricular ejection fraction remained statistically unchanged (65±17% Vs 53±17%).
Mean values for all QT variables were significantly longer seven weeks after MI than at baseline: QTe (p<0.001), QTp (p<0.001) and Te (p<0.05) (Table 1). Similarly, all corrected QTe intervals values (QTe Bazett, QTeTabo and QTeVan de Water) were longer after MI (p<0.001) (Table 1). Conversely, RR variance was significantly higher at baseline (p<0.001) (Table 1). RR mean, QTe, QTp and Te variance values overlapped in the two study conditions (Table 1).
Table 1.
ECG derived and nerve activity data in the two different study conditions.
| Variables | Baseline N = 144 segments |
7 weeks after MI N = 144 segments |
P values |
|---|---|---|---|
| RR mean (ms) | 695±137 | 703±178 | 0.214 |
| RR variance (ms2) | 35,559(43611) | 13,432(16512) | <0.0001 |
| QTe mean (ms) | 219±34 | 253±63 | <0.0001 |
| QTe variance (ms2) | 55(69) | 63(94) | 0.081 |
| QTp mean (ms) | 160±23 | 176±24 | <0.0001 |
| QTp variance (ms2) | 24(58) | 24(57) | 0.387 |
| Te mean (ms) | 54(24) | 56(34) | 0.012 |
| Te variance (ms2) | 45(97) | 56(81) | 0.235 |
| QTe Bazett, ms | 264±33 | 297±57 | <0.0001 |
| QTe Tabo, ms | 253±32 | 286±57 | <0.0001 |
| QTe van de Water, ms | 245±30 | 276±56 | <0.0001 |
| SGNA, mV | 9.4(6.5) | 15.4(16.5) | <0.0001 |
| VNA, mV | 1.2(0.9) | 1.5(0.5) | <0.0001 |
| SGNA/VNA ratio | 7.9(4.1) | 9.8(8.8) | <0.0001 |
Data are expressed as mean ± SD or median (interquartile range). SGNA: integrated left stellate ganglion nerve activity; VNA: integrated vagal nerve activity.
Similarly, SGNA, VNA, SGNA/VNA, QTeVI, QTpVI and TeVI values were significantly higher seven weeks after MI than at baseline (p <0.001) (Table 1–2). Conversely, no difference was found in coherence between all repolarization variables and RR (Table 2).
Table 2.
QT interval variability indices values and related coherence with RR interval in the two different study conditions.
| Variables | Baseline N = 144 segments |
7 weeks after MI N = 144 segments |
P values |
|---|---|---|---|
| QTeVI | −1.76(0.82) | −1.32(0.68) | <0.0001 |
| QTe → RR coherence | 0.372±0.158 | 0.367±0.164 | 0.780 |
| QTpVI | −1.90(1.01) | −1.45(0.78) | <0.0001 |
| QTp → RR coherence | 0.358±0.104 | 0.356±0.135 | 0.752 |
| TeVI | −0.72(0.67) | −0.22(1.00) | <0.0001 |
| Te → RR coherence | 0.287±0.102 | 0.280±0.103 | 0.549 |
Data are expressed as mean ± SD or median (interquartile range).
TP (p <0.001), VLF (p<0.001), LF (p <0.001) and HF power (p<0.001), expressed in absolute power (ln ms2), were significantly lower seven weeks after MI than at baseline (p<0.001) (Table 3). LF/HF ratio and LF power, expressed in normalized units, were significantly higher whereas HF power, expressed in normalized units, was lower seven weeks after MI than at baseline.
Table 3.
Data for RR Power Spectral Analysis in the two different study conditions.
| Variables | Baseline N = 144 segments |
7 weeks after MI N = 144 segments |
P values |
|---|---|---|---|
| Total power (ln ms2) | 10.3±0.9 | 9.3±1.1 | <0.0001 |
| Very-low frequency (ln ms2) | 7.8±0.9 | 7.6±1.2 | <0.0001 |
| Low frequency (ln ms2) | 8.4±1.1 | 7.5±1.2 | <0.0001 |
| Low frequency CF (Hz) | 0.112±0.013 | 0.101±0.012 | 0.550 |
| High frequency (ln ms2) | 9.6±1.1 | 8.4±1.3 | <0.0001 |
| High frequency CF (Hz) | 0.24±0.07 | 0.25±0.08 | 0.561 |
| Low frequency/High frequency | 0.3(0.5) | 0.4(0.7) | 0.028 |
Data are expressed as mean ± SD or median (interquartile range). CF is central frequency.
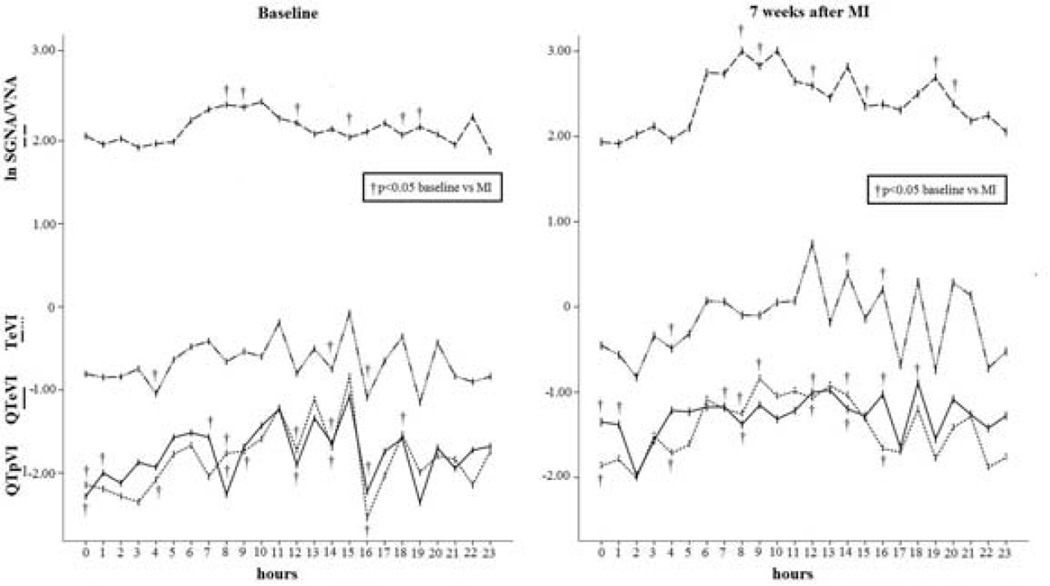
During the two days analyzed, the SGNA/VNA was significantly higher in the six different hours seven weeks after MI than in the baseline condition (8:00, 9:00, 12:00, 15:00, 18:00 and 19:00) (p<0.05) (Figure 4). QTeVI reached higher significant values in eight hours per day (0:00, 1:00, 7:00, 8:00, 12:00, 14:00, 16:00 and 18:00) (p<0.05) (Figure 4), QTpVI in seven hours per day (0:00, 4:00, 8:00, 9:00, 12:00, 15:00 and 16:00) (p<0.05) (Figure 4) and, last, TeVI showed higher values only in three hours per day (2:00, 4:00, and 16:00) (p <0.05) (Figure 4).
Figure 4.
Daytime increase in the three temporal dispersion indexes (QTeVI, QTpVI and TeVI) related to the circadian variation in SGNA/VNA seven weeks after MI (right panel). Note that the SGNA/VNA peak (m= 2.7; amp= 0.4; ac: 10:00; th: 1:00; p= 0.0001) matched the QTpVI (m= −1.46; amp= 0.39; ac: 9:00; th: 2:00; p= 0.0001) and TeVI peak (m= −1.18; amp= 0.37; ac: 12:00; th: 2:00; p= 0.005). In the evening there was the QTeVI peak (m= −1.29; amp= 0.18; ac: 18:00; th: 2:00; p= 0.0043) corresponding to an evening SGNA/VNA peak.
The SGNA/VNA ratio showed a significant circadian variation both at baseline (m= 2.2; amp= 1.2; ac: 10:00; th: 23:00; p= 0.005) and seven weeks after MI (m=2.7 ; amp=0.4; ac: 10:00; th: 1:00; p= 0.0001) (Figure 4). Conversely, the other variables, varied significantly over the 24 hours only seven weeks after MI: QTeVI (m= −1.29; amp= 0.18; ac: 18:00; th: 2:00; p= 0.0043), QTpVI (m= −1.46; amp= 0.39; ac: 9:00; th: 2:00 ;p= 0.0001) and TeVI (m= −1.18; amp= 0.37; ac: 12:00; th: 2:00; p= 0.005) (Figure 4). Also QTTabo (p= 0.02) and QTvan de Water (p= 0.002) showed a circadian rhythmicity when recorded seven weeks after MI.
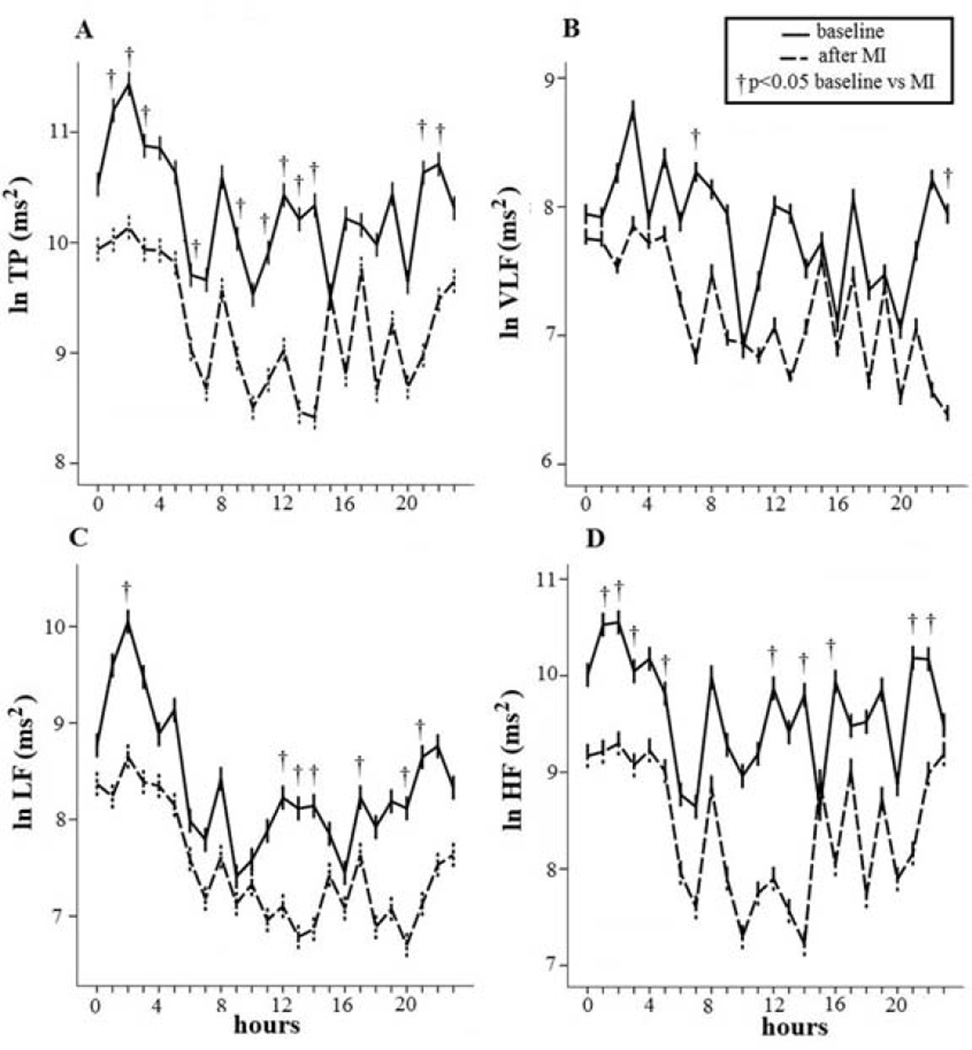
During the two study conditions, TP was significantly lower in eleven different hours seven weeks after MI than in the baseline condition (1:00, 2:00, 3:00, 6:00, 9:00, 11:00,12:00, 13:00, 14:00, 15:00, 21:00 and 22:00) (p<0.05) (Figure 5A). Conversely, VLF power was significantly lower in only two hours per day (3:00 and 23:00) (p<0.05) (Figure 5B); LF power, expressed in absolute power (ln ms2), showed lower levels in seven hours per day (2:00 and 12:00, 13:00, 14:00, 17:00, 20:00 and 21:00) (p<0.05) (Figure 5C) and, last, HF power showed lower levels in nine hours per day seven weeks after MI than at baseline (1:00, 2:00, 3:00, 6:00, 12:00, 14:00, 16:00, 21:00 and 22:00) (p < 0.05) (Figure 5D).
Figure 5.
Significant reduction in all spectral components seven weeks after myocardial infarction (MI): total power (TP) (A), very-low frequency (VLF) (B), low frequency (LF) (C) and high-frequency (HF) (D) power. The spectral RR component behaved in an opposite manner to myocardial repolarization dispersion, being higher at night and lower during the daytime.
TP baseline (A): m= 10.4, amp= 0.5, ac: 2:00, th: 15:00; p= 0.005. TP after MI (A): m= 10.4, am= 0.5, ac: 2:00, th: 14:00; p= 0.0004.
VLF power baseline (B): m= 7.8, amp= 0.4, acr: 3:00, th: 20:00; p= 0.016. VLF power after MI (B): m= 7.3, amp= 0.4, ac: 7:00, th: 23:00; p: 0.023;
LF power baseline (C): m= 8.4, amp= 0.8, ac: 2:00, th: 9:00; p= 0.0002. LF power after MI (C): m= 7.9, amp= 0.6, ac: 2:00, th: 20:00; p= 0.0001.
HF power (D) showed a significant circadian behavior only after MI (HF power after MI: m= 8.5, amp= 0.8, ac: 2:00, th: 14:00; p= 0.0001).
TP, VLF and LF power, expressed in absolute power (ln ms2), both at baseline and seven weeks after MI underwent significant circadian variation (TP baseline: m= 10.4; amp= 0.5; ac: 2:00; th: 15:00; p= 0.005; TP after MI: m= 10.4; am= 0.5; ac: 2:00; th: 14:00; p= 0.0004; VLF power baseline: m= 7.8; amp= 0.4; ac:= 3:00; th: 20:00; p= 0.016; VLF power after MI: m= 7.3; amp= 0.4; ac: 7:00; th: 23:00; p= 0.023; LF power baseline: m= 8.4; amp= 0.8; ac: 2:00; th: 9:00; p= 0.0002; LF power after MI: m= 7.9; amp= 0.6; ac: 2:00; th: 20:00;p: 0.0001) (Figure 5). Conversely, HF power expressed in absolute values, showed significant circadian variations only seven weeks after MI (HF power after MI: m= 8.5; amp= 0.8; ac: 2:00; th: 14:00; p= 0.0001) (Figure 5).
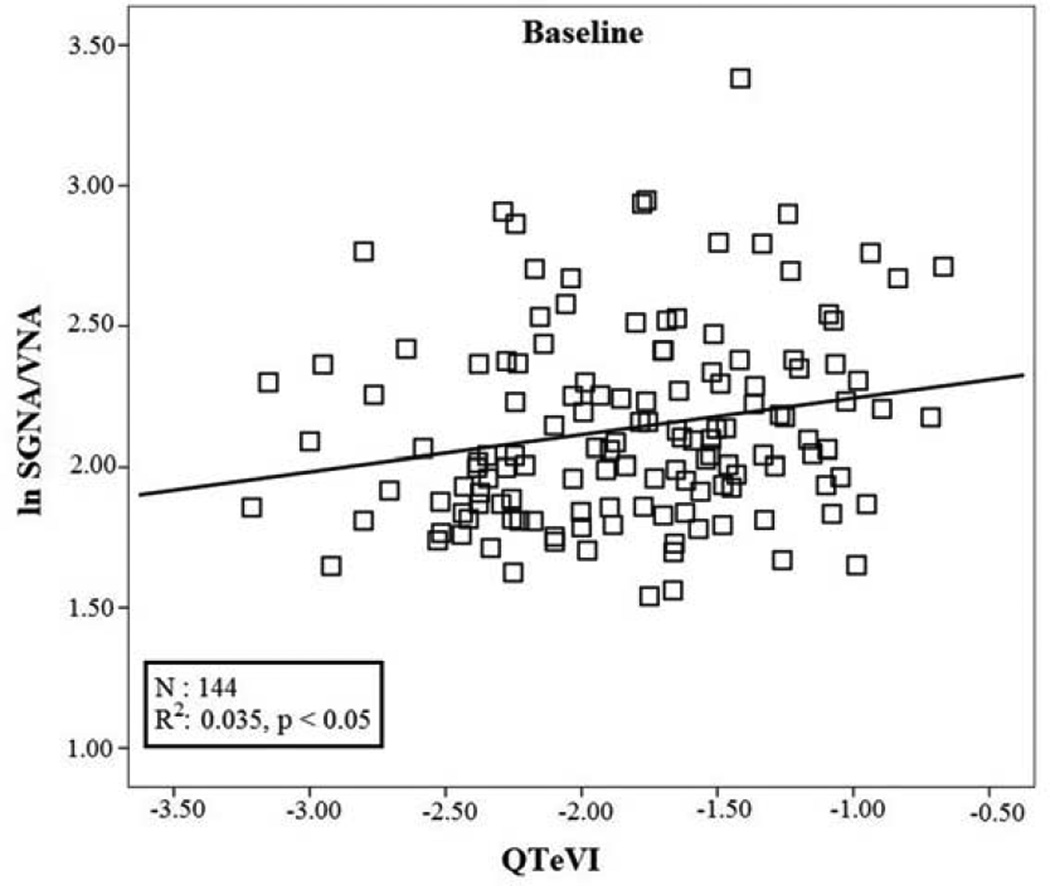
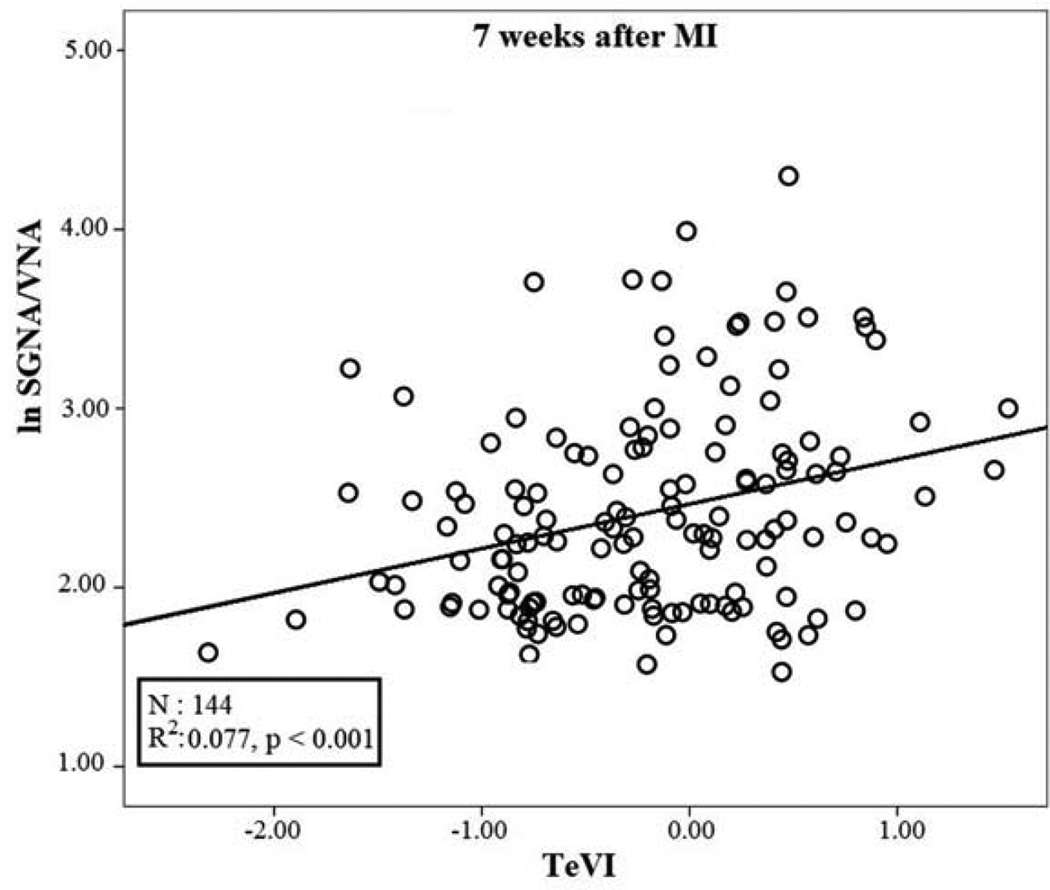
The stepwise multiple regression analysis testing data recorded at baseline detected a small though significant positive relation between lnSGNA/VNA (r: 0.187; R2: 0.035; p<0.05) and QTeVI (b: 0.118; se: 0.054; β: 0.187; p= 0.03) (Figure 6). Conversely, the same analysis testing data recorded after MI detected a significant positive relationship between lnSGNA/VNA (r: 0.278; R2: 0.077; p<0.001) and TeVI (b: 0.246; se: 0.072; β: 0.278; p:0.001) (Figure 7).
Figure 6.
Linear regression between QTeVI measured on 5 minute ECG recordings and natural logarithm of SGNA/VNA at baseline.
Figure 7.
Linear regression between TeVI measured on 5 minute ECG recordings and natural logarithm of SGNA/VNA seven weeks after myocardial infarction (MI).
DISCUSSION
The major finding in this study is that temporal myocardial repolarization dispersion, as assessed in terms of QTeVI, QTpVI and TeVI, increases seven weeks after dogs undergo experimentally induced acute MI and that, only under this condition, a circadian rhythm appears for all these three QT indices. Particularly, we found that TeVI was the QT-derived index that exhibited the best correlation with the autonomic nerve activity, as calculated with the SGNA/VNA ratio. Another distinctive, though expected, finding is that HRV, expressed globally as TP and divided into its three spectral components (VLF, LF and HF power), diminishes significantly seven weeks after acute MI.
Circadian rhythms of temporal dispersion in repolarization and in ANS activity
An important point in designing a pathophysiological study investigating how the autonomic nervous system influences myocardial repolarization is the time elapsing between an experimentally-induced MI and data recording. Accordingly, we analyzed recordings obtained seven weeks after experimentally-induced MI because our preceding study identified this as the time when the SGNA/VNA ratio reaches its maximum increase.13
Our findings in this study indicate that, even though the QT variables we studied partially differ in circadian behavior, temporal myocardial repolarization dispersion displays a circadian rhythm only seven weeks after MI, and is influenced at least in part by autonomic nervous system activity expressed as the SGNA/VNA ratio. Indeed, under this condition, all these QT indexes tend to increase during the day and diminish at night and do so in a circadian pattern similar to that for autonomic nerve activity. The SGNA/VNA ratio peaks between 6.00 and 20.00 and as do the three QT indices reflecting temporal dispersion in repolarization, even though their values peak over a slightly wider time range (between 4.00 and 21.00) (Figure 4). However, if we consider only QTpVI and TeVI variables, whose circadian rhythms appear strongly only after MI, the overlap between autonomic nerve activity and myocardial repolarization dispersion increases. Accordingly, the QTpVI, TeVI, and SGNA/VNA ratio peak values run relatively close to each other (QTpVI at 9.00, TeVI, at 10.00 and SGNA/VNA ratio at 12.00) (Figure 4). Conversely, all the QT variables reach their lowest values at the same time during the night (at 2.00) and SGVA/VNA ratio reaches its trough just an hour earlier. The lowest daily value for all the QT variables also coincides with the acrophase for TP, LF and HF power, presumably because RR variance belongs to the denominator in the Berger formula (see Methods). Hence, if TP diminishes, the indexes for myocardial repolarization dispersion worsen. Whatever the reason, at seven weeks after MI, the SGVA/VNA ratio and temporal dispersion in myocardial repolarization reach trough levels at almost the same time at night when sympathetic activity is low while vagal activity and HRV are high. Conversely, except for QTeVI, the other two QT indices reach values close to the maximum SGNA/VNA ratio from 7.0 to 14.00, precisely when TP, LF and HF power decline to their lowest levels (Figure 5). Our experimental findings on circadian rhythms therefore receive strong support from literature showing that SCD reaches its daily peak incidence when sympathetic activity is high and vagal activity low.24–27 The QTeVI acrophase coinciding with a relatively high SGNA/VNA ratio, around 18.00 (Figure 4), also helps to explain a second reported SCD peak incidence in the afternoon from 15.00 to 19.00.24–27
In conclusion, seven weeks after MI, two variables reflecting temporal myocardial repolarization dispersion, QTpVI and TeVI, peak in the morning whereas QTeVI peaks in the evening. Why QTeVI, a variable that depends on QTpVI and on TeVI, peaks in non-morning hours remains a curious circadian finding that we find hard to explain. Experimental evidence nevertheless indicates that QTe circadian variability could depend on daily functional variability in the transient outward potassium current (IKto) whereas other ion currents fail to exhibit this daily variability.28 To explain why some QT-derived variables differ in their circadian behavior, we conjecture that because the three QT intervals are differently influenced from ion channel activities, they might or might not undergo daily rhythmic variability. Furthermore, given the incomplete overlap between daily variability in the SGNA/VNA ratio and in the three temporal myocardial repolarization dispersion indexes, the post-MI circadian rhythm probably also reflects factors other than the autonomic nerve system. For example, the circadian variability for angiotensin II, a hormone able to modulate various RR spectral components29 and to inhibit some ion channel activities through the angiotensin 1 receptor,30 resembles the variability we observed here for myocardial repolarization dispersion (acrophase in the early morning).31 Furthermore, it is also true that, besides the undoubted influence of autonomic nervous system activity on myocardial repolarization dispersion, also anatomic factors such as fibrosis, inhomogeneous histological changes at the border zone of the infarction play a role in the development of ventricular arrhythmias.
Pathophysiological meaning of temporal dispersion in myocardial repolarization
All three QT indexes we studied, QTeVI, QTpVI and TeVI, are noninvasive markers of temporal myocardial repolarization dispersion that increase during CHF17,32 and correlate with SCD.18,33–36 We assessed all these QT variables because in a large prospective study conducted in recent years the investigators reported that QTeVI is associated with an increased risk of overall mortality during CHF though not specifically related to SCD.37 Particularly, the pathophysiological meaning of the Te interval remains controversial. Whereas some consider it a true index of transmural repolarization dispersion,38 others regard it even as a global index of ventricular repolarization dispersion.39–41 Hence, an increased Te is associated with increased mortality for SCD.42 Experimental and clinical evidence show that this repolarization phase is closely linked to sympathetic activity.14,15,43,44 The small, though significant, positive relation we found between TeVI and the SGNA/VNA ratio could therefore support its usefulness, since we showed that after MI, notwithstanding a preserved left ventricular ejection fraction, this terminal repolarization phase worsens owing to the increased sympathetic and reduced vagal activity or to both events. Conversely, the same terminal repolarization phase, under baseline conditions, seems unrelated to dispersion owing to the increased SGNA/VNA ratio. What pathophysiological mechanism underlies this finding remains unknown. We conjecture that a longer and non-homogeneous temporal duration in this repolarization phase could depend on remodeling and sympathetic innervation from ion channels and ion transport mechanisms, or both. Support for this highly speculative hypothesis comes from the finding that during CHF, L-type calcium current channels increase and potassiumchannel density decreases especially after an IKs alteration.45 Accordingly, during CHF, sympathetic hyperactivity, increased calcium inflow and reduced potassium outflow could lead to temporal Te heterogeneity and to an increased risk of malignant ventricular arrhythmias.
STUDY LIMITATIONS
We analyzed only 5-minute segments hourly rather than data for the 24 hours overall because no software program is yet available for analyzing QT intervals and their subcomponents (QTp and Te) in an error-free manner over the 24 hours. To eliminate eventual inter-operator variability, a single operator checked and measured all ECG intervals directly on the computer screen.
A second possible study limitation is the experimental model used, being the canine model still debated in evaluating the pathophysiological mechanisms leading to ventricular arrhythmias. Particularly, one of the drawbacks attributed to the canine model in this field is that, given its more predominant vagal activity,46 the occurrence of SCD events are greatly related to vagal overactivity, i.e. severe bradycardia and sinus arrest. However, our research group performed a number of continuous direct recordings of the SGNA and VNA in ambulatory dogs and we always showed a consistent circadian variation of SGNA and incidence of spontaneous ventricular arrhythmias, including SCD.20,22,23,47 Unfortunately, the present pathophysiological study design allows us to suggest, rather than conclude, about a possible link to SCD between the observed changes in autonomic nervous system activity and myocardial repolarization dispersion. Furthermore, we clearly recognize that our data did not show high correlation values, thus making it difficult to believe that it is possible to predict one parameter from the other (i.e. TeVI and SGNA/VNA ratio). Nevertheless, this was to be expected mainly because of the small number of recordings and rather scattered data. Furthermore, since sinus node dysfunction has been demonstrated during CHF,19–21 it might be because of a partial loss of relationship between iSGNA and ECG data.
CONCLUSIONS
Two months after an experimentally induced acute MI, the circadian rhythm in temporal myocardial repolarization dispersion seems to come under the control of the autonomic nerve activities. Conversely, under baseline conditions (before MI) they seem uncorrelated. Temporal dispersion in myocardial repolarization seems to worsen during the daytime and improve at night, reflecting daily pathophysiological variations in sympatho-vagal control. Our preliminary data, albeit limited to an experimental canine model, might help explain some of the mechanisms underlying malignant ventricular arrhythmias after an acute MI. Whether or not our data could be translated in humans to identify post-MI patients at highest risk for SCD warrants confirmation from larger prospective studies.
Acknowledgments
SOURCES OF FUNDING
Research reported in this manuscript was supported by the National Heart, Lung and Blood Institute of the National Institutes of Health under award number P01HL78931, R01HL71140, R21HL106554, a Medtronic-Zipes Endowment (P.-S.C.) and the Indiana University Health-Indiana University School of Medicine Strategic Research Initiative.
Footnotes
Publisher's Disclaimer: This is a PDF file of an unedited manuscript that has been accepted for publication. As a service to our customers we are providing this early version of the manuscript. The manuscript will undergo copyediting, typesetting, and review of the resulting proof before it is published in its final citable form. Please note that during the production process errors may be discovered which could affect the content, and all legal disclaimers that apply to the journal pertain.
DISCLOSURE: NONE
REFERENCES
- 1.Adabag AS, Therneau TM, Gersh BJ, Weston SA, Roger VL. Sudden death after myocardial infarction. JAMA. 2008;300(17):2022–2029. doi: 10.1001/jama.2008.553. [DOI] [PMC free article] [PubMed] [Google Scholar]
- 2.Yap YG, Duong T, Bland M, et al. Temporal trends on the risk of arrhythmic vs. non-arrhythmic deaths in high-risk patients after myocardial infarction: a combined analysis from multicentre trials. Eur Heart J. 2005;26(14):1385–1393. doi: 10.1093/eurheartj/ehi268. [DOI] [PubMed] [Google Scholar]
- 3.Vaseghi M, Shivkumar K. The role of the autonomic nervous system in sudden cardiac death. Prog Cardiovasc Dis. 2008;50(6):404–419. doi: 10.1016/j.pcad.2008.01.003. [DOI] [PMC free article] [PubMed] [Google Scholar]
- 4.Ajijola OA, Vaseghi M, Mahajan A, Shivkumar K. Bilateral cardiac sympathetic denervation: why, who and when? Expert Rev Cardiovasc Ther. 2012;10(8):947–949. doi: 10.1586/erc.12.93. [DOI] [PMC free article] [PubMed] [Google Scholar]
- 5.La Rovere MT, Bigger JT, Jr, Marcus FI, Mortara A, Schwartz PJ. Baroreflex sensitivity and heart-rate variability in prediction of total cardiac mortality after myocardial infarction. ATRAMI (Autonomic Tone and Reflexes After Myocardial Infarction) Investigators. Lancet. 1998 Feb 14;351(9101):478–484. doi: 10.1016/s0140-6736(97)11144-8. [DOI] [PubMed] [Google Scholar]
- 6.De Ferrari GM, Sanzo A, Bertoletti A, Specchia G, Vanoli E, Schwartz PJ. Baroreflex sensitivity predicts long-term cardiovascular mortality after myocardial infarction even in patients with preserved left ventricular function. J Am Coll Cardiol. 2007;50(24):2285–2290. doi: 10.1016/j.jacc.2007.08.043. [DOI] [PubMed] [Google Scholar]
- 7.Zhang Y, Mazgalev TN. Arrhythmias and vagus nerve stimulation. Heart Fail Rev. 2011;16(2):147–161. doi: 10.1007/s10741-010-9178-2. [DOI] [PubMed] [Google Scholar]
- 8.Brack KE, Coote JH, Ng GA. Vagus nerve stimulation protects against ventricular fibrillation independent of muscarinic receptor activation. Cardiovasc Res. 2011;91(3):437–446. doi: 10.1093/cvr/cvr105. [DOI] [PubMed] [Google Scholar]
- 9.Piccirillo G, Nocco M, Moisè A, et al. Influence of vitamin C on baroreflex sensitivity in chronic heart failure. Hypertension. 2003;41(6):1240–1245. doi: 10.1161/01.HYP.0000073581.74107.22. [DOI] [PubMed] [Google Scholar]
- 10.Rossi P, Ricci A, De Paulis R, et al. Epicardial ganglionated plexus stimulation decreases postoperative inflammatory response in humans. Heart Rhythm. 2012;9(6):943–950. doi: 10.1016/j.hrthm.2012.01.025. [DOI] [PubMed] [Google Scholar]
- 11.Rossi P, Bianchi S, Valsecchi S, et al. Endocardial vagal atrioventricular node stimulation in humans: reproducibility on 18-month follow-up. Europace. 2010;12(12):1719–1724. doi: 10.1093/europace/euq343. [DOI] [PubMed] [Google Scholar]
- 12.De Ferrari GM, Crijns HJ, Borggrefe M, et al. Chronic vagus nerve stimulation: a new and promising therapeutic approach for chronic heart failure. Eur Heart J. 2011;32(7):847–855. doi: 10.1093/eurheartj/ehq391. [DOI] [PubMed] [Google Scholar]
- 13.Han S, Kobayashi K, Joung B, et al. Electroanatomic remodeling of the left stellate ganglion after myocardial infarction. J Am Coll Cardiol. 2012;59(10):954–961. doi: 10.1016/j.jacc.2011.11.030. [DOI] [PMC free article] [PubMed] [Google Scholar]
- 14.Piccirillo G, Magrì D, Pappadà MA, et al. Autonomic nerve activity and the short-term variability of the Tpeak-Tend interval in dogs with pacing-induced heart failure. Heart Rhythm. 2012;9(12):2044–2050. doi: 10.1016/j.hrthm.2012.08.030. [DOI] [PubMed] [Google Scholar]
- 15.Piccirillo G, Rossi P, Mitra M, et al. Indexes of temporal myocardial repolarization dispersion and sudden cardiac death in heart failure: any difference? Ann Noninvasive Electrocardiol. 2013;18(2):130–139. doi: 10.1111/anec.12005. [DOI] [PMC free article] [PubMed] [Google Scholar]
- 16.Piccirillo G, Moscucci F, Pascucci M, et al. Influence of aging and chronic heart failure on temporal dispersion of myocardial repolarization. Clin Interv Aging. 2013;8:293–300. doi: 10.2147/CIA.S41879. [DOI] [PMC free article] [PubMed] [Google Scholar]
- 17.Berger RD, Kasper EK, Baughman KL, Marban E, Calkins H, Tomaselli GF. Beat-to-beat QT interval variability: novel evidence for repolarization lability in ischemic and nonischemic dilated cardiomyopathy. Circulation. 1997;96(5):1557–1565. doi: 10.1161/01.cir.96.5.1557. [DOI] [PubMed] [Google Scholar]
- 18.Piccirillo G, Magrì D, Matera S, et al. QT variability strongly predicts sudden cardiac death in asymptomatic subjects with mild or moderate left ventricular systolic dysfunction: a prospective study. Eur Heart J. 2007;28(11):1344–1350. doi: 10.1093/eurheartj/ehl367. [DOI] [PubMed] [Google Scholar]
- 19.Piccirillo G, Magrì D, Ogawa M, et al. Autonomic nervous system activity measured directly and QT interval variability in normal and pacing-induced tachycardia heart failure dogs. J Am Coll Cardiol. 2009;54(9):840–850. doi: 10.1016/j.jacc.2009.06.008. [DOI] [PMC free article] [PubMed] [Google Scholar]
- 20.Ogawa M, Zhou S, Tan AY, et al. Left stellate ganglion and vagal nerve activity and cardiac arrhythmias in ambulatory dogs with pacing-induced congestive heart failure. J Am Coll Cardiol. 2007;50(4):335–343. doi: 10.1016/j.jacc.2007.03.045. [DOI] [PubMed] [Google Scholar]
- 21.Piccirillo G, Ogawa M, Song J, et al. Power spectral analysis of heart rate variability and autonomic nervous system activity measured directly in healthy dogs and dogs with tachycardia-induced heart failure. Heart Rhythm. 2009;6(4):546–552. doi: 10.1016/j.hrthm.2009.01.006. [DOI] [PMC free article] [PubMed] [Google Scholar]
- 22.Tan AY, Zhou S, Ogawa M, et al. Neural mechanisms of paroxysmal atrial fibrillation and paroxysmal atrial tachycardia in ambulatory canines. Circulation. 2008;118:916–925. doi: 10.1161/CIRCULATIONAHA.108.776203. [DOI] [PMC free article] [PubMed] [Google Scholar]
- 23.Choi E-K, Shen MJ, Han S, et al. Intrinsic cardiac nerve activity and paroxysmal atrial tachyarrhythmia in ambulatory dogs. Circulation. 2010;121:2615–2623. doi: 10.1161/CIRCULATIONAHA.109.919829. [DOI] [PMC free article] [PubMed] [Google Scholar]
- 24.Arntz HR, Willich SN, Oeff M, et al. Circadian variation of sudden cardiac death reflects age-related variability in ventricular fibrillation. Circulation. 1993;88(5):2284–2289. doi: 10.1161/01.cir.88.5.2284. [DOI] [PubMed] [Google Scholar]
- 25.Willich SN, Goldberg RJ, Maclure M, Perriello L, Muller JE. Increased onset of sudden cardiac death in the first three hours after awakening. Am J Cardiol. 1992;70(1):65–68. doi: 10.1016/0002-9149(92)91391-g. [DOI] [PubMed] [Google Scholar]
- 26.Arntz HR, Willich SN, Schreiber C, Brüggemann T, Stern R, Schultheiss HP. Diurnal, weekly and seasonal variation of sudden death. Population-based analysis of 24,061 consecutive cases. Eur Heart J. 2000;21(4):315–320. doi: 10.1053/euhj.1999.1739. [DOI] [PubMed] [Google Scholar]
- 27.Nakanishi N, Nishizawa S, Kitamura Y, et al. Circadian, weekly, and seasonal mortality variations in out-of-hospital cardiac arrest in Japan: analysis from AMI-Kyoto Multicenter Risk Study database. Am J Emerg Med. 2011;29(9):1037–1043. doi: 10.1016/j.ajem.2010.06.018. [DOI] [PubMed] [Google Scholar]
- 28.Jeyaraj D, Haldar SM, Wan X, et al. Circadian rhythms govern cardiac repolarization and arrhythmogenesis. Nature. 2012;483(7387):96–99. doi: 10.1038/nature10852. [DOI] [PMC free article] [PubMed] [Google Scholar]
- 29.Bonaduce D, Marciano F, Petretta M, et al. Effects of converting enzyme inhibition on heart period variability in patients with acute myocardial infarction. Circulation. 1994;90(1):108–113. doi: 10.1161/01.cir.90.1.108. [DOI] [PubMed] [Google Scholar]
- 30.Wang YH, Shi CX, Dong F, Sheng JW, Xu YF. Inhibition of the rapid component of the delayed rectifier potassium current in ventricular myocytes by angiotensin II via the AT1 receptor. Br J Pharmacol. 2008;154(2):429–439. doi: 10.1038/bjp.2008.95. [DOI] [PMC free article] [PubMed] [Google Scholar]
- 31.Cugini P, Lucia P. Circadian rhythm of the renin-angiotensin-aldosterone system: a summary of our research studies. Clin Ter. 2004;155(7–8):287–291. [PubMed] [Google Scholar]
- 32.Piccirillo G, Magnanti M, Matera S, et al. Age and QT variability index during free breathing, controlled breathing and tilt in patients with chronic heart failure and healthy control subjects. Transl Res. 2006;148(2):72–78. doi: 10.1016/j.trsl.2006.02.001. [DOI] [PubMed] [Google Scholar]
- 33.Haigney MC, Zareba W, Gentlesk PJ, et al. QT interval variability and spontaneous ventricular tachycardia or fibrillation in the Multicenter Automatic Defibrillator Implantation Trial (MADIT) II patients. J Am Coll Cardiol. 2004;44(7):1481–1487. doi: 10.1016/j.jacc.2004.06.063. [DOI] [PubMed] [Google Scholar]
- 34.Haigney MC, Zareba W, Nasir JM, et al. Gender differences and risk of ventricular tachycardia or ventricular fibrillation. Heart Rhythm. 2009;6(2):180–186. doi: 10.1016/j.hrthm.2008.10.045. [DOI] [PubMed] [Google Scholar]
- 35.Dobson CP, La Rovere MT, Olsen C, et al. 24-hour QT variability in heart failure. J Electrocardiol. 2009;42(6):500–504. doi: 10.1016/j.jelectrocard.2009.06.021. [DOI] [PubMed] [Google Scholar]
- 36.Dobson CP, La Rovere MT, Pinna GD, et al. QT variability index on 24-hour Holter independently predicts mortality in patients with heart failure: analysis of Gruppo Italiano per lo Studio della Sopravvivenza nell'Insufficienza Cardiaca (GISSI-HF) trial. Heart Rhythm. 2011;8(8):1237–1242. doi: 10.1016/j.hrthm.2011.03.055. [DOI] [PubMed] [Google Scholar]
- 37.Tereshchenko LG, Cygankiewicz I, McNitt S, et al. Predictive value of beat-to-beat QT variability index across the continuum of left ventricular dysfunction: competing risks of noncardiac or cardiovascular death and sudden or nonsudden cardiac death. Circ Arrhythm Electrophysiol. 2012;5(4):719–727. doi: 10.1161/CIRCEP.112.970541. [DOI] [PMC free article] [PubMed] [Google Scholar]
- 38.Antzelevitch C, Shimizu W, Yan GX, et al. The M cell: its contribution to the ECG and to normal and abnormal electrical function of the heart. J Cardiovasc Electrophysiol. 1999;10(8):1124–1152. doi: 10.1111/j.1540-8167.1999.tb00287.x. [DOI] [PubMed] [Google Scholar]
- 39.Xia Y, Liang Y, Kongstad O, et al. In vivo validation of the coincidence of the peak and end of the T wave with full repolarization of the epicardium and endocardium in swine. Heart Rhythm. 2005;2(2):162–169. doi: 10.1016/j.hrthm.2004.11.011. [DOI] [PubMed] [Google Scholar]
- 40.Xia Y, Liang Y, Kongstad O, Holm M, Olsson B, Yuan S. Tpeak-Tend interval as an index of global dispersion of ventricular repolarization: evaluations using monophasic action potential mapping of the epi- and endocardium in swine. J Interv Card Electrophysiol. 2005;14(2):79–87. doi: 10.1007/s10840-005-4592-4. [DOI] [PubMed] [Google Scholar]
- 41.Opthof T, Coronel R, Wilms-Schopman FJ, et al. Dispersion of repolarization in canine ventricle and the electrocardiographic T wave: Tp-e interval does not reflect transmural dispersion. Heart Rhythm. 2007;4(3):341–348. doi: 10.1016/j.hrthm.2006.11.022. [DOI] [PubMed] [Google Scholar]
- 42.Panikkath R, Reinier K, Uy-Evanado A, et al. Prolonged Tpeak-to-tend interval on the resting ECG is associated with increased risk of sudden cardiac death. Circ Arrhythm Electrophysiol. 2011;4(4):441–447. doi: 10.1161/CIRCEP.110.960658. [DOI] [PMC free article] [PubMed] [Google Scholar]
- 43.Zhou S, Jung BC, Tan AY, et al. Spontaneous stellate ganglion nerve activity and ventricular arrhythmia in a canine model of sudden death. Heart Rhythm. 2008;5(1):131–139. doi: 10.1016/j.hrthm.2007.09.007. [DOI] [PubMed] [Google Scholar]
- 44.Shimizu W, Noda T, Takaki H, et al. Epinephrine unmasks latent mutation carriers with LQT1 form of congenital long-QT syndrome. J Am Coll Cardiol. 2003;41(4):633–642. doi: 10.1016/s0735-1097(02)02850-4. [DOI] [PubMed] [Google Scholar]
- 45.Vaseghi M, Shivkumar K. The role of the autonomic nervous system in sudden cardiac death. Prog Cardiovasc Dis. 2008;50(6):404–419. doi: 10.1016/j.pcad.2008.01.003. [DOI] [PMC free article] [PubMed] [Google Scholar]
- 46.Matsunaga T, Harada T, Mitsui T, et al. Spectral analysis of circadian rhythms in heart rate variability of dogs. Am J Vet Res. 2001;62(1):37–42. doi: 10.2460/ajvr.2001.62.37. [DOI] [PubMed] [Google Scholar]
- 47.Jung BC, Dave AS, Tan AY, et al. Circadian variations of stellate ganglion nerve activity in ambulatory dogs. Heart Rhythm. 2006;3:78–85. doi: 10.1016/j.hrthm.2005.09.016. [DOI] [PubMed] [Google Scholar]


