Abstract
Background:
Stryphnodendron adstringens (Mar.) Coville is a native plant from Brazil, rich in phenolic compounds and used on popular medicine as a wound healing agent, in the treatment of gastric lesions and as antimicrobial.
Materials and Methods:
Ultrassound-assisted extraction (UAE) was applied to extraction of epigallocatechin gallate (EGCG), total polyphenols (TP) and total tannins (TT) content from barks of Stryphnodendron adstringens (Mar.) Coville. Several operating parameters, namely extraction time (min), liquid to solid ratio (mg/mL), ethanolic strength (%, v/v), were optimized using response surface methodology (RSM) with a Box-Behnken design.
Results:
By using the desirability function approach, the optimum UAE conditions to obtain desirable extraction yields for all these metabolites simultaneously were found at the extraction time of 30 min, solid to liquid ratio of 4 mg/mL and ethanolic strength of 65. Under these conditions, the epigallocatechin gallate, total polyphenols and total tannins content were 0.31; 22.95 and 11.95 % (w/w), respectively.
Conclusion:
The results indicated that knowledge gained from this study should be helpful to further exploit and apply this resource and also showed the feasibility of ultrasound-assisted extraction for obtaining GEGC, TP and TT from barks of S. adstrigens.
Keywords: Desirability function, optimization, response surface methodology, Stryphnodendron adstringens, ultrassound-assisted extraction
INTRODUCTION
Stryphnodendron adstringens (Mar.) Coville is a native plant from Brazilian Savannah popularly known as barbatimão.[1] Many therapeutic properties are attributed to S. adstringens as gastric antiulcerogenic,[2,3] trypanocidal,[4] antimicrobial,[5,6,7] antioxidant[8,9] and as wound healing.[10]
Medicinal properties are related to high phenolics compounds as tannins in the barks, at least 8%.[11] Flavan-3-ols, prodelphinidins and prorobinetinidins were isolated and identified.[12] Between flavan-3-ols identified, epigallocatechin-3-O-gallate (EGCG) stands out for being an antioxidant with antimutagenic and anticarcinogenic activities.[13]
Recently, the use of S. adstringens in the production of an herbal medicine with anti-inflammatory and wound healing were related.[14] In addition, there are 16 patent applications filed in National Institute of Industrial Property (INPI) about products containing S. adstringens with various applications.[15] However, to ensure safety, efficacy and quality of medicines regulatory agencies as FDA (Food and Drug Administration) and Agência Nacional de Vigilância Sanitária (ANVISA - Brazilian Health Surveillance Agency) require that herbal extracts are standardized.[11,16] This standardization occur through pharmacognostic characterization, identification of chemical composition by various chromatographic techniques and biological activity of the whole plant.[17,18]
One of the key steps in phytopharmaceutical technology studies is the extraction method that will be used to extract the maximum particular constituent or group from the plant raw material, leaving as residue the inert or undesirable.[19] (HELOU, 1989)(Helou, 1989) In cases such as this, where many factors influence the response of the system, optimization of the extraction procedure can be carried out using multivariate statistical tools.[20] Among the most relevant multivariate techniques used in analytical optimization, response surface methodology (RSM) allows the evaluation of the effect of multiple variables and their interactions on the variables output with reduced number of attempts, which aims improve the performance of the systems and increase the yield of the processes without increasing the cost.[21,22] (BAŞ; BOYACI, 2007; WU et al., 2007)(Baş and Boyaci, 2007; Wu, Cui, Tang, and Gu, 2007) Aiming to approximate a response function to experimental data that cannot be described by linear functions, experimental designs for quadratic response surfaces should be used, such as three-level factorial, central composite, Doehlert designs and Box–Behnken.[23]
Despite the therapeutic potential of S. adstringens and its popular use and industrial pharmaceutics importance, there are no data about supply an optimal method to extract secondary metabolites for quality control of raw material or biological assays. The aim of this work was the optimization of ultrasound-assisted extraction procedure for determining epigallocatechin gallate (EGCG), total polyphenols (TP) and total tannins (TT) content from barks of S. adstrigens. To achieve this were investigated extraction time, solid to liquid ratio and ethanolic strength influence at UAE. Experimental design combined with desirability functions was applied for optimization purposes.
MATERIALS AND METHODS
Chemicals
EGCG (95%) and tannic acid (98%) were purchased from Sigma-Aldrich® (Sigma-Aldrich Brasil Ltda, São Paulo, Brazil). Acetonitrile was analytical grade (Merck KGaA, Darmstadt, Germany). Additionally, phosphoric acid (Merck KGaA, Darmstadt, Germany), and ultrapure water from a Milli-Q system (Millipore®, Bedford, MA, USA) were used.
Herbal material
The plant material was bought at Paladar condimentos company ® (Brazil, Goiás) and their authenticity was confirmed by Dr. José R. Paula. The sample was cleaned and dried in an oven (Solab Scientific®) with forced circulation and air renewal at 40°C for 48 h. After dehydration, the dried plant material was ground in a knife mill TE-625 (Tecnal Ltda, Piracicaba, SP, Brazil) and stored sheltered from light and moisture. The pharmacognostic characterization of plant material revealed moisture content of 8.74 ± 0.09%, total ash of 1.45 ± 0.04% and particle size of 344.50 μm.[24]
Total polyphenol contents (TPc) and total tannin contents (TTc)
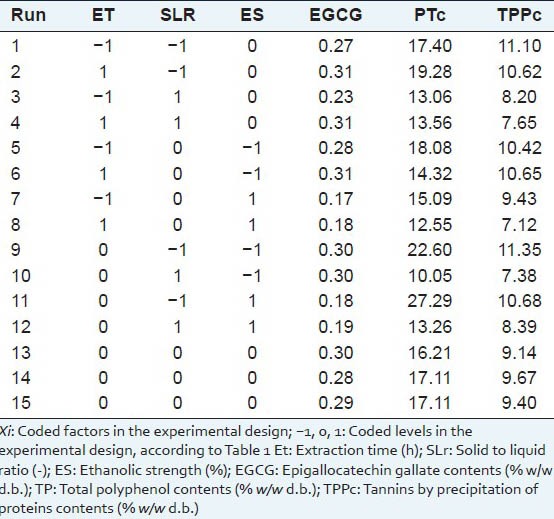
TPc and TTc were determined following previously described methods.[25,26] Solid to liquid ratio (4, 6, 8 mg/mL) were diluted in hidroalcoholic solution (65, 80 and 95%) in both TPc and TTc measurements Table 2. The standards curves were prepared with tannic acid, at the dilutions: 100, 200, 300, 400, 500 and 600 μg/mL.
Table 2.
Experimental results
Instrumentation and chromatographic conditions
The presence of EGCG was confirmed by TLC (thin layer chromatographic) on silica gel 60 F254 layers using etil acetate:toluene:formic acid:water (80:10:5:5 v/v/v) as mobile phase. (Brazilian pharmacopeia, 1988) The TLC analysis of the EGCG compound at sample revealed a retention factor of 0.57 as observed for the standard EGCG. In the HPLC method, EGCG was identified and quantified using a HPLC Waters® e2695 (Milford, Massachusetts, USA), comprising a quaternary pump, an on-line degasser, an autosampler and a photodiode array detector model 2998. The treatment of data and control of HPLC equipment were performed in Empower® 2.0 software. A gradient elution was performed on an Agilent Technologies® (USA) C18 (250 mm × 46 mm × 5 μm). The presence of EGCG was confirmed by comparison of their retention time, spiking the extract with standard and overlaying UV spectra with standard compound at a 208 nm.
The mobile phase was 0.1% (v/v) orthophosphoric acid in water (A) and acetonitrile (v/v) (B) at a flow rate of 1 mL/min at 30°C. The program was set at: 0 min to 10 min: 90% (A), 18 min: 75% (A), 22 min: 50% (A), 26 to 30 min 90% (A). All solutions were degassed and filtered through a 0.45 μm pore size filter (Millipore, USA).
The method presented linearity over the range from 0.002 to 0.024 mg/mL (R2 = 0.995); limit of detection and limit of quantification of 0.09 μg/mL and 0.3 μg/mL, respectively; suitable selectivity; accuracy of 99.06%; within-and between day precisions with relative standard deviation values of 2.46 and 2.70%, respectively.
Design of experiments
Box-Behnken experimental design (33) with three factors and three levels was used to optimize and evaluate main effects, interaction effects and quadratic effects of the process variables.[27] The factors studied were: extraction time (min, ET), liquid to solid ratio (mg/mL, SLR) and the ethanolic strength (v/v%, ES) Table 1. Experiments were performed using a 40 kHz ultrasonic UNIQUE® (USC 4800).
Table 1.
Code and level of factors chosen for the trials

The response function applied was a second-order polynomial regression model, given by Equation 1:

Where y represents the response variables, β0 is a constant, βi, βii and βij are the linear, quadratic and cross-product coefficients, respectively. Independent variables are represented by Xi and Xj.
Desirability function (DF) is a technique to determine of input variables that can give the optimum conditions for one or more responses. The procedure involves three steps: (1) predicting responses on the dependent variable by fitting the observed responses using an equation, based on the levels of the independent variables, (2) finding the levels of the independent variables that simultaneously produce the most desirable predicted responses on the dependent variables and (3) maximize the overall desirability with respect to the controllable variables.[28,29] Therefore, the main advantages of using desirability functions are to obtain qualitative and quantitative responses by the simple and quick transformation of different responses for one measurement. Firstly, the response is converted into a particular desirability function that varies from 0 to 1. The individual desirability scores for the predicted values for each dependent variable are then combined into overall desirability function by computing their geometric mean of different individual values. The desirability 1 is for maximum and desirability 0 is for non-desirable situations or minimum. All statistical analysis was conducted using the software Design-Expert® version 7.0.[30] The factors with significance higher than 5% (P < 0.05) was considered. All experiments were conducts in triplicate.
RESULTS AND DISCUSSION
The results of UAE experiments are summarized in Table 2. Under the established conditions, EGCG values ranged from 0.17 to 0.31% (w/w), the TPc ranged from 10.05 to 27.29 % (w/w) and TPPc 7.12 to 11.35% (w/w).
The ANOVA Table 2 showed that ET, ES and ES2 exerted an influence on the EGCG content at a significance level of 5%. None of ET2, SLR, SLR2 nor the interactions was significant. Moreover, increasing ET and ES2 had a positive influence on EGCG content; besides, there are a negative relationship between EGCG and ES. Figure 1 presents the surface responses of EGCG as a function of ET and ES. The fitted equation, with correlation coefficient R = 0.9863, is given by:
Figure 1.
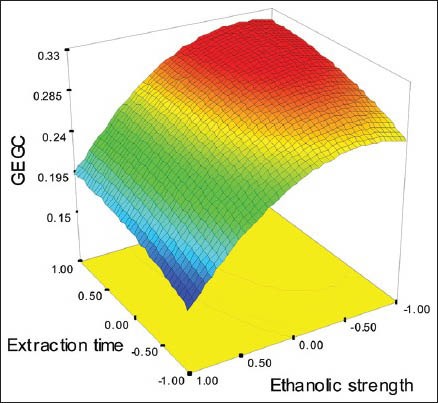
Response surface of EGCG as a function of extraction time (ET) and ethanolic strength (ES)
EGCG = 0.29 + 0.02ET − 0.058ES − 0.045ES2
Lower values of ES and higher ET increase the extraction of EGCG as can be seen in Figure 1.
Figure 2 shows a surface plot of total phenols content (TPc) as a function of the ET and SLR. The surface shows that the SLR exerted a negative influence on TPc, which was confirmed by ANOVA at level of 5% of significance. The surface also shows that ET exerted a negative nonlinear effect on TPc, with the higher values of TPc around the level 0 of extraction time due the quadratic behavior of this model, indicating that the optimum point is close of this region. The fitted equation presented correlation coefficient R = 0.8682.
Figure 2.
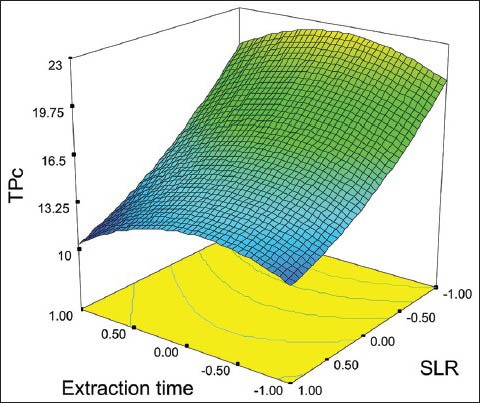
Response surface of TPc as a function of extraction time (ET) and solid liquid ratio (SLR)
TPc = 16.81 − 2.14ET2 − 5.58SLR + 1.15SLR2
In accordance to ANOVA, only the SLR exerted linear influence on the TPPc at a significance level of 5%. None of ET, ET2, SLR2, ES, ES2 nor the interactions was significant. Moreover, increasing the SLR had a negative influence on total tannins content. The fitted equation, with correlation coefficient R = 0.9151, is given by:
TTc = 9.91 − 1.52SLR.
Effect of extraction parameters on different phenolic compounds
The progressive addition of extraction time improves the EGCG and TP contends. This results are in good agreement with.[31] The UAE facilitated the swelling and hydration causing the enlargement in the pores of the cell wall, this will contributes to diffusion process and therefore the enhancing mass transfer, so the major extraction time contributes to metabolites extraction.[32]
The increased solid to liquid ratio showed negative TPc and TTc Table 2, which probably reflects a tendency toward solvent saturation or, at least, a lessening in extraction effectiveness due to the high content of both.
A combination of alcohol with water is more effective in extracting EGCG compounds than alcohol only. Pure EGCG is soluble in water at least to 5 mg/mL, giving a clear faint yellow solution. HPLC analysis confirmed the decreasing of ethanolic strength was most effective, among solvents tested, for the prolonged extraction (30 min) of catechins, especially in the extraction of EGCG, the dominant catechin in tea leaves.[33]
Extraction optimization
The models adequacies were checked accounting for Pearson's correlation values, which were higher than 0.80. This, together with the fact that the F values of fitted models were significant (P < 0.05), indicates that the regression models presented a great adjust, being suitable to predict the responses and explain their behavior.[34]
In further analysis of these responses, optimization was carried out using Design Expert 7.0 to obtain the criteria for maximum EGCG, TPc and TPPc. By applying a desirability function method, a total of 13 conditions were found to satisfy the goal, all with good desirability values, the ET ranged from 27.3-32.85 min; solid to liquid ratio ranged of 4 mg/mL and ethanolic strength between 65 to 74.6%. At these conditions, the predicted yield was 0.31% (w/w) for EGCG, 21.95-22.31% (w/w) for TPc and 11.49-11.95% (w/w) for TTc, see Figure 3. To confirm the theoretical results, three parallel experiments were carried out under those theorical conditions, among the 13 optimal conditions provide by desirability function method all conditions showed good values of desirability, extraction time close and the same solid to liquid ratio; so the economy of the method was directed to choose, were tested the conditions with high, medium and low ethanolic strength. The theoretical and experimental condition are shown in Tables 3 and 4 and the condition 3, besides being the most economical, also presented the best yields with all experimental values close to theoretical, 0.31%(w/w) to EGCG, 22.50 % (w/w) to TP and 11.95% (w/w) to TT of EGCG, TPc and TPPc 0.31, 22.50 and 11.95% (w/w). In conclusion, a new optimization method based on a combination of UAE and RSM was investigated for the extraction of EGCG, TPc and TPPc. The RSM method was based on a three-level, three-variable (extraction time, solid to liquid ratio and ethanol strength extraction). The maximum extraction yield of EGCG, TPc and TPPc 0.31, 22.50 and 11.95% (w/w) was obtained by performing UAE with 65 % ethanol, in SLR of 4 mg/mL for 30 min. The results indicated that the UAE-RSM approach was effective for maximizing the extraction of EGCG, total phenol and tannins and the knowledge gained from this study should be useful for further exploitation and application of the resource.
Figure 3.
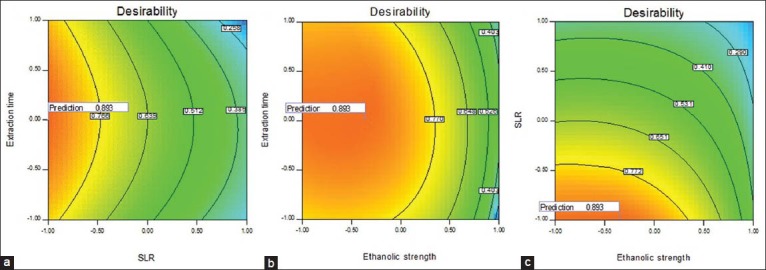
Countour plot of Desirability as a function of extraction time (ET) and solid to liquid ratio (SLR) (a); extraction time (ET) and ethanolic strength (ES) (b); solid to liquid ratio (SLR) and ethanolic strength (ES) (c)
Table 3.
Summary of factor effects on powder properties
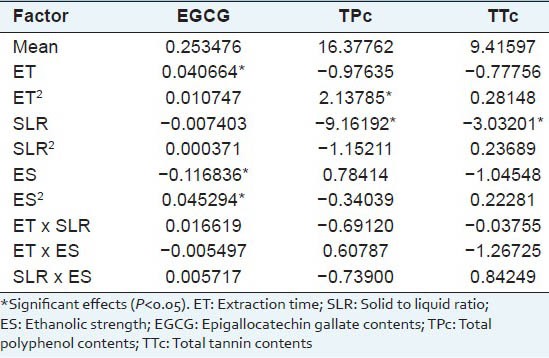
Table 4.
Theoretical and experimental conditions to validate the desirability model

Footnotes
Source of Support: Nil
Conflict of Interest: None declared.
REFERENCES
- 1.Agra MF, Silva KN, Basílio IJ, Freitas PF, Barbosa-Filho JM. Survey of medicinal plants used in the region Northeast of Brazil. Rev Bras Farmacogn. 2008;18:472–508. [Google Scholar]
- 2.Audi EA, Toledo DP, Peres PG, Kimura E, Pereira WK, de Mello JC, et al. Gastric antiulcerogenic effects of Stryphnodendron adstringens in rats. Phytother Res. 1999;13:264–6. doi: 10.1002/(SICI)1099-1573(199905)13:3<264::AID-PTR443>3.0.CO;2-R. [DOI] [PubMed] [Google Scholar]
- 3.Martins DT, Lima JC, Rao VS. The acetone soluble fraction from bark extract of Stryphnodendron adstringens (Mart.). Coville inhibits gastric acid secretion and experimental gastric ulceration in rats. Phytother Res. 2002;16:427–31. doi: 10.1002/ptr.928. [DOI] [PubMed] [Google Scholar]
- 4.Herzog-Soares JD, Alves RK. Trypanocidal activity in vivo of Stryphnodendron adstringens (true barbatimão) and Caryocar brasiliensis (pequi) Rev Bras Farmacogn. 2002;12:2–4. [Google Scholar]
- 5.Audi EA. Biological Activity and Quality Control of Extract and Stem Bark From Stryphnodendron adstringens. Acta Farm Bonaer. 2004;23:328–33. [Google Scholar]
- 6.Ishida K, de Mello JC, Cortez DA, Filho BP, Ueda-Nakamura T, Nakamura CV. Influence of tannins from Stryphnodendron adstringens on growth and virulence factors of Candida albicans. J Antimicrob Chemother. 2006;58:942–9. doi: 10.1093/jac/dkl377. [DOI] [PubMed] [Google Scholar]
- 7.Santos VR, Gomes RT, Oliveira RR, Cortés ME, Brandão MGL. Susceptibility of oral pathogenic microorganisms to aqueous and ethanolic extracts of Stryphnodendron adstringens (barbatimão) Int J Dent. 2009;8:1–5. [Google Scholar]
- 8.Sanches AC, Lopes GC, Nakamura CV, Dias Filho BP, Mello JC. Antioxidant and antifungal activities of extracts and condensed tannins from Stryphnodendron obovatum Benth. Braz J Pharm Sci. 2005;41:101–7. [Google Scholar]
- 9.Souza TM, Severi JA, Silva VY, Pietro RC. Bioprospecting antioxidant and antimicrobial activity of Stryphnodendron adstringens (Mart.) Coville (Leguminosae-Mimosoidae) barks. J Basic Appl Pharm Sci. 2007;28:221–6. [Google Scholar]
- 10.Shimizu BJ, Eurides D, Beletti ME, Freitas PMC, Chang R. 5% (w/w)Extract barbatimão in hydroxyethylcellulose applied to skin wounds in mice experimentally produced gel. Vet Not. 2009;15:21–7. [Google Scholar]
- 11.5th ed. part 1. São Paulo: Atheneu; 2010. Brazil (2010) Brazilian Pharmacopoeia. [Google Scholar]
- 12.Mello JC. Taninos de Stryphnodendron adstringens (-(Martius) Coville - (Mimosaceae) - Barbatimão. Cad Farm. 1997;13:105–9. [Google Scholar]
- 13.Kuroda Y, Hara Y. Antimutagenic and anticarcinogenic activity of tea polyphenols. Mutat Res. 1999;436:69–97. doi: 10.1016/s1383-5742(98)00019-2. [DOI] [PubMed] [Google Scholar]
- 14.Minatel DG, Pereira AM, Chiaratti TM, Pasqualin L, Oliveira JC, Couto LB, et al. Clinical study for the validation of the efficacy of ointment containing barbatimao (Stryphnodendron adstringens (Mart.). Coville) on healing of decubitus ulcers. Rev Bras Med. 2010;67:250–6. [Google Scholar]
- 15.Rio de Janeiro: National Institute of Industrial Property. Ministry of Science and Technology; 2013. [Last accessed on 2013 Jul 20]. INPI. Available from: http://www.inpi.gov.br/portal . [Google Scholar]
- 16.FDA. US Food and Drug Administration. In Drug Safety and Availability. 2010 [Google Scholar]
- 17.Patel PM, Patel NM, Goyal RK. Quality control of herbal products. Ind pharma. 2006;5:26–30. [Google Scholar]
- 18.Choudhary N, Sekhon BS. An overview of advances in the standardization of herbal drugs. J Pharm Educ Res. 2011;2:55–70. [Google Scholar]
- 19.Helou JH. Paraná: Rev Bras Farmacogn; 1989. Pharmaceutical preparations obtained by extraction; pp. 106–69. [Google Scholar]
- 20.Junior SB, de Marchi Tavares, de Melo A, Zini CA, Godoy HT. Optimization of the extraction conditions of the volatile compounds from chili peppers by headspace solid phase micro-extraction. J Chromatogr A. 2011;1218:3345–50. doi: 10.1016/j.chroma.2010.12.060. [DOI] [PubMed] [Google Scholar]
- 21.Baş D, Boyacıİ H. Modeling and optimization I: Usability of response surface methodology. J Food Eng. 2007;78:836–45. [Google Scholar]
- 22.Wu Y, Cui SW, Tang J, Gu X. Optimization of extraction process of crude polysaccharides from boat-fruited sterculia seeds by response surface methodology. Food Chem. 2007;105:1599–605. [Google Scholar]
- 23.Bezerra MA, Santelli RE, Oliveira EP, Villar LS, Escaleira LA. Response surface methodology (RSM) as a tool for optimization in analytical chemistry. Talanta. 2008;76:965–77. doi: 10.1016/j.talanta.2008.05.019. [DOI] [PubMed] [Google Scholar]
- 24.Arlington: AOAC; 1998. AOAC (1998). Official methods of analysis of the Association of Official Analytical Chemists. In ASSOCIATION OF OFFICIAL ANALYTICAL CHEMISTS. [Google Scholar]
- 25.Waterman PG, Mole S. A critical analysis of techniques for measuring tannins in ecological studies I: Techniques for chemically defining tannins. Oecologia. 1987;72:137–47. doi: 10.1007/BF00385058. [DOI] [PubMed] [Google Scholar]
- 26.Waterman PG, Mole S. A critical analysis of techniques for measuring tannins in ecological studies II: Techniques for chemically defining tannins. Oecologia. 1987;72:148–56. doi: 10.1007/BF00385059. [DOI] [PubMed] [Google Scholar]
- 27.Box GE, Hunter WG, Hunter JS. New York: John Wiley and Sons; 1978. Statistics for Experimenters. [Google Scholar]
- 28.Harrington EC. The Desirability Function. Ind Qual Control. 1965;21:494–8. [Google Scholar]
- 29.Derringer G, Suich R. Simultaneous Optimization of several Response Variables. J Qual Tech. 1980;12:214–9. [Google Scholar]
- 30.Stat-Ease IM. (2005) Design-Expert, Minneapolis, MN, USA, 7.0.0. 2005 [Google Scholar]
- 31.Wang X. Optimisation of ultrasound assisted extraction of phenolic compounds from Sparganii rhizoma with response surface methodology. Ultrason Sonochem. 2013;20:846–54. doi: 10.1016/j.ultsonch.2012.11.007. [DOI] [PubMed] [Google Scholar]
- 32.Vinatoru M. An overview of the ultrasonically assisted extraction of bioactive principles from herbs. Ultrason Sonochem. 2001;8:303–13. doi: 10.1016/s1350-4177(01)00071-2. [DOI] [PubMed] [Google Scholar]
- 33.Rusak G, Komes D, Likić S, Horžić D, Kovač M. Phenolic content and antioxidative capacity of green and white tea extracts depending on extraction conditions and the solvent used. Food Chem. 2008;110:852–8. doi: 10.1016/j.foodchem.2008.02.072. [DOI] [PubMed] [Google Scholar]
- 34.Paulucci VP, Couto RO, Teixeira CC, Freitas LA. Optimization of the extraction of curcumin from Curcuma longa rhizomes. Rev Bras Farmacogn. 2013;23:94–100. [Google Scholar]


