

Abstract
The identification of recurrent gene rearrangements in the clinical laboratory is the cornerstone for risk stratification and treatment decisions in many malignant tumors. Studies have reported that targeted next-generation sequencing assays have the potential to identify such rearrangements; however, their utility in the clinical laboratory is unknown. We examine the sensitivity and specificity of ALK and KMT2A (MLL) rearrangement detection by next-generation sequencing in the clinical laboratory. We analyzed a series of seven ALK rearranged cancers, six KMT2A rearranged leukemias, and 77 ALK/KMT2A rearrangement–negative cancers, previously tested by fluorescence in situ hybridization (FISH). Rearrangement detection was tested using publicly available software tools, including Breakdancer, ClusterFAST, CREST, and Hydra. Using Breakdancer and ClusterFAST, we detected ALK rearrangements in seven of seven FISH-positive cases and KMT2A rearrangements in six of six FISH-positive cases. Among the 77 ALK/KMT2A FISH-negative cases, no false-positive identifications were made by Breakdancer or ClusterFAST. Further, we identified one ALK rearranged case with a noncanonical intron 16 breakpoint, which is likely to affect its response to targeted inhibitors. We report that clinically relevant chromosomal rearrangements can be detected from targeted gene panel–based next-generation sequencing with sensitivity and specificity equivalent to that of FISH while providing finer-scale information and increased efficiency for molecular oncology testing.
The detection of recurrent chromosomal rearrangements by cytogenetics was one of the earliest clinical molecular oncology assays and continues to play a major role in cancer diagnosis and prognosis.1,2 Although translocations in the clinical laboratory are generally detected by cytogenetics, fluorescence in situ hybridization (FISH), or RT-PCR, studies have demonstrated that they may also be detected by next-generation sequencing (NGS) of DNA or RNA.3–5 DNA-level translocations can be detected in particular areas of interest by first performing hybrid capture enrichment to target one or both partner genes in a translocation, followed by NGS.4,6 NGS-based translocation detection has several advantages over conventional clinical laboratory methods, such as the ability to precisely define the breakpoint region, detect cryptic rearrangements and unknown partner genes, and run in parallel with gene mutation detection.
Chromosomal rearrangements are detected in the clinical laboratory by routine cytogenetics, FISH, or RT-PCR; however, these methods have limitations. Cytogenetic studies, including chromosome analysis and metaphase FISH, require actively dividing cells, which can be especially difficult to obtain from solid tumors. In addition, chromosome analysis is of limited resolution, particularly in oncology specimens, and is therefore insensitive to cryptic and complex rearrangements.5,7,8 Some rearrangements can be assayed via RNA-based RT-PCR methods, but this approach is less useful for translocations with a large number of partner genes or those with potentially diverse breakpoints.9,10 FISH is among the most commonly used laboratory methods for the detection of chromosomal rearrangements and offers high sensitivity and the ability to test routine interphase, formalin-fixed, paraffin-embedded (FFPE) tissue sections. However, FISH relies on highly trained individuals to score rearrangements by fluorescent microcopy and is an inherently low-resolution method that may be confounded by complex, multiway rearrangements and may require numerous probes to fully elucidate translocation partners for promiscuous genes, such as KMT2A.5,10 Finally, FISH results are generally difficult to validate by orthogonal methods, outside less sensitive cytogenetic assays.
Two of the most commonly tested translocations in the clinical laboratory are for rearrangements of the anaplastic lymphoma kinase gene, ALK, in non–small cell lung cancer and of the mixed-lineage leukemia gene, KMT2A (formerly known as MLL), in acute leukemia. The EML4-ALK fusion results from an inversion event on chromosome 2p that generally causes an in-frame fusion of EML4 exons 1 to 13 to ALK exons 20 to 29, producing an aberrant fusion gene with constitutive kinase activity, sensitive to crizotinib.11–14 The occurrence of ALK fusions and other common lung cancer gene mutations in KRAS and EGFR are generally considered to be mutually exclusive, arguing that these tumors represent a distinct subset of lung cancers.15 Although not pharmacologically targetable, KMT2A rearrangements are of diagnostic and prognostic significance in acute leukemias, including both acute myeloid leukemia (AML) and acute lymphocytic leukemia (ALL).16,17 KMT2A rearrangements can be readily detected by FISH using break-apart probes; however, elucidation of the translocation partner gene may be difficult because >100 have been identified.10,18
NGS has had a tremendous effect on cancer discovery and is now becoming routine in the clinical molecular oncology laboratory.3,19–21 NGS allows for the cost-effective, simultaneous evaluation of numerous sequence variants as part of focused clinical oncology panels or whole exomes. We and other groups have previously found that a range of DNA variants, including translocations, insertions or deletions, and copy number variants, can be detected from targeted NGS data and that it is possible to identify DNA-level breakpoints with single-nucleotide precision.4,22,23 However, to be useful in the clinical setting, a thorough evaluation of the sensitivity and specificity of structural variation (SV) detection by NGS compared with standard methods is required. Given that numerous potential translocations can be evaluated by NGS simultaneously as part of a larger NGS cancer panel, for little to no additional cost, such methods could provide a significant savings for laboratories that perform multiple single-gene tests and multiple FISH assays on oncology specimens.
We present a comprehensive evaluation of targeted translocation detection by NGS in the clinical laboratory by comparing four publicly available translocation detection tools (including the laboratory derived ClusterFAST) on targeted NGS data from 13 cases with ALK or KMT2A rearrangements (six lung carcinomas and one anaplastic large cell carcinoma with ALK rearrangements; six leukemias with KMT2A rearrangements) and 77 cancers negative for ALK and KMT2A rearrangements by FISH. We found that translocations can be reliably detected at the DNA level by targeted NGS panels and that such methods offer sensitivity and specificity similar to that of routine FISH with the advantage of single-nucleotide breakpoint resolution. Further, we examine approaches to designing capture probes for targeted NGS evaluation, evaluate the minimal coverage levels necessary to detect translocations, and explore methods to reduce false-positive translocation reports.
Materials and Methods
Sample Selection
A total of six FFPE lung adenocarcinomas and one anaplastic large cell lymphoma that had previously tested positive for ALK rearrangements by FISH and six KMT2A rearranged acute leukemias were used as positive controls. The ALK rearranged cases were selected from the Washington University Cytogenomics and Molecular Pathology Laboratory (two cases), ARUP References Laboratories (three cases), and the University of Washington (two cases). ALK rearranged positive controls were selected on the basis of remaining tissue available for sequence analysis; cases were not excluded based on FISH results (ie, the percentage of positive nuclei or the presence of complex rearrangements). The mean tumor cellularity of ALK rearranged cases was 40% (range, 30% to 50%) by morphologic estimate (slides for five of seven cases were available for morphologic review). The KMT2A rearranged acute leukemias were selected from the Washington University Cytogenomics and Molecular Pathology Laboratory based on availability of the remaining specimen in the form of a fixed cell pellet derived from a bone marrow aspirate from which DNA was obtained. The mean tumor cellularity of KMT2A rearranged cases was 90% (range, 75% to 100%) based on FISH or cytogenetics. A total of 77 consecutive control samples negative by FISH for ALK and KMT2A rearrangements were identified from the Washington University Genomics and Pathology Services (GPS) Laboratory. All negative control cases were evaluated by KMT2A and ALK break-apart FISH probes and by the same panel-based NGS as FISH-positive cases in a College of American Pathologists and Clinical Laboratory Improvement Amendments accredited laboratory (GPS). This study was approved by the Human Studies Committee of Washington University School of Medicine (institutional review board approval 201101733).
Evaluation by FISH
Locus-specific FISH for ALK (2p23) and KMT2A (11q23) was performed on FFPE solid tumors or fixed cell pellets derived from hematologic specimens. The ALK and KMT2A loci were assayed using the LSI ALK Dual Color Break Apart Rearrangement Probe and the LSI KMT2A (MLL) Dual Color Break Apart Rearrangement Probe (Abbott Molecular, Abbott Park, IL). Hematologic specimens probed for KMT2A consisted of slides prepared from a cell suspension fixed in 3:1 methanol:acetic acid. Slides were first treated with 2× standard saline citrate (SSC) at 72°C, followed by an ethanol dehydration series (70%, 85%, and 100%) before applying 10 μL of a 1:10 dilution of probe:hybridization buffer. Sealed, coverslipped slides were placed in a Thermobrite (Abbott Molecular) to allow for co-denaturation of specimen and probe at 72°C followed by overnight hybridization at 37°C. Slides were washed in 0.3% NP-40/0.4× SSC and 0.1% NP-40/2× SSC before application of DAPI II counterstain (Abbott Molecular). Slides were examined using an Olympus BX60 fluorescent microscope (Olympus America, Center Valley, PA) equipped with a Chroma 82000 filter set with appropriate filters for SpectrumOrange, SpectrumGreen, and DAPI counterstain. Images were captured using a CoolSnap camera (Nikon USA, Melville, NY) and processed with Cytovision software (Leica Biosystems, Buffalo Grove, IL).
FFPE solid tumor specimens probed for ALK consisted of 5-μm tissue sections mounted on positively charged slides. Specimens were deparaffinized using Citrosolv and dehydrated in 100% ethanol before pretreatment using Vysis Paraffin Pretreatment IV kit components (Abbott Molecular), including pretreatment solution (1N sodium thiocyanate), and protease pretreatment, consisting of Vysis Protease IV (pepsin, 2500 to 4000 U/mg) and Vysis Protease Buffer IV (0.1N hydrochloride). After an ethanol dehydration series (70%, 85%, and 100%), slides were air-dried, and 10 μL of probe mixture was applied. Sealed, coverslipped slides were then placed in a 73°C slide moat (Boekel Scientific, Feasterville, PA) to allow for co-denaturation of specimen and probe, followed by overnight hybridization at 37°C. Posthybridization washing was performed using Vysis Wash Buffer I (0.3% NP-40/0.7× SSC) and Vysis Wash Buffer II (0.1% NP-40/2× SSC) (Abbott Molecular) before counterstaining with DAPI I (Abbott Molecular). Slides were examined using an Olympus BX60 or BX61 fluorescent microscope with appropriate filters for SpectrumOrange, SpectrumGreen, and the DAPI counterstain. The signal patterns were documented using a CoolSnap camera and CytoVision Imaging System (Leica Biosystems).
Design of Capture Panel
Targeted sequencing was performed using the GPS V2 gene set. This panel comprises all exons of 151 genes, as well as the intronic breakpoint regions of ALK and KMT2A: introns 7 to 12 of KMT2A and introns 16 to 21 of ALK. Translocation partners (eg, EML4, MLLT3, and AFF1) were not directly targeted by the capture panel (Supplemental Table S1).
Targeted NGS
DNA was extracted from FFPE sections (ALK rearranged cancers) or bone marrow aspirates (KMT2A rearranged leukemias) and 500 to 1000 ng of DNA prepared for Illumina sequencing as previously described.24 Libraries were then captured using the GPS version 2 gene set. Captured DNA was then indexed using limited cycle PCR and sequenced in multiplex (2 to 15 cases per lane) on a HiSeq 2000 or MiSeq (both from Illumina, Inc., San Diego, CA). Base calls were made using the included Cassava software version 1.7. The resulting FASTQ files were aligned to National Center for Biotechnology Information build 37.2 of the human reference genome (hg19) using Novoalign version 2.08 (Novocraft, Selangor, Malaysia) with default paired-end parameters. Sequence data were cleaned to remove duplicate reads, recalibrate quality scores, and realign around known polymorphisms using the Genome Analysis Toolkit (GATK; version 1.6) (http://www.broadinstitute.org/gatk, last accessed July 1, 2013) and Picard tools (version 1.88) MarkDuplicates (http://sourceforge.net/projects/picard/files, last accessed July 1, 2013) according to the GATK best practices guidelines.25 Quality metrics were calculated using the BEDTools (http://code.google.com/p/bedtools, last accessed July 1, 2013) and Samtools (http://samtools.sourceforge.net, last accessed July 1, 2013) software packages.26,27
Translocation Detection
Translocations were detected from aligned binary sequence alignment files using a battery of publicly available software tools, including BreakDancer version 1.1_2011_02_21, CREST version 1.0.1, Hydra version 0.5.3, and the laboratory-derived ClusterFAST version 0.2 (available on request).28–30 An overall comparison of tools is summarized in Table 1. Translocation software is reviewed elsewhere, but, briefly, translocation detection software can be divided in two general categories: discordant paired-end read methods (including Breakdancer and Hydra) and split-read methods (including CREST).31 Discordant paired-end read methods rely on the presence of read pairs where ends map to different chromosomes or, in the case of intrachromosomal translocations, to the same chromosome but in the wrong orientation or the wrong distance apart (Figure 1A). Breakdancer detects SV by identifying pairs of regions connected by multiple anomalous read pairs and assigns to each breakpoint a score based on a Poisson model. Hydra also detects SV from clusters of discordant read pairs but first performs a sensitive realignment to allow for detection of SVs that occur in repetitive regions of the genome. Split-read methods typically provide increased specificity of SV detection by requiring single-end reads that span the translocation breakpoint and have the added advantage of single-base breakpoint accuracy. CREST identifies breakpoints by assembly and remapping of clusters of soft-clipped reads (Figure 1B). We developed the ClusterFAST tool specifically for the detection of SV from targeted NGS data. It makes use of information from both discordant pairs and split reads. It first identifies clusters of discordant pairs, then splits and remaps to the genome the unmapped or soft-clipped partners of reads mapping in the vicinity of the discordant pair cluster (Figure 1C). If discordant pairs among the remapped short reads corroborate breakpoints identified in the original set of discordant pair clusters, all discordant pairs and partially mapped reads from the region are assembled, using Pindel and Velvet, to form breakpoint-spanning contigs.32,33 These contigs are then mapped to the human genome using BLAT version 35 to determine the exact coordinates of the breakpoint.34
Table 1.
Comparison of Translocation Detection Tools
| Tool | Detection method | Description | Determines breakpoint | Relative speed and memory requirements |
|---|---|---|---|---|
| Breakdancer | Discordant pair | Breakpoint identified by discordant read pairsProvides confidence score based on Poisson model | No | Fast/minimal memory required |
| ClusterFAST | Discordant pairs and split reads | Breakpoint approximated by discordant reads pairs Breakpoints confirmed by split single-end reads to determine exact position Search for structural variation is restricted to prespecified target region | Yes/outputs breakpoint spanning contig | Fast/minimal memory |
| CREST | Split reads | Locates clusters of soft-clipped reads generated during initial read Assembles and remaps soft-clipped reads to determine exact breakpoint | Yes/outputs breakpoint spanning contig | Slow/minimal memory |
| Hydra | Discordant pair | After sensitive realignment to allow additional mismatches and multiply mapped reads, breakpoints identified by discordant read pairs | No, but gives good approximation with high coverage level | Slow, large memory requirement for sensitive realignment |
Figure 1.

A comparison of bioinformatic tools for translocation detection. A: Discordant read pair mapping is the simplest approach for identification of translocations in NGS data and is the main method used by Breakdancer and Hydra. Using this approach, we detected rearrangements when one end of a read pair maps to the chromosome of interest and the other maps to a different chromosome or the same chromosome at a greater than expected distance. Such methods can approximate the position of the breakpoint to within approximately 100 bp but do not generate a contig of the actual breakpoint sequence. B: Soft-clipped reads are generated during sequence alignment when the far end of the read does not match the reference sequence and is then masked from further analysis. With CREST, translocations are identified in areas where increased soft-clipped reads are identified and can be assembled into a contig spanning the translocation breakpoint. Breakpoint sequences are then aligned back to the reference genome to determine the position of the breakpoint. C: ClusterFAST uses a split single end read method to identify translocations that consists of three phases. In the first phase, discordant read pairs are identified similar to Breakdancer and Hydra. In the second phase, putative translocations are further evaluated by finding one end anchored or partially mapped reads (soft-clipped) that map in the vicinity of the translocation. These reads are then split into artificial read pairs and realigned to determine whether they can be mapped. If the reads are mapped and also span the breakpoint, a contig is produced by assembling all local reads in the area. This contig is then mapped back to the reference genome.
Although our targeted region was sequenced to high coverage on average, we observed areas of low coverage in some of the GC-rich intronic regions where translocations are known to occur. Thus, for each of the bioinformatic tools, we chose parameters to maximize sensitivity (exact commands used to run each tool provided in Supplemental Table S2). For Breakdancer and Hydra, we required a minimum of two supporting pairs to report a breakpoint; for ClusterFAST, two supporting pairs and one split read; and for CREST, two split reads. We then filtered the results to identify only structural variants larger than 1 kb, occurring within 50 kb of ALK or KMT2A. For Breakdancer and CREST, we applied read depth filters at 5000 reads to exclude regions of nonspecific alignment. For Hydra, which is designed to be sensitive to SV in repetitive regions, we filtered the results to require at least one supporting read pair be uniquely mapped.
Evaluation of Results
Because the level of resolution of breakpoint detection by NGS and FISH differs by several orders of magnitude, we developed criteria for deciding concordance between the two. All FISH results involved break-apart probes (and therefore did not indicate the partner locus). Thus, we considered NGS results to be concordant with FISH if we detected an interchromosomal translocation or SV size >50 kb within 50 kb of ALK or KMT2A. For the cases with KMT2A rearrangements, we considered the NGS results to be concordant with cytogenetics if we detected a rearrangement in which both members fell within 50 kb of the specified cytogenetic band. Finally, we considered the NGS breakpoint to involve a previously known partner if one side of the breakpoint fell within 50 kb of ALK or KMT2A and the other within 50 kb of any gene on a list of previously reported ALK and KMT2A translocation partners obtained from the online Atlas of Genetics and Cytogenetics (http://atlasgeneticsoncology.org//Genes/ALK.html and http://atlasgeneticsoncology.org//Genes/MLL.html, last accessed March 1, 2013). A list of translocation partners is included in Supplemental Tables S3 and S4. All statistical analyses were performed using the R statistical package (version 2.15.1; R Project for Statistical Computing, http://www.r-project.org).
Validation of Computationally Predicted Breakpoints
Experimental validation was performed, when sufficient DNA remained, for breakpoints that met any of three criteria: i) the breakpoint was detected by at least two bioinformatic tools, ii) the breakpoint involved a known partner gene from the Atlas of Genetics and Cytogenetics, and/or iii) the breakpoint was supported by cytogenetic findings. First, PCR primers spanning both sides of the predicted breakpoint were constructed. PCR was then performed using standard methods on both the case and a negative control to ensure amplicon specificity. PCR products were then direct sequenced by bidirectional Sanger sequencing after treatment with exoSAP (Affymetrix, Santa Clara, CA).
Results
Depth of Coverage between Rearrangement Positive and Negative Cases
We first examined the coverage over the targeted regions in the positive and negative controls. The mean depth of coverage across the full 151-gene panel was 1036× (SD, 339×; range, 182× to 2488×). No significant difference was found in overall coverage depth in positive (mean, 1085×; range, 306 to 1493×) compared with negative controls (mean, 1028×; range, 182 to 2488×; P = 0.62, Student's t-test). Owing to the difficulty in capturing the largely intronic breakpoint regions compared with the overall (exon-rich) capture panel, the coverage over the ALK breakpoint region (mean, 691×; range, 186 to 1351×; P = 2.2 × 10⁻¹⁶, paired t-test) was significantly reduced compared with the overall mean coverage. Similarly, the coverage over the targeted KMT2A rearrangement region was significantly decreased (mean, 583×; range, 221 to 1124×; P < 2.2 × 10⁻¹⁶, paired t-test) compared with the overall mean coverage. However, no significant difference was found in depth of coverage in the targeted ALK rearrangement target region between FISH-positive and -negative controls (positive controls: mean, 767×; range, 218 to 1120; negative controls: mean, 678; range, 186 to 1351; P = 0.31) or in the targeted KMT2A breakpoint region (positive controls: mean, 562×; range, 221 to 844×; negative controls: mean, 587×; range, 228 to 1124×; P = 0.65).
Because the sensitivity of breakpoint detection depends not on the mean coverage but on the coverage local to the breakpoints, we examined the depth of coverage profiles for the ALK and KMT2A rearranged cases across the targeted intronic rearrangement regions in ALK and KMT2A. Figure 2 shows the percentage of bases covered at each of several thresholds ranging from 5× to 1000× for the ALK and KMT2A breakpoint hotspots. For the ALK gene, the median coverage across all cases was >50× for 99.9% of the targeted region but exceeded 200× for only 95.1% of positions. Similarly, in the KMT2A gene, 96.9% of nucleotides were covered to at least 50× based on the median over all cases, whereas only 80% were covered to at least 200×. In the targeted region of KMT2A, the variability in depth of coverage was in part due to variability in GC content; regions of low coverage corresponded to regions of high GC content (Pearson's r = −0.18, P = 3.9 × 10⁻¹³; Figure 3). In contrast, variable GC content had no significant effect on depth of coverage in the targeted region of the ALK gene (r = 4.4 × 10⁻⁴; P = 0.99). We further examined the mappability in the targeted capture regions, using the Centre for Genomic Regulation (Barcelona, Spain) alignability tracks obtained via the University of California, Santa Cruz, genome browser and found a significant negative correlation between depth of coverage and alignability in both the ALK (Pearson's r = 0.28, P < 2.2 × 10⁻¹⁶) and KMT2A target regions (r = 0.56; P < 2.2 × 10⁻¹⁶).35
Figure 2.
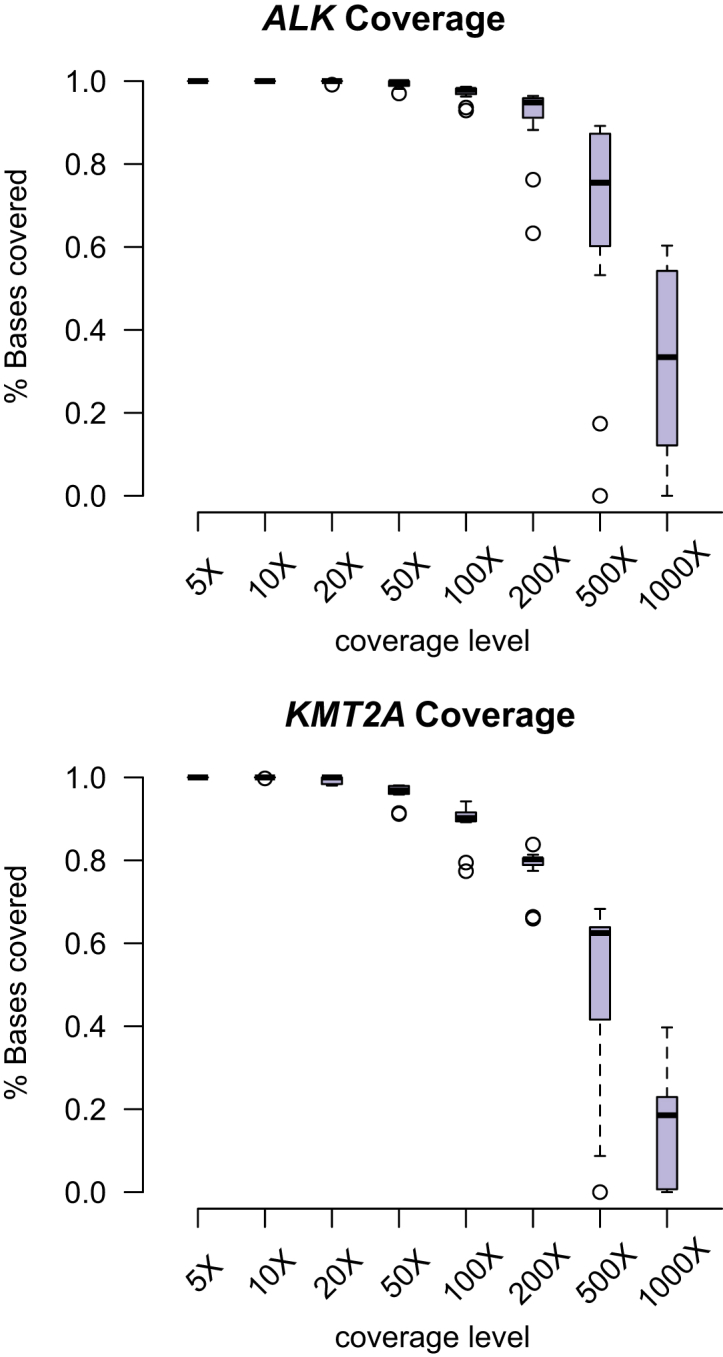
Percentage of bases in the targeted breakpoint hotspots for ALK and KMT2A covered at levels ranging from 5× to 1000× for all positive controls. The box and whisker plots represent the median and upper and lower quartiles for the 13 rearranged cases.
Figure 3.

Coverage profiles within the targeted breakpoint hotspots for ALK and KMT2A. The interquartile range of coverage depth at each position (blue-gray), percentage of GC content (black), and alignability (CRG 50; gray) over the targeted capture region (exons as dark blue boxes) are shown. Breakpoints located in the set of positive controls are indicated with vertical red lines. CRG, Centre for Genomic Regulation.
Evaluation of Bioinformatic Tools for Translocation Detection
We next examined the performance of four bioinformatic tools for translocation detection using 13 cases with known ALK or KMT2A translocations identified by FISH. We tested the BreakDancer, Hydra, CREST, and ClusterFAST software tools, which identify potential structural variants from discordant read pairs and/or split reads (see Materials and Methods for a description of tools). Because translocations were initially detected using a FISH break-apart assay and therefore the precise breakpoints were unknown, we considered NGS results to be concordant with FISH if any interchromosomal or intrachromosomal translocation was detected that was >50 kb and occurred within 50 kb of the ALK or KMT2A gene loci.
By NGS, we detected an ALK rearrangement in seven of seven cases positive for ALK rearrangement by FISH (100% sensitivity; 95% CI, 65%–100%; Wilson score interval). In all seven cases, the rearrangement involved a known partner of ALK: EML4 in the six lung carcinomas and NPM1 in the single anaplastic large cell carcinoma (Table 2). Both Breakdancer and ClusterFAST identified an ALK rearrangement that involved a known partner in all seven cases; these were subsequently validated by PCR and Sanger sequencing. Hydra identified an ALK rearrangement in seven of seven cases but in one case identified a novel partner (DNMT3A) rather than EML4. This finding may indicate a complex, multiway rearrangement; however, we were unable to validate this breakpoint by PCR. The CREST software package gave slightly lower concordance with FISH, identifying an ALK rearrangement in only five of seven cases (71% sensitivity; 95% CI, 36%–92%).
Table 2.
ALK Rearrangements
| Case No. | Diagnosis | Detected any ALK rearrangement |
Detected known ALK partner |
||||||
|---|---|---|---|---|---|---|---|---|---|
| ClusterFAST | Breakdancer | Hydra | CREST | ClusterFAST | Breakdancer | Hydra | CREST | ||
| 1 | Lung adenocarcinoma | Yes | Yes | Yes | No | EML4 | EML4 | EML4 | NA |
| 2 | Lung adenocarcinoma | Yes | Yes | Yes | Yes | EML4 | EML4 | EML4 | EML4 |
| 3 | Lung adenocarcinoma | Yes | Yes | Yes | Yes | EML4 | EML4 | EML4 | EML4 |
| 4 | Lung adenocarcinoma | Yes | Yes | Yes | No | EML4 | EML4 | NO | NA |
| 5 | Lung adenocarcinoma | Yes | Yes | Yes | Yes | EML4 | EML4 | EML4 | EML4 |
| 6 | Lung adenocarcinoma | Yes | Yes | Yes | Yes | EML4 | EML4 | EML4 | EML4 |
| 7 | ALCL | Yes | Yes | Yes | Yes | NPM1 | NPM1 | NPM1 | NPM1 |
ALCL, anaplastic large cell lymphoma.
Sensitivity of KMT2A rearrangements by NGS was similar, with six of six FISH-positive cases identified by NGS (100% sensitivity; 95% CI, 61%–100%) (Table 3). In all six cases, we detected a rearrangement that involved a known partner of KMT2A, including AFF4 (AF4), MLLT6, MLLT1 (ENL), MLLT3 (AF9), and MLLT10 (AF10). Furthermore, the three informatic tools (Breakdancer, Hydra, and ClusterFast) were consistent, reporting the same rearrangements and the same partners in all cases. Again, CREST had slightly lower sensitivity, detecting any KMT2A rearrangement in five of six (83% sensitivity; 95% CI, 44%–99%) KMT2A rearranged cases and detecting a rearrangement that involved a known partner in only three of six (50% sensitivity; 95% CI, 19%–81%) of cases. Among the six detected rearrangements, five were consistent with cytogenetics and were subsequently validated by PCR and Sanger sequencing. In the remaining case, we detected by NGS a t(9;11)(p21;q23) KMT2A/MLLT3(AF9) translocation and a t(9;11)(p24;q23) secondary event, which is inconsistent with the cytogenetic finding of t(1;11)(p22;q23)del(9)(p22). This discrepant result likely represents a multiway translocation in which a small fragment of chromosome 9 was inserted near the chromosome 1 and 11 rearrangement. Although attempts to validate this breakpoint by PCR and Sanger sequencing were unsuccessful because of insufficient remaining DNA, we note that the same translocation was detected by all four tools and was supported by >50 read pairs and that we were able to assemble breakpoint-spanning contigs that mapped uniquely to the reference genome, similar to other PCR-confirmed translocations.
Table 3.
KMT2A Rearrangements
| Case No. | Diagnosis | Cytogenetics | Detected any KMT2A rearrangement |
Detected known KMT2A partner |
||||||
|---|---|---|---|---|---|---|---|---|---|---|
| ClusterFAST | Breakdancer | Hydra | CREST | ClusterFAST | Breakdancer | Hydra | CREST | |||
| 8 | B-ALL | 47,XY,+X,t(4;11)(q21;q23),-6,-8,-17,+1∼5mar[cp18]/46,XY[2] | Yes | Yes | Yes | Yes | AFF4 (AF4) | AFF4 (AF4) | AFF4 (AF4) | AFF4 (AF4) |
| 9 | AML | 45,X,-X,+1, add(1)(p13),del(1)(q21), add(3)(q27),-7, t(11;17)(q23;q21) [15]/46,XX[5] | Yes | Yes | Yes | No | MLLT6 | MLLT6 | MLLT6 | NA |
| 10 | AML | t(11;19)(q23;p13.3) | Yes | Yes | Yes | Yes | MLLT1 (ENL) | MLLT1 (ENL) | MLLT1 (ENL) | MLLT1 (ENL) |
| 11 | AML | 45,X,Y, t(1;11)(p22;q23),del(9)(p22)[20] | Yes | Yes | Yes | Yes | MLLT3 (AF9) | MLLT3 (AF9) | MLLT3 (AF9) | No- PTPRD |
| 12 | AML | 46,XY,add(8)(p21),t(9;11)(q34; q23),add(12)(p13)[19]//46,XX[1] | Yes | Yes | Yes | Yes | MLLT10 (AF10) | MLLT10 (AF10) | MLLT10 (AF10) | No- MED27 |
| 13 | B-ALL | 46∼48,XX,?del(X)(q22),del(1)(q32),t(4;11)(q21;q23),-5,-6,-7,-13,+15,-16,-18,-19,add(19)(p13),-20,-21,+22, +1∼4mar[cp19]/46,XX[1] | Yes | Yes | Yes | Yes | AFF4 (AF4) | AFF4 (AF4) | AFF4 (AF4) | AFF4(AF4) |
AML, acute myeloid leukemia; B-ALL, B-cell acute lymphocytic leukemia; NA, not applicable.
We next examined the full set of NGS-identified breakpoints among the positive control cases. In total, there were 25 breakpoints (a single breakpoint in one case and two breakpoints in each of the remaining 12 cases) that satisfied one of the following: i) the breakpoint was detected by two or more informatic tools, ii) the breakpoint involved a known partner of ALK or KMT2A, or iii) the breakpoint was consistent with cytogenetic findings. To evaluate our ability to detect structural rearrangements at the single-base level rather than at the much lower resolution available by FISH, we attempted PCR validation of each of these breakpoints when sufficient sample remained. Of the 25 breakpoints, 23 were agreed on by the three bioinformatic tools Breakdancer, Hydra, and ClusterFAST. The remaining two breakpoints were each missed by either Breakdancer or Hydra. We considered as likely false-positive results and did not attempt to validate by PCR any breakpoints reported by a single bioinformatic tool and involving an unknown partner of ALK or KMT2A. There were nine such breakpoints among all positive controls, none of which were consistent with cytogenetics: seven reported by Hydra only, one reported by CREST only, and one reported by Breakdancer only (Supplemental Figure S1).
From the seven ALK rearranged cases, we detected a total of 13 breakpoints among all four informatics tools: a single breakpoint in one case and two distinct breakpoints for each of the remaining six cases. Of these 13, we validated 12 by PCR and Sanger sequencing. (Supplemental Table S5). In all ALK rearranged cases, one of the breakpoints was in the correct orientation to produce a fusion gene; the second (if present) represented either a reciprocal event (four of six cases) or part of a complex event that involved another locus (two to six cases). The multiway events included a novel inv(2)(p23) event (involving DNMT3A) and a novel t(2;20)(p23;q13) event. Finally, we examined the sensitivity of the four bioinformatic tools in detecting the full set of breakpoints. ClusterFAST detected all 13 (100%; 95% CI, 77.2%–100%), whereas Breakdancer and Hydra each detected 12 of 13 (92%; 95% CI, 67%–100%) and CREST detected 6 of 13 (46%; 95% CI, 23%–71%). Of particular interest, in one of the lung cancer samples harboring an ALK-EML4 inversion, the breakpoints were found in intron 16 of ALK rather than the canonical intron 19 (Figure 2).
Among the six KMT2A rearranged leukemias, we detected a total of 12 breakpoints: two per case, with the second breakpoint representing either a reciprocal event (four of six cases) or a complex event involving a distant partner (two of six cases) (Supplemental Table S6). The three software tools Breakdancer, Hydra, and ClusterFAST each detected all 12 unique breakpoints (100% sensitivity; 95% CI, 76%–100%), whereas CREST detected 6 of 12 (50%; 95% CI, 25%–75%). Nine of the 12 breakpoints were subsequently validated by PCR and Sanger sequencing. We were unable to validate the remaining three breakpoints: for two breakpoints (from a single case) there was insufficient remaining DNA; for the final breakpoint, we could not design adequate PCR primers because of the lack of sequence complexity. Depth of coverage at the detected breakpoints varied widely, ranging from 98 to 819× (mean, 348.7×; SD, 210.6×) in the ALK rearranged cases and from 15× to 1024× (mean, 400.8×; SD, 319.2×) in the KMT2A rearranged cases (Figure 2). Also highly variable was the number of discordant read pairs supporting each breakpoint, which ranged from 2 to 34 (mean, 11.6; SD, 9.3) for the ALK cases and from 4 to 88 (mean, 41.6; SD, 33.9) for the KMT2A rearranged cases.
Effect of Coverage on Breakpoint Detection
To simulate the effects of low tumor cellularity or reduced coverage on translocation detection sensitivity, we performed random down-sampling and applied the three best-performing translocation detection tools (Breakdancer, Hydra, and ClusterFAST) to each down-sampled data set. Sampling rates ranged from 0.9 to 0.05, corresponding to mean coverage levels over the targeted breakpoint regions of 600× down to 33×, and three random samples were drawn from each case at each sampling rate (Figure 4 and Supplemental Figure S2). At a down-sampling rate of 50%, corresponding to a mean coverage of 332× (SD, 114×; range, 110× to 452×) over the ALK and KMT2A targeted regions, all three tools provided at least 92% sensitivity. At a 20% down-sampling rate (mean coverage, 133×; SD, 46×; range, 46× to 181×), the sensitivity decreased to 54% to 85% (range over three tools and three samples per case). At a down-sampling rate of 10% (mean coverage, 67×; SD, 23×; range, 22× to 90×), the sensitivity ranged from 38% to 62% over all tools. Across the range of sampling rates, the three tools exhibited similar sensitivity.
Figure 4.
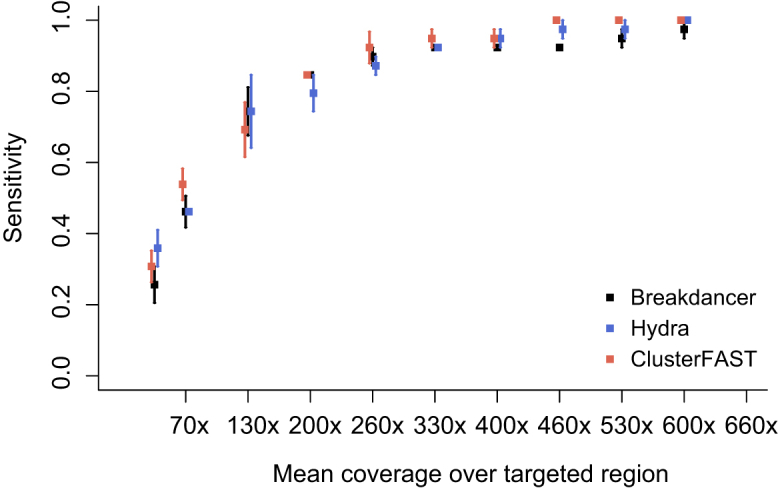
Sensitivity of Breakdancer (black), Hydra (blue), and ClusterFAST (red) to detect the breakpoints in the 13 ALK and KMT2A rearranged cases in randomly down-sampled binary sequence alignment files. Squares indicate the mean (over three random samples) sensitivity per tool, and error bars indicate SE in the mean.
In this collection of sequenced cases, we were able to detect KMT2A rearrangements with higher sensitivity than ALK rearrangements (Supplemental Figure S2). At a down-sampling rate of 0.5, we detected 100% of KMT2A rearrangements compared with 86% to 100% (range for three bioinformatic tools) of ALK rearrangements. At a down-sampling rate of 0.2, we detected 67% to 100% of KMT2A rearrangements and 29% to 71% of ALK rearrangements. Finally, at a down-sampling rate of 0.1, we detected 67% to 83% of KMT2A rearrangements and 14% to 43% of ALK rearrangements. Our reduced sensitivity to detect ALK rearrangements was in part due to lower overall unique coverage in a subset of the ALK rearranged samples, likely secondary to lower DNA input levels; the cases with low-input DNA levels had as few as two read pairs supporting the breakpoint and so were not detectable after down-sampling.
Specificity of Translocation Detection
To evaluate the specificity of NGS for detection of ALK and KMT2A rearrangement, we compared the results of the three highly sensitive bioinformatic tools (Breakdancer, Hydra, and ClusterFAST) on 77 cancers with no evidence by FISH break-apart probes of ALK or KMT2A rearrangement. Neither Breakdancer nor ClusterFAST found any SV >1 kb involving ALK or KMT2A, resulting in 100% specificity (95% CI, 95%–100%). Hydra identified no chromosomal rearrangements involving ALK and four rearrangements involving KMT2A, resulting in a specificity of 94.8% (95% CI, 87%–98%). Of the four translocations identified by Hydra, each was supported by only two discordant pairs, and none involved a known partner of KMT2A.
We further evaluated the specificity of SV detection by NGS compared with conventional methods by examining the set of SV identified on the full 151-gene panel on the set of six KMT2A-rearranged cases on which we had orthogonal data on SV by routine cytogenetics. We examined both the total number of SV >1 kb identified per case and, because cytogenetics has limited resolution to detect small SV, the number of unique interchromosomal translocations. Of the six leukemias with KMT2A rearrangements, Hydra identified the largest number of SVs: 25.5 total events per case (range, 5 to 104), of which 4 (range, 2 to 6) were interchromosomal. Breakdancer identified a mean of 16.2 events per case (range, 6 to 22), of which 3 (range, 2 to 4) were interchromosomal. Finally, ClusterFAST identified only a mean of 2.8 events per case (range, 2 to 6), of which exactly two per case were interchromosomal. Aside from the KMT2A rearrangements described above (exactly two per case), none of the additional interchromosomal rearrangements were detected by cytogenetics and represent likely false-positive results.
Design of Capture Probes Effects Specificity
Two versions of the capture panel were initially used for ALK and KMT2A enrichment. We present data based on the better-performing V2 design; however, it is of some interest to compare this to our initial V1 design. In an effort to maximize sensitivity, we initially targeted the entire KMT2A gene, including introns (chromosome 11: 118307204 to 18397539; 90 kbp), and the telomeric half of ALK, including introns (chromosome 2: 29415639 to 29456662; 41 kbp). In comparison, the V2 design captured a more focused region based on previously reported ALK and KMT2A breakpoints (all ALK exons plus introns 16 to 21, 5.4 kbp, and all KMT2A exons plus introns 7 to 12, 12.6 kbp), resulting in an over sevenfold reduction in capture space. A total of six cases were sequenced on both the V1 and V2 panels, including two ALK rearranged cases and four KMT2A rearranged cases, in addition to 96 ALK and KMT2A FISH rearrangement–negative cases sequenced on the V1 panel. The mean ± SD coverage across the ALK and KMT2A targeted regions was higher in V1 cases (1608 ± 651 for ALK and 1804 ± 707 for KMT2A) than in V2 cases. However, the breadth of coverage was lower, with just 66% and 86% of nucleotide positions in the KMT2A and ALK targeted regions, respectively, having at least 200× coverage. An unintended consequence of larger capture areas was an increase in false-positive translocation reports. Among the 96 negative control cases, we observed one or more false-positive SV involving ALK or KMT2A in 61 cases using Hydra (36% specificity; 95% CI, 28%–46%), in 55 cases using Breakdancer (43% specificity; 95% CI, 33%–53%), and in only five cases using ClusterFAST (95% specificity; 95% CI, 88%–98%).
Improved Specificity by Removal of Duplicate Reads
Although our initial analysis pipeline ignored previously marked duplicate reads (ie, read pairs with the same start positions), we sought to determine whether inclusion of duplicate reads would increase the sensitivity of translocation detection or adversely affect the specificity. By including duplicate reads we found that the false-positive rate for most tools increased without a corresponding increase in sensitivity. Using the six KMT2A rearranged positive controls and including duplicate reads, we identified a mean of 67, 25.5, and 2 interchromosomal rearrangements per case using Breakdancer, Hydra, and ClusterFAST, respectively (Figure 5).
Figure 5.

Effect of duplicate reads. A: The Circos plot shows all translocation events within the 151 targeted genes on the panel in the six FISH-positive KMT2A rearranged cases identified by Breakdancer (red lines) and ClusterFAST (blue) when duplicate reads were not removed before analysis. B: Box and whisker plot of log10 counts of all structural variants, interchromosomal rearrangements, and ALK/KMT2A interchromsomal rearrangements, detected by Breakdancer (red) and ClusterFAST (blue) for all reads (dark red/blue) and with duplicates removed (light red/blue).
Discussion
In this study we used a set of seven FISH-positive ALK rearranged cancers and six FISH/cytogenetics-positive KMT2A rearranged leukemias to determine the sensitivity of ALK and KMT2A rearrangement detection by targeted NGS using DNA derived from formalin-fixed tissue blocks. With an overall mean ALK coverage of 691× and KMT2A coverage of 583× across all positive cases, we detected seven of seven ALK rearranged cases (100%) and six of six KMT2A rearranged leukemias (100%), by targeting only ALK or KMT2A and not common partner genes with most software tools. We compared the performance of three publicly available translocation detection tools (Breakdancer, CREST, Hydra) and one laboratory-derived tool (ClusterFAST) and found similar sensitivities among Breakdancer (13/13), Hydra (13/13), and ClusterFAST (13/13) for detection of an ALK or KMT2A rearrangement using FISH as a gold standard; in our series CREST had an overall lower sensitivity (10/13). The exact reason for the observed decreased sensitivity of CREST is unclear; however, because of the reliance of CREST on information from soft-clips, its performance will depend on the choice of alignment software. For example, we have reported previously that the soft-clips produced by Novoalign tend to be shorter than those produced by Burrows-Wheeler Aligner (http://bio-bwa.sourceforge.net, last accessed May 22, 2014).23 We note that although the sensitivities of Breakdancer, ClusterFAST, and Hydra were similar in this study, only ClusterFAST outputs the exact breakpoint contig sequences, allowing for simplified design of PCR primers for breakpoint verification.
Although targeted detection of translocations has been reported by several groups, the clinically important false-positive rate has not been addressed; we sought to formally evaluate the specificity of translocation detection programs and suggest optimal parameters for their use using a set of 77 clinical cancer specimens without ALK or KMT2A rearrangements by FISH. When duplicate reads were removed, we found that both ClusterFAST and Breakdancer detected no false-positive rearrangements (ALK or KMT2A rearrangements involving any gene), whereas Hydra reported KMT2A rearrangements in four cases. We note that, by design, the Hydra pipeline involves a sensitive realignment, allowing Hydra to detect SV occurring in repetitive regions or near SNVs; the tradeoff, however, is reduced specificity. None of the four false-positive KMT2A rearrangements involved a known translocation partner of KMT2A, and all were supported by just two read pairs. However, among our set of 13 cases, several validated structural variants involved novel translocation partners or were supported by only two read pairs. Thus filtering on either of these criteria would increase specificity but at the cost of reduced sensitivity. Finally, in a set of cases positive by FISH for KMT2A rearrangements and subjected to routine cytogenetics, we determined that Hydra detected a mean of an additional two interchromosomal translocations that were inconsistent with cytogenetics, Breakdancer detected one additional interchromosomal translocation per case, and ClusterFAST detected no interchromosomal translocation inconsistent with the cytogenetic findings. Although it is possible that some of these may be true cryptic rearrangements unresolved by cytogenetics, most are likely false-positive findings. Thus, ClusterFAST provides improved specificity in high-coverage targeted sequence data.
Although the prior analysis discarded duplicate reads, we also considered the effect of including duplicate reads in the analysis as a possible method to increase sensitivity and found that Breakdancer and Hydra each produced an increased number of false-positive rearrangements in the ALK and KMT2A rearranged cases (67 and 25.5 per case, respectively), whereas no difference was seen with ClusterFAST. These data support the idea that duplicate reads should be marked and discarded during translocation analysis to maintain a high positive predictive value. We further compared the effect of capture probe design on translocation detection and found that by increasing the size of the capture region sixfold to include all ALK and KMT2A introns/exons (as opposed to selected introns that have been previously reported to harbor translocations), the false-positive rate increased markedly compared with FISH, resulting in decreased specificities for Breakdancer (43%), Hydra (36%), and ClusterFAST (95%). Most of these false-positive results occurred in repeat regions, suggesting that careful selection of capture regions is required for optimal specificity.
Finally, we performed a random down-sampling experiment to evaluate the sensitivity of breakpoint detection with decreasing coverage levels. Although many factors, including tumor heterogeneity, local coverage, mappability, or presence of SNVs or indels near the breakpoint, will influence sensitivity of detection by NGS, we are able to make some generalizations. First, high levels of unique coverage are needed for detection of gene rearrangements by NGS: even with mean coverage levels of 1000× across the full gene panel and mean coverage levels of >500× across the targeted rearrangement hotspots, uneven coverage in the intronic regions still may result in low levels of coverage in the vicinity of breakpoints and even lower (as few as two in some cases) numbers of read pairs supporting any breakpoint. In our experiment, for KMT2A rearranged cases in which the percentage of rearrangement-positive nuclei by FISH or cytogenetics was 90%, we observed a sensitivity of 100% for random down-sampling rates of at least 50%, corresponding to a mean coverage level over the targeted rearrangement hotspots of 330×. For ALK rearranged cases where the mean tumor cellularity was 40%, a sensitivity of 90% was estimated for random down-sampling rates of 50%. This finding suggests that coverage levels of at least 250× to 500× over the targeted intronic regions should provide adequate detection of gene rearrangements, although higher coverage may be necessary in more heterogeneous samples. On the basis of these data, we estimate that a tumor cellularity of 20% should yield an approximate sensitivity of 90% for rearrangement detection, provided the coverage in the targeted regions averages 600×. Although we did not directly compare the effect of DNA input quantity to rearrangement detection sensitivity, we note that low-input DNA specimens (especially those <100 ng) generate fewer numbers of unique reads and may adversely affect detection sensitivity. Finally, we note that several areas of ALK and KMT2A had low overall coverage that appeared to correlate with increased GC content. Sensitivity may be increased in these areas by better optimization of library preparation conditions or by the addition of spike-in probes targeting areas of low coverage.36
Although in this study perfect rearrangement sensitivity and specificity were obtained by removing duplicate reads and requiring at least two supporting reads, we caution that this performance may not be generalizable to clinical laboratory practice, given the variability in tumor cellularity, input DNA levels, and sequencing coverage obtained in clinical cases. We suggest that laboratories determine their own sensitivity and specificity requirements for a given sample type and adjust calling parameters accordingly. For example, AMLs typically present with a high tumor cellularity, facilitating rearrangement detection. In such cases, laboratories may require a higher number of supporting reads to increase specificity. On the other hand, in cases that typically have lower tumor cellularity, such as lung carcinomas, fewer supporting reads may be required to maximize sensitivity. In the latter case, false-positive rearrangements could be evaluated by FISH or PCR.
NGS-based detection of DNA-level translocations, although technically complex, has numerous advantages over standard translocation detection methods, including immunohistochemistry (IHC), RT-PCR, and FISH. IHC has been proposed as a screening test for ALK rearrangements in lung cancer and shows good concordance with FISH but may be difficult to interpret in cases of borderline expression and, similar to RT-PCR–based ALK rearrangement detection, is not part of current testing guidelines.9,37 Interphase FISH can be run on FFPE tissue, similar to NGS; however, FISH does not provide single-nucleotide resolution of the breakpoint and may be confounded by complex rearrangements. Further, although FISH is inexpensive as a single assay, in many diseases (eg, acute leukemias, myeloma, and myelodysplastic syndrome) FISH panels composed of several probes are performed, often resulting in costs of several thousand dollars. In contrast, NGS-based translocation detection is capable of examining multiple loci for gene rearrangements for minimal cost increase when used in conjunction with gene panel–based NGS testing. In the case of lung cancer and acute leukemias, where multiple genes and exons are clinically tested for rearrangements and mutations, including ALK, EGFR, KRAS, RET, ROS1, and CEBPA, DNMT3A, FLT3, IDH1/2, KMT2A, NPM1, RARA, and RUNX1, the use of such targeted gene panels has the potential to decrease laboratory testing costs. Although translocations may also be detected at the RNA level using NGS-based RNA sequencing, this in general requires intact RNA that may be difficult to obtain on most surgical resection specimens. Further, we note that some translocations, including those that involve the immunoglobulin heavy chain region, result in gene fusions that do not produce chimeric transcripts and would therefore not be detectable by analysis of RNA fusions.
In addition to reducing testing costs by combining translocation detection with gene mutation analysis, further prognostic information may be gleaned from the elucidation of exact rearrangement loci. For example, although response to the ALK inhibitor crizotinib generally results in increased progression-free survival in ALK rearranged lung cancers, there is considerable heterogeneity in response.14 Among six FISH-positive, ALK rearranged lung cancers, one case contained a noncanonical breakpoint, occurring in ALK intron 16 rather than intron 19. This rearrangement, which leaves an intact ALK transmembrane domain, should not result in constitutive dimerization of the ALK kinase domain and consequent increase in its catalytic activity.11,38 Therefore, knowledge of the exact breakpoint sequence may be clinically important in predicting treatment response. In addition, knowledge of the somatically acquired breakpoint sequence may allow for the monitoring of minimal residual disease from plasma-derived cell free DNA using patient- and breakpoint specific quantitative PCR, as has been shown for other rearrangements.39
We report that recurrent ALK and KMT2A rearrangements can be reliably detected at the DNA level from formalin-fixed clinical specimens by targeted, panel-based NGS with similar sensitivity and specificity to FISH. Further, NGS is capable of identifying translocation partners without direct targeting of these partners. Finally, because NGS can detect a full range of cancer-related mutations, including single-nucleotide variants, insertions or deletions, and copy number change, there are considerable efficiencies associated with NGS testing that result in decreased resource expenditure compared with current piecemeal testing. These results indicate that NGS-based diagnostics have the potential to replace FISH as the preferred method for rearrangement detection in oncology testing.
Acknowledgments
We thank Dr. Karen Seibert and the Washington University Genomics and Pathology Services Laboratory for supporting the project and Dr. David Spencer for his critical review of the manuscript.
Footnotes
Supported by the Department of Pathology, Washington University, and by the National Institutes of Health grant K12HL087107-07 (E.J.D.).
Disclosures: None declared.
Supplemental Data
Overlap between breakpoints detected by the four bioinformatic tools tested.
Sensitivity of Breakdancer (black), Hydra (blue), and ClusterFAST (red) to detect the breakpoints in the seven ALK and six KMT2A rearranged cases in randomly down-sampled binary sequence alignment files. Squares indicate the mean (over three random samples) sensitivity per tool, and error bars indicate SE in the mean.
References
- 1.Rowley J.D. Letter: a new consistent chromosomal abnormality in chronic myelogenous leukaemia identified by quinacrine fluorescence and Giemsa staining. Nature. 1973;243:290–293. doi: 10.1038/243290a0. [DOI] [PubMed] [Google Scholar]
- 2.Lejeune J., Gautier M., Turpin R. Study of somatic chromosomes from 9 Mongoloid children [in French] C R Hebd Seances Acad Sci. 1959;248:1721–1722. [PubMed] [Google Scholar]
- 3.Cancer Genome Atlas Research Network Genomic and epigenomic landscapes of adult de novo acute myeloid leukemia. N Engl J Med. 2013;368:2059–2074. doi: 10.1056/NEJMoa1301689. [DOI] [PMC free article] [PubMed] [Google Scholar]
- 4.Duncavage E.J., Abel H.J., Szankasi P., Kelley T.W., Pfeifer J.D. Targeted next generation sequencing of clinically significant gene mutations and translocations in leukemia. Mod Pathol. 2012;25:795–804. doi: 10.1038/modpathol.2012.29. [DOI] [PubMed] [Google Scholar]
- 5.Welch J.S., Westervelt P., Ding L., Larson D.E., Klco J.M., Kulkarni S., Wallis J., Chen K., Payton J.E., Fulton R.S., Veizer J., Schmidt H., Vickery T.L., Heath S., Watson M.A., Tomasson M.H., Link D.C., Graubert T.A., DiPersio J.F., Mardis E.R., Ley T.J., Wilson R.K. Use of whole-genome sequencing to diagnose a cryptic fusion oncogene. JAMA. 2011;305:1577–1584. doi: 10.1001/jama.2011.497. [DOI] [PMC free article] [PubMed] [Google Scholar]
- 6.Lipson D., Capelletti M., Yelensky R., Otto G., Parker A., Jarosz M., Curran J.A., Balasubramanian S., Bloom T., Brennan K.W., Donahue A., Downing S.R., Frampton G.M., Garcia L., Juhn F., Mitchell K.C., White E., White J., Zwirko Z., Peretz T., Nechushtan H., Soussan-Gutman L., Kim J., Sasaki H., Kim H.R., Park S.I., Ercan D., Sheehan C.E., Ross J.S., Cronin M.T., Janne P.A., Stephens P.J. Identification of new Alk and Ret gene fusions from colorectal and lung cancer biopsies. Nat Med. 2012;18:382–384. doi: 10.1038/nm.2673. [DOI] [PMC free article] [PubMed] [Google Scholar]
- 7.Cools J., DeAngelo D.J., Gotlib J., Stover E.H., Legare R.D., Cortes J., Kutok J., Clark J., Galinsky I., Griffin J.D., Cross N.C., Tefferi A., Malone J., Alam R., Schrier S.L., Schmid J., Rose M., Vandenberghe P., Verhoef G., Boogaerts M., Wlodarska I., Kantarjian H., Marynen P., Coutre S.E., Stone R., Gilliland D.G. A tyrosine kinase created by fusion of the Pdgfra and Fip1l1 genes as a therapeutic target of imatinib in idiopathic hypereosinophilic syndrome. N Engl J Med. 2003;348:1201–1214. doi: 10.1056/NEJMoa025217. [DOI] [PubMed] [Google Scholar]
- 8.de Jesus Marques-Salles T., Liehr T., Mkrtchyan H., Raimondi S.C., Tavares de Souza M., de Figueiredo A.F., Rouxinol S., Jordy Macedo F.C., Abdelhay E., Santos N., Macedo Silva M.L. A new chromosomal three-way rearrangement involving Mll masked by a T(9;19)(P11;P13) in an infant with acute myeloid leukemia. Cancer Genet Cytogenet. 2009;189:59–62. doi: 10.1016/j.cancergencyto.2008.10.009. [DOI] [PubMed] [Google Scholar]
- 9.Lindeman N.I., Cagle P.T., Beasley M.B., Chitale D.A., Dacic S., Giaccone G., Jenkins R.B., Kwiatkowski D.J., Saldivar J.S., Squire J., Thunnissen E., Ladanyi M. Molecular testing guideline for selection of lung cancer patients for Egfr and Alk tyrosine kinase inhibitors: guideline from the College of American Pathologists, International Association for the Study of Lung Cancer, and Association for Molecular Pathology. J Mol Diagn. 2013;15:415–453. doi: 10.1016/j.jmoldx.2013.03.001. [DOI] [PubMed] [Google Scholar]
- 10.Meyer C., Hofmann J., Burmeister T., Groger D., Park T.S., Emerenciano M. The Mll recombinome of acute leukemias in 2013. Leukemia. 2013;27:2165–2176. doi: 10.1038/leu.2013.135. [DOI] [PMC free article] [PubMed] [Google Scholar]
- 11.Soda M., Choi Y.L., Enomoto M., Takada S., Yamashita Y., Ishikawa S., Fujiwara S., Watanabe H., Kurashina K., Hatanaka H., Bando M., Ohno S., Ishikawa Y., Aburatani H., Niki T., Sohara Y., Sugiyama Y., Mano H. Identification of the transforming Eml4-Alk fusion gene in non-small-cell lung cancer. Nature. 2007;448:561–566. doi: 10.1038/nature05945. [DOI] [PubMed] [Google Scholar]
- 12.Koivunen J.P., Mermel C., Zejnullahu K., Murphy C., Lifshits E., Holmes A.J., Choi H.G., Kim J., Chiang D., Thomas R., Lee J., Richards W.G., Sugarbaker D.J., Ducko C., Lindeman N., Marcoux J.P., Engelman J.A., Gray N.S., Lee C., Meyerson M., Janne P.A. Eml4-Alk fusion gene and efficacy of an Alk kinase inhibitor in lung cancer. Clin Cancer Res. 2008;14:4275–4283. doi: 10.1158/1078-0432.CCR-08-0168. [DOI] [PMC free article] [PubMed] [Google Scholar]
- 13.McDermott U., Iafrate A.J., Gray N.S., Shioda T., Classon M., Maheswaran S., Zhou W., Choi H.G., Smith S.L., Dowell L., Ulkus L.E., Kuhlmann G., Greninger P., Christensen J.G., Haber D.A., Settleman J. Genomic alterations of anaplastic lymphoma kinase may sensitize tumors to anaplastic lymphoma kinase inhibitors. Cancer Res. 2008;68:3389–3395. doi: 10.1158/0008-5472.CAN-07-6186. [DOI] [PubMed] [Google Scholar]
- 14.Shaw A.T., Kim D.W., Nakagawa K., Seto T., Crino L., Ahn M.J., De Pas T., Besse B., Solomon B.J., Blackhall F., Wu Y.L., Thomas M., O'Byrne K.J., Moro-Sibilot D., Camidge D.R., Mok T., Hirsh V., Riely G.J., Iyer S., Tassell V., Polli A., Wilner K.D., Janne P.A. Crizotinib versus chemotherapy in advanced Alk-positive lung cancer. N Engl J Med. 2013;368:2385–2394. doi: 10.1056/NEJMoa1214886. [DOI] [PubMed] [Google Scholar]
- 15.Gainor J.F., Varghese A.M., Ou S.H., Kabraji S., Awad M.M., Katayama R., Pawlak A., Mino-Kenudson M., Yeap B.Y., Riely G.J., Iafrate A.J., Arcila M.E., Ladanyi M., Engelman J.A., Dias-Santagata D., Shaw A.T. Alk rearrangements are mutually exclusive with mutations in Egfr or Kras: an analysis of 1,683 patients with non-small cell lung cancer. Clin Cancer Res. 2013;19:4273–4281. doi: 10.1158/1078-0432.CCR-13-0318. [DOI] [PMC free article] [PubMed] [Google Scholar]
- 16.Kaneko Y., Rowley J.D., Maurer H.S., Variakojis D., Moohr J.W. Chromosome pattern in childhood acute nonlymphocytic leukemia (ANLL) Blood. 1982;60:389–399. [PubMed] [Google Scholar]
- 17.Kaneko Y., Maseki N., Takasaki N., Sakurai M., Hayashi Y., Nakazawa S., Mori T., Sakurai M., Takeda T., Shikano T. Clinical and hematologic characteristics in acute leukemia with 11q23 translocations. Blood. 1986;67:484–491. [PubMed] [Google Scholar]
- 18.Burmeister T., Meyer C., Schwartz S., Hofmann J., Molkentin M., Kowarz E., Schneider B., Raff T., Reinhardt R., Gokbuget N., Hoelzer D., Thiel E., Marschalek R. The Mll recombinome of adult Cd10-negative B-cell precursor acute lymphoblastic leukemia: results from the GMALL Study Group. Blood. 2009;113:4011–4015. doi: 10.1182/blood-2008-10-183483. [DOI] [PubMed] [Google Scholar]
- 19.Brennan C.W., Verhaak R.G., McKenna A., Campos B., Noushmehr H., Salama S.R. The somatic genomic landscape of glioblastoma. Cell. 2013;155:462–477. doi: 10.1016/j.cell.2013.09.034. [DOI] [PMC free article] [PubMed] [Google Scholar]
- 20.Govindan R., Ding L., Griffith M., Subramanian J., Dees N.D., Kanchi K.L., Maher C.A., Fulton R., Fulton L., Wallis J., Chen K., Walker J., McDonald S., Bose R., Ornitz D., Xiong D., You M., Dooling D.J., Watson M., Mardis E.R., Wilson R.K. Genomic landscape of non-small cell lung cancer in smokers and never-smokers. Cell. 2012;150:1121–1134. doi: 10.1016/j.cell.2012.08.024. [DOI] [PMC free article] [PubMed] [Google Scholar]
- 21.Pritchard C.C., Smith C., Salipante S.J., Lee M.K., Thornton A.M., Nord A.S., Gulden C., Kupfer S.S., Swisher E.M., Bennett R.L., Novetsky A.P., Jarvik G.P., Olopade O.I., Goodfellow P.J., King M.C., Tait J.F., Walsh T. Coloseq provides comprehensive lynch and polyposis syndrome mutational analysis using massively parallel sequencing. J Mol Diagn. 2012;14:357–366. doi: 10.1016/j.jmoldx.2012.03.002. [DOI] [PMC free article] [PubMed] [Google Scholar]
- 22.Li J., Lupat R., Amarasinghe K.C., Thompson E.R., Doyle M.A., Ryland G.L., Tothill R.W., Halgamuge S.K., Campbell I.G., Gorringe K.L. Contra: copy number analysis for targeted resequencing. Bioinformatics. 2012;28:1307–1313. doi: 10.1093/bioinformatics/bts146. [DOI] [PMC free article] [PubMed] [Google Scholar]
- 23.Spencer D.H., Abel H.J., Lockwood C.M., Payton J.E., Szankasi P., Kelley T.W., Kulkarni S., Pfeifer J.D., Duncavage E.J. Detection of Flt3 internal tandem duplication in targeted, short-read-length, next-generation sequencing data. J Mol Diagn. 2012;15:81–93. doi: 10.1016/j.jmoldx.2012.08.001. [DOI] [PubMed] [Google Scholar]
- 24.Spencer D.H., Sehn J.K., Abel H.J., Watson M.A., Pfeifer J.D., Duncavage E.J. Comparison of clinical targeted next-generation sequence data from formalin-fixed and fresh-frozen tissue specimens. J Mol Diagn. 2013;15:623–633. doi: 10.1016/j.jmoldx.2013.05.004. [DOI] [PMC free article] [PubMed] [Google Scholar]
- 25.DePristo M.A., Banks E., Poplin R., Garimella K.V., Maguire J.R., Hartl C., Philippakis A.A., del Angel G., Rivas M.A., Hanna M., McKenna A., Fennell T.J., Kernytsky A.M., Sivachenko A.Y., Cibulskis K., Gabriel S.B., Altshuler D., Daly M.J. A framework for variation discovery and genotyping using next-generation DNA sequencing data. Nat Genet. 2011;43:491–498. doi: 10.1038/ng.806. [DOI] [PMC free article] [PubMed] [Google Scholar]
- 26.Quinlan A.R., Hall I.M. Bedtools: a flexible suite of utilities for comparing genomic features. Bioinformatics. 2010;26:841–842. doi: 10.1093/bioinformatics/btq033. [DOI] [PMC free article] [PubMed] [Google Scholar]
- 27.Li H., Handsaker B., Wysoker A., Fennell T., Ruan J., Homer N., Marth G., Abecasis G., Durbin R. The sequence alignment/map format and samtools. Bioinformatics. 2009;25:2078–2079. doi: 10.1093/bioinformatics/btp352. [DOI] [PMC free article] [PubMed] [Google Scholar]
- 28.Wang J., Mullighan C.G., Easton J., Roberts S., Heatley S.L., Ma J., Rusch M.C., Chen K., Harris C.C., Ding L., Holmfeldt L., Payne-Turner D., Fan X., Wei L., Zhao D., Obenauer J.C., Naeve C., Mardis E.R., Wilson R.K., Downing J.R., Zhang J. Crest maps somatic structural variation in cancer genomes with base-pair resolution. Nat Methods. 2011;8:652–654. doi: 10.1038/nmeth.1628. [DOI] [PMC free article] [PubMed] [Google Scholar]
- 29.Quinlan A.R., Clark R.A., Sokolova S., Leibowitz M.L., Zhang Y., Hurles M.E., Mell J.C., Hall I.M. Genome-wide mapping and assembly of structural variant breakpoints in the mouse genome. Genome Res. 2010;20:623–635. doi: 10.1101/gr.102970.109. [DOI] [PMC free article] [PubMed] [Google Scholar]
- 30.Chen K., Wallis J.W., McLellan M.D., Larson D.E., Kalicki J.M., Pohl C.S., McGrath S.D., Wendl M.C., Zhang Q., Locke D.P., Shi X., Fulton R.S., Ley T.J., Wilson R.K., Ding L., Mardis E.R. Breakdancer: an algorithm for high-resolution mapping of genomic structural variation. Nat Methods. 2009;6:677–681. doi: 10.1038/nmeth.1363. [DOI] [PMC free article] [PubMed] [Google Scholar]
- 31.Abel H.J., Duncavage E.J. Detection of structural DNA Variation from Next Generation Sequencing Data: a Review of Informatic Approaches. Cancer Genet. 2013;206:432–440. doi: 10.1016/j.cancergen.2013.11.002. [DOI] [PMC free article] [PubMed] [Google Scholar]
- 32.Zerbino D.R. Using the velvet de novo assembler for short-read sequencing technologies. Curr Protoc Bioinformatics. 2010 doi: 10.1002/0471250953.bi1105s31. ch 11:unit 11 5. [DOI] [PMC free article] [PubMed] [Google Scholar]
- 33.Ye K., Schulz M.H., Long Q., Apweiler R., Ning Z. Pindel: a pattern growth approach to detect break points of large deletions and medium sized insertions from paired-end short reads. Bioinformatics. 2009;25:2865–2871. doi: 10.1093/bioinformatics/btp394. [DOI] [PMC free article] [PubMed] [Google Scholar]
- 34.Kent W.J. Blat–the blast-like alignment tool. Genome Res. 2002;12:656–664. doi: 10.1101/gr.229202. [DOI] [PMC free article] [PubMed] [Google Scholar]
- 35.Derrien T., Estelle J., Marco Sola S., Knowles D.G., Raineri E., Guigo R., Ribeca P. Fast computation and applications of genome mappability. PLoS One. 2012;7:e30377. doi: 10.1371/journal.pone.0030377. [DOI] [PMC free article] [PubMed] [Google Scholar]
- 36.Aird D., Ross M.G., Chen W.S., Danielsson M., Fennell T., Russ C., Jaffe D.B., Nusbaum C., Gnirke A. Analyzing and minimizing Pcr amplification bias in illumina sequencing libraries. Genome Biol. 2011;12:R18. doi: 10.1186/gb-2011-12-2-r18. [DOI] [PMC free article] [PubMed] [Google Scholar]
- 37.Selinger C.I., Rogers T.M., Russell P.A., O'Toole S., Yip P., Wright G.M., Wainer Z., Horvath L.G., Boyer M., McCaughan B., Kohonen-Corish M.R., Fox S., Cooper W.A., Solomon B. Testing for ALK rearrangement in lung adenocarcinoma: a multicenter comparison of immunohistochemistry and fluorescent in situ hybridization. Mod Pathol. 2013;26:1545–1553. doi: 10.1038/modpathol.2013.87. [DOI] [PubMed] [Google Scholar]
- 38.Choi Y.L., Takeuchi K., Soda M., Inamura K., Togashi Y., Hatano S., Enomoto M., Hamada T., Haruta H., Watanabe H., Kurashina K., Hatanaka H., Ueno T., Takada S., Yamashita Y., Sugiyama Y., Ishikawa Y., Mano H. Identification of novel isoforms of the Eml4-Alk transforming gene in non-small cell lung cancer. Cancer Res. 2008;68:4971–4976. doi: 10.1158/0008-5472.CAN-07-6158. [DOI] [PubMed] [Google Scholar]
- 39.Leary R.J., Sausen M., Kinde I., Papadopoulos N., Carpten J.D., Craig D., O'Shaughnessy J., Kinzler K.W., Parmigiani G., Vogelstein B., Diaz L.A., Jr., Velculescu V.E. Detection of chromosomal alterations in the circulation of cancer patients with whole-genome sequencing. Sci Transl Med. 2012;4:162ra54. doi: 10.1126/scitranslmed.3004742. [DOI] [PMC free article] [PubMed] [Google Scholar]
Associated Data
This section collects any data citations, data availability statements, or supplementary materials included in this article.
Supplementary Materials
Overlap between breakpoints detected by the four bioinformatic tools tested.
Sensitivity of Breakdancer (black), Hydra (blue), and ClusterFAST (red) to detect the breakpoints in the seven ALK and six KMT2A rearranged cases in randomly down-sampled binary sequence alignment files. Squares indicate the mean (over three random samples) sensitivity per tool, and error bars indicate SE in the mean.