Abstract
Flow cytometry, DNA fragmentation, ion ratiomateric analysis and NMR peaks characterized drug chemosensitivity of antineoplastic drugs. Hypotheses were: 1. The chemosensitive effect of different cancer cell lines is characteristic; 2. DNA fragmentation, ion ratiometric analysis suggest apoptosis status of tumor cells.
Methods
PC-3 cell lines were compared with DU-145, LNCaP cell lines in culture for the [Na]i and [Ca]i ion sensing dyes, cell death, NMR peaks and apoptosis staining for chemotherapeutic action of different drugs.
Results
DNA fragmentation, ratiometric ions and fluorescence endlabelling plots were characteristic for cell lines and drug response. 31P-23Na NMR spectra showed characteristic high phospho-choline and sodium peaks.
Conclusion
Flow cytometry, DNA fragmentation, ion ratiometric methods and NMR peaks indicated apoptosis and offered in vivo drug monitoring method.
Keywords: MRI, apoptosis, prostate tumor, flow cytometry, ion ratiometric assay, DNA fragmentation
Introduction
Recently, drug chemosensitivity assays were developed to evaluate anti-neoplastic drugs using cell cultures. Incorporation of cell culture studies offers good possibility as gold standard to assess the drugs due to the controlled conditions and easy procedures. Tumor cell proliferation, apoptosis, malignancy are frequently reported due to ionic and metabolite changes in tumor culture studies. These cancer cell culture techniques demonstrated apoptosis by DNA fragmentation, NMR peaks and fluorescent flow cytometry [1-5]. In the present paper we demonstrate the association of apoptosis cell death using DNA fragmentation analysis, ion ratiometric assay and NMR spectroscopy of tumor cells.
Materials and methods
PC3 human prostate cancer cells were propagated in nude mice as experimental model of prostate tumor. Cells from the dissociated tumor were put into culture. These cells were grown overnight and then subjected to radiotracer uptake, drug sensitivity, MTT analysis, flow cytometry, ratiometric ion assay and DNA fragmentation experiments as described elsewhere [5].
Cell survival and DNA fragmentation
Three human prostate cell lines were used in culture studies (PC-3, DU-145 and LNCaP) and tumor propagation in mice. The experiments were designed for: (a) Drugs doses – taxotere: 1, 10, 20, 50, 100 nM; 9-amino-camptothecin: 10, 20, 50, 100, 200 nM; and, VP- 16 etoposide – 1, 2, 5, 10, 20, 50, 100 μg/ml; (b) Cell lines – PC-3, DU-145, LNCaP; (c) Exposure times – 4, 8, 12 hrs; 1 and 2 days; (d) Analysis by using control wells for all drug exposure times and cell lines.
Cells were obtained from American Type Culture Collection, Rockville, Maryland, grown in RPMI 1640 media (Sigma) supplemented with 5% Fetal Bovine Serum (Sigma), and passaged every 3 days. After washing × 3 with PBS, cells were trypsinized (0.1% Trypsin and 1 mM EDTA in PBS), mixed 1:1 with serum containing medium, resuspended in PBS, resuspended in iced cold methanol free formaldehyde (1% in PBS) for 15 min, resuspended in 70% ethanol and stored at -20°C. Fixed cells were exposed to endlabelling cocktail overnight, resuspensed in "rinse buffer", exposed to fluorescent antibody and finally treatment with propidium iodide and RNAase for DNA fragmentation analysis. Flow cytometry was performed on a Becton/Dickenson FACStar II at the Columbia University Cancer Center. Individual fluorescence intensity values for 10,000 cells were obtained or each sample [5].
Relative sensitivity of PC3 and DU145 cell lines to VP-16 etoposide and taxotere
Relative sensitivity of PC3 and DU145 cell lines to VP-16 etoposide (10 μg/ml) and taxotere (20 nM) were examined with flow cytometry.
Fluorescent approach to the measurement of intracellular ions
Measurement of Ca++
Human prostate cancer cell line PC3 was cultured in black, low autofluorescence 96 well plates. 10 nMol/L taxotere was added to cell wells (six wells per time point) before 2, 4 and 6 hours of loading of a Ca++ sensitive fluorescent dye (Fura II/AM). The IC50 value at 24 hrs, as determined by MTT assay, was 10 nM taxotere. The ratio of fluorescent intensity for the two-excitation wavelengths (345 and 390 nm) was plotted versus duration of drug exposure. Increases in ratio imply increases in [Ca]i. The following sequence of interventions in 96 well plate were run: i. 96 wells were read at both wavelengths for dye exposed cells, unexposed cells, cell free wells and dye free/cell free wells; ii. ionophores or thapsigargin were added to dye exposed cell wells in presence of Mn++ to quench dye and obtain well by well zero values.
Measurement of Ca++ by sodium green Na+ sensing fluorescent dye
The Na+ sensing fluorescent dye was employed which PC3 human prostate cancer lines used and readily took up. Data was displayed as fluorescence intensity (vertical axis) versus forward scatter (horizontal axis) described elsewhere [5].
In vitro Na-NMR spectroscopy studies on superfused human PCa cells
PC-3 cells were embedded in agarose beads, which were perfused in an NMR tube. 31P and 23Na TQ spectra of perfused PC-3 cell loaded agarose beads were first acquired at baseline. Subsequently, 100-nM/L taxotere was added and 31P-23Na TQ spectra were again acquired at various times [5].
Results
Prostate tumors were 1–2.5 mm rounded shaped propagated with both PC3 and DU145 cell lines (see Figure 1).
Figure 1.
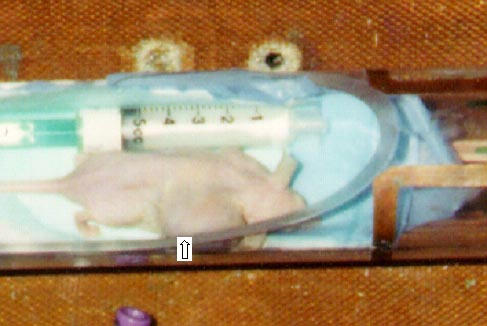
A prostate tumor shown in PC3 induced mouse (arrow at bottom).
Cell survival and DNA fragmentation studies
A number of antineoplastic drugs were screened against human PCa cell lines i.e. DU-145, LNCaP and PC-3 using microculture tertrazolium technique (MTT). The effect of etoposide on cell survival at 24 hrs is shown as function of dose (see Table 1 and Figure 2). DU145 had the most pronounced response and LNCap the least, consistent with later endlabelling results using flow cytometry. All drug responses were significant versus control (except 1 μg/ml VP16 on LNCap) and all 20 μg/ml dose responses were significant versus 10 μg/ml (p < 0.05) (see Figure 2, left panel on top).
Table 1.
Different cancer cell lines are represented for their mean % survival in presence of different drugs as shown in Figure 2A.
| Drug VP 16 (Dose) | Mean % survival with VP 16(n = 5) | Drug with PC3 cells | Endlabelling Fluorescence (A.U.) | ||
| LNCaP | PC3 | DU145 | Control Taxotere | 2 | |
| 2 μg/ml | 85 | 96 | 75 | 10 nM | 10 |
| 5 μg/ml | 80 | 84 | 70 | 50 nM | 10 |
| 10 μg/ml | 85 | 82 | 65 | Campothecin | |
| 20 μg/ml | 80 | 72 | 55 | 200 nM | 135 |
Notice the most pronounced response of DU 145 followed by PC3 and LNCaP cell lines against VP 16 (20 μg/ml). Dynamic range of the mean endlabelling fluorescence intensity was normalized to arbitrary control value of 1.0 non-linear scale (n = 5). The combination of taxotere on PC3 was apparently saturated at 10 nM for 24 hours at about 10% of the campothecin dose, a near maximal response.
Figure 2.
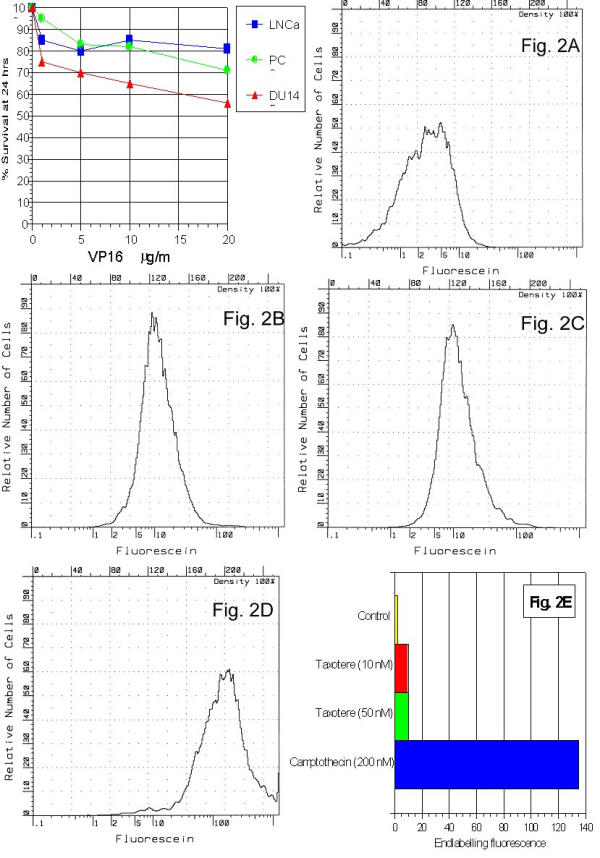
Cell survival experiments represent relative survival of PC3, LNCaP, and DU145 cell lines after 24 hr exposure to VP16 etoposide at various concentrations (2A). One dimensional histograms show relative number of cells (vertical axis) for fluorescent intensities over a 4 log unit range (bottom horizontal axis) using a 256 channel A/D converter (top horizontal axis). Sample histograms are shown for the following conditions: control PC3 cells (2B), 24 hr treatment with 10 nM taxotere (2C), same with 50 nM taxotere (2D). At bottom, bar graph (2E) shows the dynamic range of the mean fluorescence intensity normalized to an arbitrary control value of 1.0 on a linear scale. Cell counts appeared at values over the entire 4 log unit range.
One dimensional histograms show relative number of cells (vertical axis) for fluorescent intensities over a 4 log unit range (bottom horizontal axis) using a 256 channel A/D converter (top horizontal axis). Standard errors for most samples were less than 1% of mean. Sample histograms are shown in Figure 2 for the following conditions: baseline (2A), control PC3 cells (2B), 24 hr treatment with 10 nM taxotere (2C), same with 50 nM taxotere (2D). The method had a dynamic range of approximately × 1000.
To assay DNA fragmentation (a downstream response to apoptosis), a terminal deoxynucleotidyl transferase endlabelling fluorescence approach was used. Fluorescent moieties were attached to all DNA fragment ends. Camptothecin (200 nM) treated PC-3 cells examined by APO-BRDU showed dynamic range of fluorescence intensities of up to 200 fold comparing control cell-to-cell with advanced DNA fragmentation. The combination of taxotere on PC3 was apparently saturated at 10 nM for 24 hrs at about 10% of the camptothecin value, a near maximal response (Figure 2E).
Relative sensitivity of PC3 and DU145 cell lines to VP-16 etoposide and taxotere
Relative sensitivity of PC3 and DU145 cell lines to VP-16 etoposide (10 μg/ml) and taxotere (20 nM) were examined with flow cytometry using a new fluorescent endlabelling kit. The VP-16 response was greater than taxotere for both cells lines and the DU 145 response was greater than PC3 for both drugs.
Comparison of drugs on DNA fragmentation
Flow cytometry method offered quantitative comparisons of DNA fragmentation on a cell-to-cell basis for relative drug sensitivity profiles of the 2 cell lines (see Figure 3A and Table 2). After 24 hrs, endlabelling fluorescence increase was: 32% in DU 145 and 8% in PC3 by campothecin; 54% in DU145 by VP16. Cisplatin induced a 4% (NS) decrease (n = 2) as shown in Figure 3A.
Figure 3.
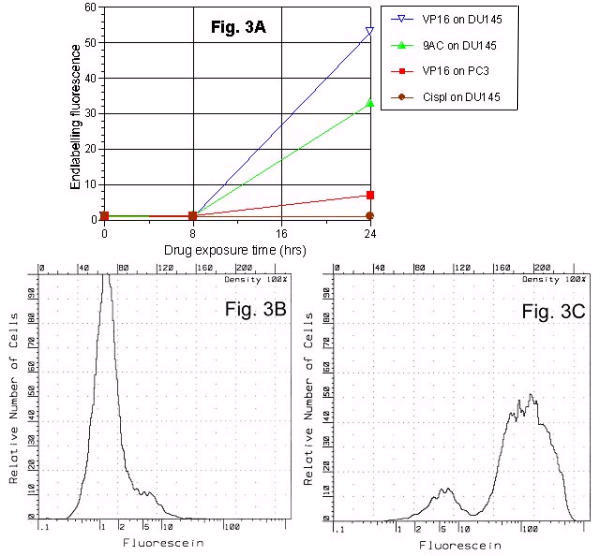
Dependence of DNA fragmentation on drugs and cell lines. Using the APO-BRDU endlabelling technique evaluated various antineoplastic agents (VP16 etoposide, 9-amino-camptothecin, cisplatin) at various times (8 and 24 hrs). Graph displays the fluorescent intensity (per 10000 cells) during different experimental conditions (3A) and illustrate that, at standard tissue culture doses: i) there was a minimal response at 8 hrs; ii) a range of responses for a given cell lines (DU145 response was highest with VP16, and not detectable with cisplatin); and, iii) for same drug and dose (VP16 at 10 μg/ml) DU145 response was greater than for PC3. Sample histograms showed fluorescence intensity distribution for untreated control cells (3B) and after a 24 hours VP16 treatment (3C).
Table 2.
Dependence of DNA fragmentation is shown on drugs and cell lines using APO-BRDU endlabelling technique for various antinucleoplastic agents (VP16 etoposide, 9-amino-campothecin, cisplatin) at various times (8 and 24 hours).
| Drug exposure with cell lines | APO-BRDU Endlabelling Fluorescence (n = 5) | |||
| Exposure(in hours) | 0 | 8 | 24 | 44 |
| Taxotere + DU145 | - | 1.5 | 3 | 1.8 |
| Taxotere + PC3 | - | 1.5 | 2 | 3.5 |
| VP 16 + DU145 | - | 3.8 | 9 | 4 |
| VP 16 + PC3 | - | 2 | 4 | 11 |
| Campothecin + DU145 | - | 0.3 | 34 | - |
| Cisplatin + DU145 | - | 0.3 | 54 | - |
Mean fluorescent intensity (per 10 × 103 cells) values are shown at different experimental conditions (see Figure 3A). It illustrates fluorescent intensities at standard tissue culture doses: i. minimal response at 8 hours; ii. a range of responses for a given cell lines (highest DU145 response with VP16 while negligible with cisplatin; and iii. for same drug and dose (VP16 at 10 μg/ml). Notice the DU145 pronounced response greater than PC3 response.
Dependence of DNA fragmentation time curve on cell lines
Sample histograms show distributions of endlabelling fluorescence intensity for untreated control cells (Figure 3B) and a 0–24 hr VP-16 treatment (Figure 3C). The small population (Figure 3C) at 5 units represents advanced apoptosis where net DNA loss outweighs the effect of DNA fragmentation in producing labeled ends. At 24–44 hours, mean endlabelling fluorescence intensity reflected the effect of antineoplastic treatment iinterval. VP16 etoposide and taxotere drugs showed continued PC3 cell DNA fragmentation to develop 24 hour sample point where DU145 response peaks later subsided (Figure 4A). The VP16 response was greater than that of taxotere for both cells lines, and the DU145 response was greater than PC3 for both drugs. The histogram patterns indicated deterioration of DNA fragments and shift of peak to the right (Figures 4B and 4C).
Figure 4.
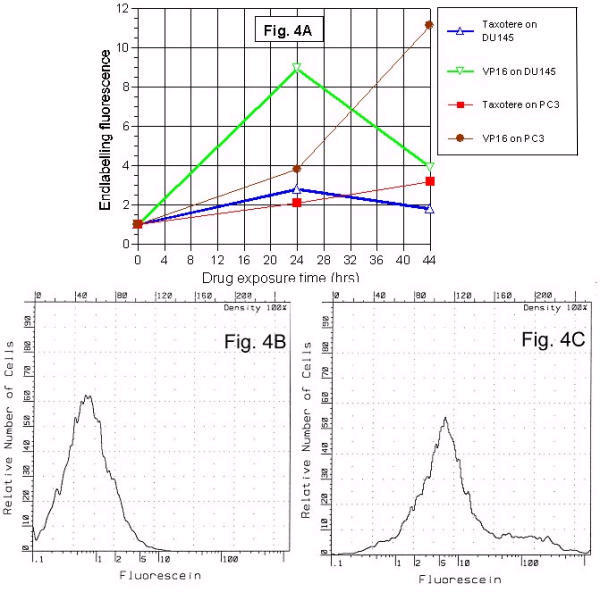
Dependence of DNA fragmentation time curve on cell lines. The VP-16 response was greater than taxotere for both cells lines, and the DU 145 response was greater than PC3 for both drugs. Whereas the DU 145 response peaks by 24 hrs and then subsides, the PC 3 response continues to increase for 44 hrs fluorescence intensity values for 1,000 cells were obtained for each sample. Mean endlabelling fluorescence intensity plots illustrate the effect of lengthening the antineoplastic treatment interval from 24 to 44 hrs (4A). Sample histograms show the fluorescence intensity distribution for untreated control cells (4B) and a 44 hours VP16 treatment of PC3 cells (4C). Note that in addition to shifting the main peak of the distribution toward higher intensity, a second "shoulder" population appeared between 50 and 500 units. The second shoulder population represents deterioration to smaller DNA fragments.
Fluorescent measurements of free [Ca++]i
Ionomycin, Taxotere (10 nM) and Taxotere with Thapsigargin exhibited different time-dependent response by FURA II/AM ratio. Ionophores or thapsigargin increased fluorescence ratio initially measures for two excitation wavelengths (345 nm and 390 nm) (see Table 4). These drugs were used as Ca++ releaser from intracellular stores of dye exposed cell wells. Dye free cells gave a low ratio of autofluorescence value. The order of FURA II/AM ratio was: Ionomycin > Taxotere+Thapsigargin > Taxotere (see Figure 5A). [Ca]i response to taxotere varied in the range below 400 nM, while thapsigargin values were between 1 and 2 μM, and ionomycin values were near saturating for the dye.
Figure 5.
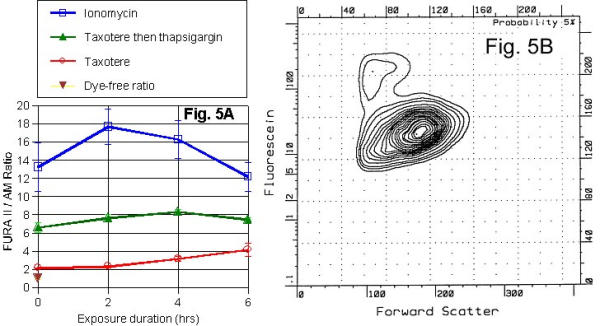
Fluorescent approach to the measurement of intracellular Ca++ ions is represented in (5A). The IC50 value at 24 hrs, as determined by MTT assay, was 10 nM taxotere. The ratio of fluorescent intensity for the two-excitation wavelengths (345 and 390 nm) was plotted against duration of drug exposure. Increases in ratio imply increases in [Ca]i. Open circles show the mean value (with SE bars) as a function of drug exposure and indicate [Ca]i elevation from the taxotere. Some of the wells were then treated with thapsigargin, which caused the release of Ca++ from intracellular stores (e.g., endoplasmic reticulum). Filled triangles show the mean ratio for each set of wells 20 mins after addition of thapsigargin to each well. Likewise, some of the wells were then treated with ionomycin, a Ca++ ionophore (open squares). Inverted triangle is ratio for dye free cells. These values become very small at high, saturating [Ca]i values and inaccuracies in the control zero value can produce errors. (5B) represents approach to the measurement of Ca++. All 3 human prostate cancer lines readily took up sodium green Na+ sensing fluorescent dye. Data is displayed as fluorescence intensity (vertical axis) versus forward scatter (horizontal axis). Comparing control versus treated (VP-16 against DU145 for 24 hrs), there was a clear second population of cells with increased fluorescence and decreased size. The second population appears here at the upper left of the main population. The two populations remained after gating out the high propidium iodide cells (presumably necrotic), yet have distinctly different propidium iodide intensity levels (i.e., there are 3 populations on a propidium iodide plot).
Sodium green pilot studies
Sodium green dye was readily loaded in all human prostate cancer cell lines. Both ionomycin and monensin ionophores altered the sodium green fluorescence signal, and that VP-16 treated DU-145 and PC-3 cells displayed two populations on two-dimensional histograms (sodium green vs forward scatter in Figure 5B). These two populations existed after gating out necrotic cells through propidium iodide (PI) fluorescence. Two-dimensional forward scatter/orthogonal scatter histogram analysis showed that they do not occur in similar two-dimensional histograms using the Na+ insensitive, acetoxymethylester dye calcein/AM. These remaining non-necrotic populations also had different PI fluorescence.
[Na]i and [Ca]i ion sensitive dye assay
VP-16 etoposide (10 μg/ml) induced [Na]i elevations (10–20 mM; SBFI/AM dye) and also [Ca]i elevations (150 μM; Fura II/AM dye) starting at 2–6 hrs and peak by 24 hrs. Ion responses occurred earlier than apoptotic markers (DNA fragmentation using fluorescent endlabelling; reorientation of membrane phosphatidylserine using annexinV/FITC conjugated antibody). SBFI/AM (molecular probes) as ratiometric method was unaffected by variations in loading protocols. Its double wavelength ultraviolet excitation requirement was impractical for flow cytometry (see Figure 6 on left). SBFI/AM and FURA II/AM as Ca++ sensing dye were sensitive ion-sensing dyes. SBFI-exposed and non-exposed wells were compared at both excitation wavelengths. Fluorescent values of 1000–2000 units for exposed (depending on cell line and loading conditions) and 100–200 units for non-exposed control wells were sufficient for the required measurement.
Figure 6.
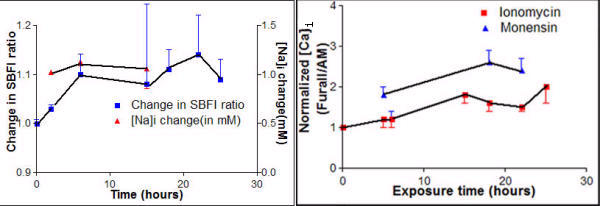
[Na]i and [Ca]i were seen to rise starting 2–6 hrs and stay elevated for up to 24 hrs following exposure of PC3 cells to the antioneoplastics Taxotere or VP16. PC3 cells were plated in black, low autofluorescent 96 well plates. Taxotere (10 nM; solid line) or VP 16 (10 μg/ml; dotted line) was added at indicated times prior to measurement with ion sensing fluorescent dyes for Na+ (SBFI/AM, Molecular Probes; left panel) or Ca++ (Fura II/AM, Molecular Probes; right panel). Following drug exposure and dye loading, plates were run on Titertek Fluoroskan II fluorescent plate reader and ratios obtained from 345 versus 390 nM excitation (with 510 nM emission). Each point represents a minimum of 5 wells; points from each experiment are connected. Calibrations were performed using methods whereby [Ca]i and [Na]i are manipulated with ionophores (respectively ionomycin; monensin) combined with changes in extracellular ions. Statistical confidence on ion change derived from variance of ratios. All mean ion concentrations at 6 hrs or later are greater than control (p < 0.05). Ratios are plotted as changes relative to control. Changes in [Ca]i values are displayed with controls set to 100 (actual mean control was 126 μM). The estimated changes in [Na]i versus control are displayed on separated vertical axes.
In vitro NMR spectroscopy studies on superfused human PCa cells
31P and 23Na TQ spectra of perfused PC-3 cell loaded agarose beads were acquired at baseline. Subsequently, 100-nM/L taxotere was added and 31P-23Na TQ spectra were again acquired at various times. Changes in the phosphorous spectra were observed after 2.5 hours of chemotherapy. 23Na TQ spectral changes were observed at 1.5–3.5 hours after taxotere administration. 31P NMR spectra showed characteristic high increase in phospho-choline peaks (see Figure 7, panel on left). A significant increase of 24% was already apparent in the 23Na TQ spectra amplitude at 1.5 hours after chemotherapy (see Figure 7, right panel). It was indicative of the fact that there was a [Na]i increase in the tumor cells. Following 3.5 hours of taxotere, an even further increase of the TQ amplitude was observed 31% as compared to baseline. Na MQF spectroscopy showed that the agarose beads were permeable to Na based on the transitional TQ signal generation from agarose beads mixed with a Na containing solution. TQ spectrum was acquired for agarose beads employed for the cell perfusion system at various creation times (see Figure 7, middle panel). These spectra showed that the transverse relaxation times of agarose beads were much larger than that for the tumor pellets. Optimum creation time (time necessary to maximize the TQ signal) was about 3.2 msec for cells and about 31 msec for the agarose beads.
Figure 7.
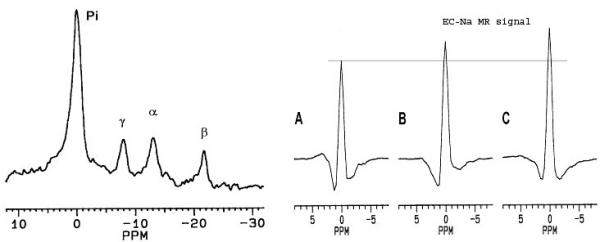
31P spectrum (left panel) was acquired from perfused PC3 cells in agarose beads before chemotherapy. No significant change in the spectrum was observed following 2.5 hours of drug exposure (100 nM of taxotere). The α-, β-, and γ-ATP peaks are well resolved and the Pi peak is due to 31P in the perfusate. Experimental conditions: pulse sequence = single Rf pulse followed by signal detection, Rf flip angle = 70°, repetition time = 1 sec, and total acquisition time = 1 hour. 23Na TQ spectra (right panel) acquired from perfused PC3 cells in agarose beads before (A), 1.5 hours (B), and 3.5 hours (C) after chemotherapy (100 nM of taxotere). Experimental conditions: pulse sequence =  , with the Rf phases cycled for TQF, repetition time = 0.2 sec, creation time τP = 3.2 ms, evolution time τE = 0.1 ms, and total acquisition time = 20 min.
Discussion
The current study presents the fluorescence characteristics of prostate cancer cell lines and indicative of apoptosis-rich tumor physiology in presence of anticancer drugs.
Cell survival following antineoplastics in culture
Cell survival MTT assay defined time course and dose dependence of antineoplastics on human prostate cancer cell lines. Our approach to study time points with MTT technique established the texotere dose to get IC50, IC90 (inhibitory concentration affecting 50%, 90% of cells respectively) till 24 hrs (or 48 hours if response was slow). Multiple doses and times were assessed simultaneously (e.g. 96 well plate experiments with fluorescent dyes) that support our previous study [5].
Quantitative measures of apoptosis with flow cytometry following antineoplastics in culture
Cell survival assays appeared to identify steps in the apoptotic pathway were based on appearance of DNA fragmentation strand breaks and total fluorescent-labeled DNA (propidium iodide) following chemotherapy. Further, this late event in apoptosis (DNA fragmentation) could be quantitated. Our Annexin V/ FITC conjugated antibody and flow cytometry observations corroborated with other study on enhanced fluorescence indicating reorientation of phosphatidylserine within the cell membrane and identification of early cellular commitment to the apoptotic cascade [6].
To fulfill it, experiments were designed for: (a) early events and (b) late events. Early events such as enhanced fluorescence indicated reorientation of phosphatidylserine within the cell membrane after cells were exposed to an Annexin V/ FITC conjugated antibody. One-dimensional histograms were used to examine fluorescence. Late events were evidenced as DNA strand breaks and total fluorescent-labeled DNA (propidium iodide) in fixed cells (treated and control). Two-dimensional histograms of endlabelling fluorescence and propidium iodide (cell cycle plots) provided reasonably good guide of late events and standard error on scatter in both enzyme free and secondary antibody controls using FACS data as earlier reported [7].
Changes in intracellular Na
Fluorescent apoptosis studies and MTT survival assays determined the effects of drugs at various duration exposures to antineoplastics in culture. The time course and magnitude of [Na]i changes appeared to indicate the events in the apoptotic cascade, and characterize the drug/dose for each cell line. SBFI/AM and sodium green dyes (Molecular Probes) appeared as best choice for fluorescent plate scanner and flow cytometry respectively [8]. SBFI/AM (a dual excitation wavelength dye) was observed as ideal choice for cultures at low autofluorescence in 96 well plates to introduce dye, and measure average [Na]i of the cells in each well. However, this dual excitation wavelength dye was not good for standard fluorescence activated cell sorters (FACS). Sodium green for flow cytometry required standard FACS excitation and emission wavelengths. We could run suspensions of controlled and treated live cells through the FACS, to sort populations for subsequent fixation and treat them with SBFI for a confirmatory measure of [Na]i in controls or in the presence of Na ionophores.
These two approaches demonstrate reliable comparison of average [Na]i in treated versus untreated tumor cells, and confirm the apoptotic cells. Sodium green fluorescence and FACS analysis sorted out the PC3 and DU145 cells exposed to VP-16 in presence of sodium ionophore at varying [Na]o concentrations in buffer with balanced chloride and calcein/AM loaded with PI. SBFI/AM is known as dual excitation wavelength dye used with plated cells for their culture, treatment with antineoplastics and examination for the average [Na]i in each cell using the ratio method and in situ calibration. Annexin V/ FITC for fluorescence and SBFI for comparison of [Na]i in two cell populations (with or without apoptosis) interpreted mechanistic relationship between [Na]i, apoptosis and necrosis [9].
23Na-NMR/31P-NMR spectroscopy studies of prostate cancer cells in vitro
23Na-NMR spectroscopy of cell cultures determined the transverse and longitudinal relaxation times to assess changes in [Na]i as noninvasive technique. In our experiments, tumor cells were contained in agarose beads as reference phantom in the center of perfusion filter for suitable acquisition of TQ sodium signals and phosphorous NMR spectra for longer times and were comparable with intracellular (IC) and extracellular (EC) components of SQ and MQ signals in presence of shift reagent for chemotherapy experiments [10]. These experiments suggested that transverse relaxation times of IC and EC compartments using evolution time dependence of the MQ NMR signal at various time points might characterize chemotherapeutic effect. 31P-NMR spectral peaks showed enhanced phosphorylcholine/choline.
In present study, dose dependence and time course using in vivo Na-NMR studies on common prostate cell lines and tumor cells standardized the rapid chemotherapeutic assay of antineoplastic drugs.
The relationship of [Na]i/[Ca]i and apoptosis in present study supported previous view on issues of Na-based data [5] and potentially new antineoplastics: Do [Na]i act by altering [Ca]i? Are [Na]i or [Ca]i signal changes sufficient to cause apoptosis in these cell lines? Does blocking of [Ca]i during drug exposure affect the drug efficacy? What happens to membranes potential during exposure and how is this related to [Na]i?
Fura II/AM measurements and SBFI measurements of [Na]i, were better ratiometric dual excitation dye than a flow cytometry compatible dye. Ratiometric dyes offer more accurate absolute activity reading. Our choice of ionophores for Na+ (monensin and gramicidin) and Ca++ (ionomycin) for the periods of 4 to 24 hours confirmed changes using fluorescent ratiometric dyes, fluorescent endlabelling and annexin V antibody. This approach determined the relationship between membrane changes and intracellular activity changes during apoptosis supporting recently reported literature [11-14].
Conclusion
Cultured different cell lines demonstrated flow cytometry, fluorescent endlabelling, DNA fragment and NMR data provide quantitative information of apoptosis in tumor cells that may be used as a tool for molecular target probes to evaluate drug chemosensitive effect.
Table 3.
[Na]i and [Ca] are represented to rise starting 2–6 hours and stay elevated for up to 24 hours following exposure of PC3 cells to the antineoplastic drugs taxotere or VP16.
| Exposure Time (in hours) | Change in SBFI ratio | [Na]i change (in mM) | Normalized [Ca]i (Fura II/AM(in × 102)) | |
| Ionomycin | Monensin | |||
| 0 | 1.00 ± 0.02 | 0 | 1.0 | 1.0 |
| 2 | 1.03 ± 0.02 | 1.02 ± 0.02 | - | - |
| 4 | - | - | - | - |
| 5 | - | - | 1.21 ± 0.24+ | 1.82 ± 0.21++ |
| 6 | 1.1 ± 0.12* | 1.13 ± 0.11** | 1.22 ± 0.12* | 1.22 ± 0.14** |
| 15 | 1.08 ± 0.41* | 1.06 ± 0.52** | 1.81 ± 0.22 | - |
| 18 | 1.11 ± 0.12 | - | 1.62 ± 0.21+ | 2.61 ± 0.32++ |
| 22 | 1.14 ± 0.21 | - | 1.52 ± 0.13+ | 2.41 ± 0.32++ |
| 25 | 1.09 ± 0.13 | - | 2.04 ± 0.4 1 | - |
Student 't' test P values are shown as * vs ** non-significant and + vs ++ significant P < 0.0001. PC3 cells were plated in black, low autofluorescent 96 well plates. Taxotere or VP16 was added at indicated times prior to measurement with ion sensing fluorescent dyes for Na+(SBFI/AM, Molecular Probes; left panel) or Ca++(Fura II/AM, Molecular Probes). Following drug exposure and dye loading, plates were run on Titretek Fluroscan II fluorescent plate reader and ratios obtained from 345 versus 390 nm excitation (with 510 nm emission). Each reading represents a minimum of 5 wells from each experiment. [Ca]i and [Na]i are manipulated with ionophores (ionomycin, monensin) combined with changes in extracellular ions. All mean ion concentrations at 6 hours or later were greater than control (p < 0.05). Ratios were plotted as changes relative to control (see Figure 6).
Acknowledgments
Acknowledgement
This manuscript in part was presented at peer-reviewed CBMS 2003. The authors wish to acknowledge the experimental data and facilities provided by Jose Katz and Dan Petrylak in helping continuing tumor experiments with grant from Aventis Pharmaceuticals Pvt. Ltd.
Contributor Information
Rakesh Sharma, Email: rakesh_sharma@yahoo.com.
Richard Kline, Email: rpk1@columbia.edu.
References
- Evan G, Vousden K. Proliferation, cell cycle and apoptosis in cancer. Nature. 2001;411:342–348. doi: 10.1038/35077213. [DOI] [PubMed] [Google Scholar]
- Lin XS, Denmeade SR, Cisek L, Isaacs JT. Mechanism and role of growth arrest in programmed (apoptotic) death of prostatic cancer cells induced by thapsigargin. Prostate. 1997;33:201–7. doi: 10.1002/(SICI)1097-0045(19971101)33:3<201::AID-PROS9>3.0.CO;2-L. [DOI] [PubMed] [Google Scholar]
- Kay PA, Riehle DL, Cheville JC, et al. Comparison of quantitative histomorphometry and DNA ploidy in tissue sections of prostate carcinoma. Anal Quant Cytol Histol. 2002;24:7–14. [PubMed] [Google Scholar]
- Maier S, Reich E, Martin R, Bachem M, Altug V, Hautmann RE, Gschwend JE. Tributyrin induces differentiation, growth arrest and apoptosis in androgen-sensitive and androgen-resistant human prostate cancer cell lines. Int J Cancer. 2000;88:245–51. doi: 10.1002/1097-0215(20001015)88:2<245::AID-IJC16>3.3.CO;2-O. [DOI] [PubMed] [Google Scholar]
- Kline R, Wu EX, Petrylak DP, Szabolcs M, Alderson PO, Weisfeldt ML, Canon PJ, Katz J. Rapid in vivo monitoring of chemotherapeutic response using weighted sodium magnetic resonance imaging. Clin Cancer Res. 2000;6:2146–2156. [PubMed] [Google Scholar]
- Mastbergen SC, Duivenvoorden I, Versteegh RT, et al. Cell cycle arrest and clonogenic tumor cells killed by divergent chemotherapeutic drugs. Anticancer Res. 2000;20:1833–38. [PubMed] [Google Scholar]
- Rockwell P, O' Connor WJ, King K, et al. Cell-surface perturbations of the epidermal growth factor and vascular endothelial growth factor receptors by phosphorothioate oligodeoxynucleotides. Proc Natl Acad Sci USA. 1997;94:6523–28. doi: 10.1073/pnas.94.12.6523. [DOI] [PMC free article] [PubMed] [Google Scholar]
- Kopper KL, Adorante JS. Regulation of intracellular calcium in N1E-115 neuroblastoma cells: the role of Na(+)/Ca(++) exchange. Am J Physiol cell Physiol. 2002;282:C1000–8. doi: 10.1152/ajpcell.00182.2001. [DOI] [PubMed] [Google Scholar]
- Lee VM, Quinn PA, Jennings SC, Halligan AW. Altered Na+/H+ exchanger isoform 1 activity in immortalized lymphoblasts from women with pre-eclampsia: evidence for an intermediate phenotype. Clin Sci(Lond) 2002;103:503–9. doi: 10.1042/cs1030503. [DOI] [PubMed] [Google Scholar]
- Winter PM, Poptani H, Bansal N. Effects of chemotherapy by 1,3-bis(2-chloroethyl)-1-nitrosourea on single quantum- and triple quantum-filtered 23Na and 31P nuclear magnetic resonance of the subcutaneously imp-lanted 9L glioma. Cancer Res. 2001;61:2002–7. [PubMed] [Google Scholar]
- Faivre S, Chan D, Salinas R, Woynarowska B, Woynarowski JM. DNA strand breaks and apoptosis induced by oxaliplatin in cancer cells. Biochem Pharmacol. 2003;66:225–37. doi: 10.1016/S0006-2952(03)00260-0. [DOI] [PubMed] [Google Scholar]
- Li Y, Raffo AJ, Drew L, Mao Y, Tran A, Petrylak DP, Fine RL. Fas-mediated apoptosis is dependent on wild-type p53 status in human cancer cells expressing a temperature-sensitive p53 mutant alanine-143. Cancer Res. 2003;63:1527–33. [PubMed] [Google Scholar]
- Drew L, Fine RL, Do TN, Douglas GP, Petrylak DP. The novel antimicrotubule agent cryptophycin 52 ( LY355703) induces apoptosis via multiple pathways in human prostate cancer cells. Clin Cancer Res. 2002;8:3922–32. [PubMed] [Google Scholar]
- Petrylak DP. Chemotherapy for advanced hormone refractory prostate cancer. Urology. 1999;54:30–5. doi: 10.1016/S0090-4295(99)00452-5. Review. [DOI] [PubMed] [Google Scholar]


