

Abstract
Imaging the brain distribution of translocator protein (TSPO), a putative biomarker for glial cell activation and neuroinflammation, may inform management of individuals infected with HIV by uncovering regional abnormalities related to neurocognitive deficits and enable non-invasive therapeutic monitoring. Using the second-generation TSPO-targeted radiotracer, [11C]DPA-713, we conducted a positron emission tomography (PET) study to compare the brains of 12 healthy human subjects to those of 23 individuals with HIV who were effectively treated with combination antiretroviral therapy (cART). Compared to PET data from age-matched healthy control subjects, [11C]DPA-713 PET of individuals infected with HIV demonstrated significantly higher volume-of-distribution (VT) ratios in white matter, cingulate cortex, and supramarginal gyrus, relative to overall gray matter VT, suggesting localized glial cell activation in susceptible regions. Regional TSPO abnormalities were evident within a sub-cohort of neuro-asymptomatic HIV subjects, and an increase in the VT ratio within frontal cortex was specifically linked to individuals affected with HIV-associated dementia. These findings were enabled by employing a gray matter normalization approach for PET data quantification, which improved test–retest reproducibility, intra-class correlation within the healthy control cohort, and sensitivity of uncovering abnormal regional findings.
Keywords: NeuroAIDS, HIV-associated neurocognitive disorder, Translocator protein, Neuroinflammation, Microglia, Molecular neuroimaging
Introduction
Neuropsychiatric effects of HIV infection persist in part because virus establishes a reservoir in the brain that cannot be eradicated with combination antiretroviral therapy (cART; Heaton et al. 2011; Churchill and Nath 2013). Autopsy specimens at terminal stages of the disease indicate that the reservoir is comprised of macrophages and microglia (Churchill and Nath 2013). Downstream effects of viral entry to the central nervous system (CNS) include inflammation and neuronal dysfunction mediated by glial cell activation and direct toxic effects of viral proteins (Kaul et al. 2001; Spudich 2013). Ultimately patients may develop HIV-associated dementia (HAD) and other HIV-associated neurocognitive disorders (HAND). Combined with the increasing lifespan of individuals infected with HIV, glial cell activation may directly contribute to the current and future prevalence of HAND. Technology enabling non-invasive, quantitative study of HIV-associated glial cell activation, such as through molecular neuroimaging, would be useful for repeated assessment of neuroinflammatory burden, prognosis, and therapeutic monitoring.
Translocator protein (TSPO) is a five-transmembrane protein that spans the outer mitochondrial membrane and functions as part of the mitochondrial permeability transition pore (Papadopoulos et al. 2006). TSPO upregulation has long been shown to coincide with microglial activation and has been used as a marker for imaging neuroinflammation, notably with positron emission tomography (PET) using suitably targeted radiotracers, e.g., (Venneti et al. 2006; Doorduin et al. 2009; Kreisl et al. 2013b). We and others have previously used the first-generation TSPO-targeted PET radioligand, [11C]R-PK11195, in HIV-related brain imaging studies (Hammoud et al. 2005; Wiley et al. 2006; Garvey et al. 2013). Differences demonstrated between healthy controls and HIV-infected individuals on [11C]R-PK11195 PET have been modest. In some cases, the results have been conflicting. For example, in comparison to control subjects, we found increased TSPO binding in patients with HAD, but no distinguishable differences in glial cell activity between neuro-asymptomatic HIV subjects and those with HAD, although there was a trend showing that the asymptomatic subjects had a TSPO binding level that was intermediate between HAD and control subjects (Hammoud et al. 2005). A similar study by Wiley et al., which also used [11C]R-PK11195, showed no significant increase in TSPO binding in any HIV sub-cohort (Wiley et al. 2006). With voxel-level analysis, significantly increased [11C]R-PK11195 binding in areas such as cingulate cortex and corpus callosum in neuro-asymptomatic HIV-infected individuals were identified (Garvey et al. 2013). The above mentioned studies might have been limited by small sample sizes, and perhaps more importantly, by the poor performance of [11C]R-PK11195 as a radiotracer. Recently, second generation radiotracers for TSPO, such as [11C]DPA-713, [11C]PBR28, and [18F]FEPPA, have been shown to have improved brain tissue delivery and increased specificity (Brown et al. 2007; Chauveau et al. 2008; Endres et al. 2009; Rusjan et al. 2011). These advantages may overcome the challenge of poor signal-to-noise ratio reported in previous studies using [11C]R-PK11195 and improve the ability to detect an abnormal brain distribution or level of activity of glial cells in HIV-infected individuals.
Here we conducted a brain PET imaging study of HIV-infected individuals employing the second-generation TSPO-targeted radioligand, [11C]DPA-713 (Chauveau et al. 2009; Endres et al. 2009; Endres et al. 2012). Our aim was to compare group differences in glial cell activation between HIV-infected individuals, neuro-asymptomatic as well as those with HAD, and age-matched, healthy controls using this second-generation radiotracer. To accomplish this, we must first address a number of new issues that have arisen in the course of implementing second-generation TSPO-targeted radiotracers.
First, genotype-dependent binding affinity, not reported for [11C]R-PK11195, has been demonstrated in several second-generation TSPO-targeted radioligands (Mizrahi et al. 2012; Owen et al. 2012; Kreisl et al. 2013a). A TSPO gene polymorphism explained inherently different TSPO binding affinity (high, low, and medium) both in vitro and in vivo. Comparisons of radiotracer binding must account for genotypic differences, using genotype as “a fixed factor” in data analysis (Kreisl et al. 2013b). However, there may be additional complicating factors beyond genotype that dictate regional brain uptake of second-generation TSPO radioligands.
It has been known for decades that TSPO, previously referred to as the peripheral benzodiazepine receptor (PBR), is tonically and phasically regulated by neural and hormonal mechanisms (Drugan 1996; Gavish et al. 1999). While difficult to measure in patients in vivo, inferences from data obtained from platelets and post-mortem animal brain studies suggest TSPO to be both acutely and chronically regulated by a number of factors, including stress and anxiety (Gavish et al. 1999). These physiological factors have not been explicitly considered in the analysis of TSPO PET imaging studies. Also, TSPO, mainly found on the outer mitochondrial membrane, binds with high affinity to cholesterol and transports it across the mitochondrial membrane for steroid synthesis. The direct and indirect interactions, if any, between cholesterol and PET ligands binding to TSPO are not well understood. These uncertainties, which can be magnified by the more sensitive second-generation TSPO-targeted radiotracers, may contribute to poor test–retest reproducibility within the same subject, as well as large variations and low intra-class correlation (ICC) among perceived homogeneous cohorts of healthy control subjects of the same genotype. As a result, even after accounting for genotypic differences, difficulties may still arise when interpreting such studies, resulting in false negative results. Given these potential confounding factors associated with TSPO imaging, reproducibility should be investigated when attempting to implement a new radiotracer for this challenging target. To our knowledge, there has been only one published reproducibility study in which the authors indeed found “high intra-subject variability” in regional brain [11C]R-PK11195 PET binding and acknowledged that it may be due to “physiological conditions” (Jucaite et al. 2012). There have been no reproducibility studies published for any of the second-generation TSPO-targeted radiotracers.
Also due to the concerns noted above, a linear hypothesis based on higher absolute radioligand binding→TSPO upregulation→microglial activation→neuroinflammation, might be too simplistic. Here we hypothesize that a normalization method may help control both for known genotypic dependency and, perhaps more importantly, unknown physiological (unrelated to inflammation) factors that affect radioligand brain uptake in TSPO PET imaging studies. This hypothesis is based on the following assumptions: (a) different genotypic and physiological factors contribute to various degrees of global TSPO changes in the brain, hindering (or even disabling) PET analyses based on absolute measurements, even among individuals of the same genotype; (b) despite these inherited and acquired global changes, the pattern of radioligand brain uptake in healthy individuals, quantifiable by a regional-to-global ratio, should be reproducible and resemble one another; (c) disease-related regional TSPO abnormalities will manifest themselves as violations of this resemblance and will therefore be discovered—such violations always exist in disease states regardless of global TSPO changes. This regional, normalized approach may be particularly plausible for studying HIV-infected brain because HIV compartmentalization and regional differences (Churchill and Nath 2013) are well documented, even though the underlying mechanisms are unknown. When determining which brain region should serve as a control for normalization, the gray matter arose as a prime candidate because of its relatively uniform pattern of high baseline binding in healthy subjects, even identifiable (although at a lower level) by [11C]R-PK11195. Gray matter may provide the sensitive yet statistically stable denominator needed for the normalization process.
Our study comparing TSPO brain distribution between HIV-infected individuals and age-matched, healthy control subjects using [11C]DPA-713 PET followed four stages: (a) to confirm TSPO genotypic dependency, both in vitro and in vivo, of [11C]DPA-713 binding to TSPO, as has proved the case with other second-generation radiotracers that target TSPO; (b) to evaluate reproducibility of quantitative PET imaging from test–retest scans in a sub-group of study subjects; (c) to investigate empirical normalization methods and compare them against the use of absolute volume-of-distribution (VT) measurements for PET data analysis; and (d) to apply these methods in a bona-fide clinical setting by studying HIV-infected individuals using the optimum PET data analysis strategy.
Materials and methods
Human subjects
This study was approved by the Johns Hopkins Institutional Review Board and all subjects provided informed consent prior to participation in the study. A total of 35 subjects under the age of 55 (healthy controls: N=12; HIV: N=23) underwent [11C]DPA-713 PET neuroimaging. Healthy control subjects ranged in age from 22 to 52 years (mean±standard deviation: 39.8±10.8) and underwent a careful clinical interview to ensure health. Specifically, each healthy participant was without history of medical disease or surgery in the past year. They were without current use of prescribed and over-the-counter medications, with the exception of inclusion of one female participant taking an oral contraceptive medication. All healthy participants also denied alcohol and illicit substance abuse, neurologic deficit, psychiatric illness, and head trauma with loss of consciousness. The 23 patients with a diagnosis of HIV, ranging from 27 to 54 years of age (46.3±6.6), also underwent clinical interview. All HIV patients denied history of surgery in the past year, had no active alcohol or illicit substance abuse, and had no history of loss of consciousness. They denied use of prescribed or over-the-counter anti-inflammatory medications but were all actively receiving cART and other prescribed medications. All subjects with HIV had undetectable HIV viral load (plasma HIV RNA<50 copies/mL). CD4 counts at the time of the scan were available for 14 of the 23 patients with HIV (mean CD4 count, 551± 207 cells/μL).
DNA extraction and polymorphism genotyping
All subjects in both HIV and control groups underwent TSPO (rs6971) genotype analysis completed using the rs6971 TaqMan assay (Applied Biosytems®, Life Technologies, Grand Island, NY) on isolated DNA (PureGene® Blood Core Kit C, Qiagen, Valencia, CA) from each individual participant. Three different genotypes are defined as C/C, T/T, and C/T, respectively, with the first two indicating the homozygotes for high affinity (C/C) and low affinity (T/T) binding phenotype, and the last group (C/T) heterozygous with mixed affinity binding phenotype.
In vitro binding assays
In vitro Binding assays were performed in part to confirm the genotype-dependent TSPO binding behavior of DPA-713 using blood samples from selected healthy control subjects from all three genotypes, following the procedures below.
Peripheral tissue binding isotherms
Peripheral whole blood samples were collected from each participant. Plasma and platelets were isolated by centrifugation. Lysates of human platelets in assay buffer (50 mM Tris, 140 mM NaCl, 1.5 mM MgCl2, 5 mM KCl, 1.5 mM CaCl2, pH 7.4 at 37 °C) were incubated with eight different concentrations of [3H]DPA-713, ranging from 0.4 to 400 nM, in a final volume of 250 μL for 20 min at 37 °C. The range of concentrations of radioligand included values below and above previously published binding affinities (binding affinity [Ki], 15–66.4 nM; Owen et al. 2011). Nonspecifically bound radioligand was measured in the presence of 50 μM (R,S)-PK11195 (Sigma-Aldrich, St. Louis, MO). Incubation mixtures were filtered through Whatman GF/B filter plates, which had been previously immersed in 0.5 % polyethylenimine for 1 h at 4 °C. Subsequently, filter plates were washed four times with 1 mL cold buffer (50 mM Tris base, 1.4 mM MgCl2, pH 7.4, 4 °C). Filter plates were allowed to dry and then 50 μL of MicroScint 20™ (Perkin Elmer, Waltham, MA) was added to each well. Radioactivity was measured using a TopCount NXT Microplate scintillation counter (Perkin Elmer). Nonspecific binding was subtracted from total binding to obtain specific binding.
Data analysis
Binding affinities (Kd in nM) were determined by using two non-linear regression fitting algorithms, one assuming one-site and the other assuming two-site binding (GraphPad Prism, version 5.0; GraphPad Software Inc., La Jolla, CA). Protein concentrations (μg protein/mL) were determined using a colorimetric assay where absorbance was read at 750 nm (Dc Protein Assay Kit; Bio-Rad, Hercules, CA).
In vivo brain imaging
Test–retest study
Three of the 12 healthy control subjects and three patients with HIV participated in the test–retest reproducibility portion of this study. The total of six participants included three males and three females, with an average age of 46.3±12.1. The second [11C]DPA-713 PET scan was completed later on the same day as the initial PET scan, following the same study and analysis protocols described in this subsection.
Radiotracer synthesis
[11C]DPA-713 was synthesized as described in Investigational New Drug Application #78,283. Radiochemical purity was greater than 95 %. It was delivered with high specific activity (278.6±162.6 GBq/μmol) via intravenous bolus injection at the onset of a 90-min dynamic list mode PET acquisition. The injected dose was 684.39± 23.16 MBq.
Plasma sampling
Arterial line was placed in all subjects and measurement of the arterial plasma input function was conducted as previously described (Endres et al. 2009) through collection of 25–35 blood samples (1 mL) over the course of each 90 min PET scan and collection of an additional eight serial 4 mL samples for radiolabeled metabolite measurements.
Image generation
PET scans were acquired using a second-generation High Resolution Research Tomograph scanner (HRRT, Siemens Healthcare, Knoxville, TN), an LSO-based, dedicated brain PET scanner with 2.5 mm resolution. The 90 min list mode data were binned into 30 frames (four 15 s, four 30 s, three 1 min, two 2 min, five 4 min, and twelve 5 min frames). The data were then reconstructed using the iterative ordered subset expectation maximization (OS-EM) algorithm (with 6 iterations and 16 subsets), with correction for radioactive decay, dead time, attenuation, scatter and randoms (Rahmim et al. 2004). The attenuation maps were generated from 6 min transmission scans performed with a 137Cs point source prior to the emission scans. The reconstructed image space consisted of cubic voxels, each 1.22 mm3 in size, and spanning dimensions of 31 cm×31 cm (transaxially) and 25 cm (axially).
All subjects also underwent brain magnetic resonance imaging (MRI) to facilitate anatomical delineation of regions of interest (ROIs) on brain PET images after PET-MRI co-registration (detailed below). MRI T1-weighted images were obtained on either a 1.5 T Signa Advantage system (GE Medical Systems, Waukesha, WI) as previously described (Endres et al. 2009) or on a Phillips Achieva 3 T scanner (Andover, MA) with a 32-channel head coil to obtain a 1×1× 1 mm 3D MP-RAGE sequence.
Image processing and generation of time-activity curves (TACs)
The software package PMOD (v3.3, PMOD Technologies Ltd, Zurich, Switzerland) was used to perform all steps described herein, as well as all quantification procedures below. The regional TACs were generated as follows: (a) inter-frame motion correction: all 30 frames of PET reconstructed images were rigidly realigned to the 0–30 min mean PET image, which was obtained by averaging frames 1 through 18; (b) PET-MRI co-registration: the 0–30 min PET mean image and, subsequently, all 30 motion-corrected PET frames, were co-registered to the subject’s T1-weighted MRI image using rigid transformations; (c) spatial normalization: each subject’s MRI was spatially normalized to the corresponding template from the Montreal Neurological Institute (MNI) followed by applying the same non-rigid transformation to the co-registered/motion-corrected dynamic PET frames; and (d) ROI definition: the existing Automated Anatomical Labeling (AAL) brain template was directly overlaid on the spatially normalized PET images to generate brain regions automatically. Finally, among all of the automated regions, we combined regions from left and right brain hemispheres and selected 16 ROIs for generating TACs and conducting further regional analyses based on hypothesized involvement of these regions in HIV-associated cognitive, behavioral and motor deficits. These ROIs together cover both cortical and subcortical brain regions. Regions of total gray matter (GM), white matter (WM), and whole brain (WB) were also defined based on the existing PMOD brain mask. These latter global regions were mainly used for exploring the aforementioned empirical normalization approach.
Calculation of regional total volume-of-distribution (VT)
Based on the TACs obtained, [11C]DPA-713 binding to TSPO was quantified with the use of metabolite-corrected arterial plasma input functions. Following other published studies using the second-generation ligands, the main out-come measure presented was VT, obtained using the Logan graphical method for each defined brain region.
Data analysis and VT normalization
Prior to performing normalization, the regional VT values were examined for intra-subject reproducibility, inter-subject resemblance within the same genotype, and genotype dependency across different TSPO (rs6971) genotypes. Specifically, we employed descriptive statistics, Bland–Altman plots, as well as intra-class correlation coefficients (ICCs) to investigate intra-subject reproducibility for the six individuals undergoing both test and retest scans. The ICCs quantified the effectiveness of using VT for providing both resemblance (between test and retest) and uniqueness (among 6 subjects) in each brain region. ICCs were also used for quantifying the effectiveness of using VT to provide inter-subject regional outcome resemblance (among healthy controls of the same genotype) and regional uniqueness (among all defined ROIs).
The calculations of ICCs were performed with the statistical software package R (v2.15.0) using the mixed effect model. For example, in the case of studying ICCs for all subjects of the same genotype, we have: Yij=μ+bi+εij, where i indicates different regions and j indicates different healthy control subjects. Variable μ is the population average over all subjects and regions, bi is the region specific random effect, where bi~N(0, σb2) and εij~N(0, σε2 ) i.i.d. Then ICC=σb2/ (σb2+σε2). The mixed effect models were fit using the lme4 package in R. A higher ICC value (on the scale of [0, 1]) in the healthy control group is desirable, as it indicates better resemblance within the same region and clearer distinction between different brain regions in this genotypically homogeneous cohort, providing a foundation for studying the diseased (HIV) cohort.
These examinations were repeated after the absolute regional VT values were normalized by the GM, WM, or WB VT obtained from the same subject and scan. The normalized regional outcome measures were obtained using nVT = VT/VT_n, where n represents GM, WM, or WB. Finally, using both VT and the best performing nVT, we searched for significant regional differences between HIV and control cohorts by using the two-tailed Wilcoxon–Mann–Whitney test controlling for false discovery rate (FDR) (GraphPad Prism, v6).
Neuropsychological testing in HIV patients and stratified analyses of PET data
Excluding the three HIV patients participating in the reproducibility sub-study, neuropsychological testing was performed for the rest of the HIV patients (20 out of 23) using the modified Memorial Sloan-Kettering dementia (MSK) scale developed by our institution and other members of the Northeast AIDS dementia (NEAD) Consortium (Marder et al. 2003), as well as the more recent HAND criteria (Antinori et al. 2007). The MSK scale is commonly used for neuropsychological staging of HIV infected patients, and is based on functional, intellectual, and motor capacity. We chose to use the MSK scale in conjunction with this PET study, allowing us to exclude any individual with significant neuropsychological impairment (MSK score >2) due to concerns that they lacked capacity to provide informed consent.
The 20 patients tested were stratified as neuro-asymptomatic (MSK score=0), mild impairment (= 0.5), and HAD (= 1 or 2), with the first two groups together also defined as HIV non-demented (HIV-ND). The PET data were further analyzed for HIV-ND vs. HAD and neuro-asymptomatic vs. healthy controls, using the two-tailed Wilcoxon–Mann–Whitney test controlling for FDR. The more recent HAND criteria allow further stratifying HIV patients with MSK=0 into asymptomatic neurocognitive impairment (ANI) and completely normal. However, we chose not to stratify patients further into smaller sample sizes, which would also enable direct comparisons to results from (Garvey et al. 2013).
Results
Genotyping
Genotype assay results of the rs6971 polymorphism identified eight healthy participants with C/C genotype (Ala/Ala), three with C/T (Ala/Thr), and one with T/T (Thr/Thr). Genotype results among the 23 HIV patients included twelve C/C, eight C/T, and three T/T individuals.
In vitro binding assays
Platelets were assayed in seven subjects. Saturation binding data using [3H]DPA-713 and TSPO protein expressed on platelets was predicted by rs6971 genotype (Table 1). Platelets from four subjects with C/C rs6971 genotype (Ala/ Ala) had a high affinity measure of mean Kd=2.25±0.05 nM. This result was independently confirmed using association and dissociation binding experiments (data not shown). The two subjects with C/T rs6971 genotype (Ala/Thr) each had Kd=6 nM, and one subject with T/T rs6971 genotype (Thr/ Thr) had a measured Kd=60 nM. All data best fit a one-site binding model.
Table 1.
Saturation binding results using [3H]DPA-713 and TSPO isolated from platelets from seven healthy participants demonstratesthat Kd value can be predicted by rs6971 genotype
| rs6971 Genotype | Kd (nM) | SE |
|---|---|---|
| C/C (n=4) | 3 | 13 % |
| 2 | 10 % | |
| 2 | 10 % | |
| 2 | 13 % | |
| C/T (n=2) | 6 | 13 % |
| 6 | 19 % | |
| T/T (n=1) | 60 | 20 % |
Data are presented for the one-site model
SE standard error
In vivo brain imaging
There were no significant differences in the [11C]DPA-713 injected, including specific activity and mass, in PET scans across all healthy control and HIV-infected subjects.
Test–retest reproducibility
Three healthy controls and three patients with HIV, all of whom were of the C/C genotype (Ala/Ala), underwent the retest scan later on the same day as their initial scan. Demographic and injection characteristics of these six individuals who underwent [11C]DPA-713 PET test–retest reproducibility are summarized in Supplementary Table 1.
When quantified by the absolute VT, all 16 regional measurements and three global measurements (GM, WM, WB) from each of the six subjects showed significant systematic biases: retest VT (obtained in the afternoon) was always higher than the test VT (obtained in the morning). These biases were easily visualized by the Bland–Altman plot (Fig. 1a), where all data points generated from a pair of repeated measures are above the y=0 line, with the y offset roughly proportional to the test–retest mean. When using ICC to quantify the VT resemblance between test and retest for the six different subjects, very poor results were found in all ROIs (ICC=0.028± 0.057), indicating subject-dependent biases. Inclusion of the free plasma fraction (fp) had negligible impact on removing these biases (data not shown).
Fig. 1.

Bland–Altman plot comparison of test–retest reproducibility obtained using VT and GMVT: (a) Before gray matter normalization, the plot demonstrates a systematic bias as all results are above zero. (b) After gray matter normalization, systematic bias has been eliminated as the mean of all data points is close to zero
By contrast, when replacing VT with GM normalized VT (denoted as GMVT), the renewed Bland-Altman plot (Fig. 1b) demonstrated effective elimination of biases. Normalizing by WM or WB also removed these biases to various degrees. However, when compared by descriptive statistics, the GM normalization showed the best reproducibility and highest overall ICC values. Regional statistics obtained with GM normalization are presented in Table 2. For consistency, results of the initial test scan (first of the day) from these six individuals, together with PET data from the other subjects, were used for subsequent group comparisons.
Table 2.
Test–retest characteristics of [11C]DPA-713 gray matter-normalized VT among six participants (three healthy participants and three HIV-positive participants)
| Brain region | Test Mean (SD) |
Retest Mean (SD) |
Error Range | Difference Mean (SD) |
ICC | ||
|---|---|---|---|---|---|---|---|
| Frontal CTX | 0.98 (0.04) | 0.96 (0.04) | 0.01 | to | 0.03 | 0.023 (0.010) | 0.81 |
| Temporal CTX | 0.94( 0.04) | 0.95 (0.04) | −0.06 | to | 0.02 | −0.016 (0.031) | 0.67 |
| Parietal CTX | 0.93 (0.04) | 0.90 (0.06) | −0.01 | to | 0.06 | 0.032 (0.026) | 0.70 |
| Occipital CTX | 1.01 (0.04) | 1.01 (0.03) | −0.03 | to | 0.04 | 0.003 (0.025) | 0.79 |
| Cingulate CTX | 1.01 (0.04) | 1.01 (0.06) | −0.04 | to | 0.04 | 0.002 (0.027) | 0.88 |
| Cerebellum | 0.96 (0.03) | 0.98 (0.03) | −0.04 | to | 0.01 | −0.018 (0.016) | 0.74 |
| Precentral gyrus | 1.00 (0.02) | 0.97 (0.30) | 0.01 | to | 0.07 | 0.028 (0.020) | 0.32 |
| SMC | 0.98 (0.05) | 0.95 (0.06) | 0.00 | to | 0.08 | 0.023 (0.034) | 0.78 |
| Precuneus | 0.98 (0.02) | 0.96 (0.03) | −0.01 | to | 0.05 | 0.020 (0.022) | 0.32 |
| Supramarginal CTX | 1.05 (0.05) | 1.05 (0.04) | −0.03 | to | 0.02 | −0.001 (0.025) | 0.89 |
| Caudate | 0.69 (0.09) | 0.69 (0.09) | −0.08 | to | 0.05 | 0.002 (0.052) | 0.87 |
| Putamen | 0.93 (0.02) | 0.93 (0.05) | −0.05 | to | 0.04 | 0.002 (0.042) | 0.42 |
| Globus pallidus | 1.01 (0.05) | 0.99 (0.07) | −0.03 | to | 0.06 | 0.028 (0.033) | 0.80 |
| Amygdala | 1.07 (0.09) | 1.05 (0.10) | −0.01 | to | 0.09 | 0.026 (0.036) | 0.90 |
| Thalamus | 1.16 (0.08) | 1.15 (0.14) | −0.11 | to | 0.15 | 0.017 (0.088) | 0.73 |
| HPpHP | 0.99 (0.07) | 1.00 (0.09) | −0.08 | to | 0.04 | −0.013 (0.043) | 0.87 |
| White matter | 0.96 (0.06) | 0.94 (0.07) | −0.02 | to | 0.07 | 0.016 (0.032) | 0.86 |
| Whole brain | 0.96 (0.03) | 0.95 (0.02) | −0.01 | to | 0.02 | 0.009 (0.013) | 0.78 |
The regions shown with bold ICC values were used in multiple comparisons
SD standard deviation, CTX cortex, SMC supplementary motor cortex, HPpHP hippocampal/parahippocampal area
In vivo evidence of genotype dependency
Genotype was found to predict VT values of 12 healthy control (as well as 23 HIV) subjects for each region. For clarity and subsequent reference, the trends in several representative regions are shown in Fig. 2.
Fig. 2.
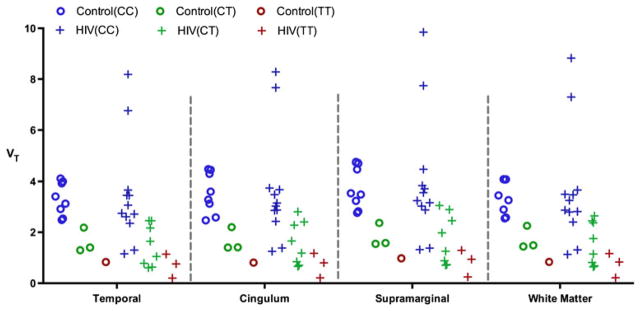
Regional [11C]DPA-713 VT is predicted by C/C (Ala/Ala), C/T (Ala/Thr), and T/T (Thr/Thr) rs6971 genotype in data from 12 healthy control subjects and 23 patients with HIV (Data are shown for four representative brain regions)
Resemblance of regional PET outcome among healthy controls
The resemblance of regional PET outcome among healthy controls of the same genotype, specifically the eight C/C individuals, was quantified by ICC. An ICC plot was generated with VT values from 16 ROIs (Fig. 3a), and showed lack of resemblance (ICC=0), equivalent to a purely random brain TSPO distribution in different brain regions across these eight healthy C/C subjects. However, the ICC was improved to 0.73 with the use of GMVT instead (Fig. 3b), depicting a reasonable resemblance of regional TSPO brain distribution among the eight unique C/C subjects. The use of WM and WB normalization resulted in poorer ICCs (0.653 and 0.722, respectively), leading us to select GMVT for further analyses and discussion. With GM normalization, presumably eliminating the confounding genotype-driven binding effect, the inclusion of the other four non-C/C control subjects (three C/T and one T/T) produced an ICC of 0.66. Demographic and injection characteristics of healthy control subjects (N=12) who underwent [11C]DPA-713 PET are shown in Supplementary Table 2.
Fig. 3.

Gray matter normalization of VT improves the reproducibility and inter-subject agreement across all regions as reflected in the intra-class correlation coefficient (ICC) comparison (a) before and (b) after gray matter normalization of VT (The blue dots indicate individual data points, and the red dots show regional means)
Comparison between control and HIV subjects of the same (C/C) genotype
Lack of reproducibility associated with VT in the [11C]DPA-713 PET studies strongly suggested that VT is not a reliable outcome variable for subsequent data analyses. The fact that the use of VT resulted in ICC=0 in a perceived homogeneous cohort (eight healthy C/C subjects) provided further evidence. To verify this nevertheless, we first performed healthy control vs. HIV comparisons using VT, with only C/C subjects in both groups (healthy control: N=8, age 38.4±11.9; HIV: N=12, age 47.8±6.0). Based on VT, there was no significant difference found in any of the ROIs (Supplementary Table 3).
Next, we used GMVT instead of VT to compare 13 brain regions and WM between control C/C and HIV C/C subjects. Among 16 previously defined ROIs, precentral, precuneus, and putamen were not compared due to concerns of their low ICC values as shown in Table 2. With a false discovery rate (FDR) q=5 %, significantly higher GMVT were identified in the supramarginal cortex and WM for the HIV C/C sub-cohort (Supplementary Table 3). Individual data points from these regions, as well as the temporal region, which showed significant GMVT differences prior to FDR correction, were plotted in Fig. 4, using both (a) VT and (b) GMVT.
Fig. 4.

Plots of individual data points comparing HIV and control subjects of the same C/C genotype, using either VT or GMVT (Selected regions are shown, and detailed statistics for all regions are presented in Supplementary Table 3)
Inclusion of C/Tand T/T genotypes
Due to the small number of C/T and T/T subjects in the healthy control group, we did not perform control vs. HIV comparisons using either of these genotypes by themselves. Based on the results obtained to this point, it would not be useful and would actually be incorrect to use VT in a combined study including all genotypes. By contrast, using GMVT for an across-genotype analysis is plausible based on the observation of significant improvement in all aspects of statistical analysis above, and the assumption that useable data can be obtained from all subjects regardless of rs6971 genotype. As a simple verification of this assumption, we tested combined-genotype comparisons between HIV and healthy controls using GMVT. First, only C/T subjects in both cohorts were added for combined C/C+C/T comparisons (Control: N=11, age 39.2±11.1, HIV: N=20, age 46±6.9). With control of FDR, significantly higher GMVT values were found in supramarginal, WM, and temporal regions, all of which were suggested (but only the first two survived FDR correction) in C/C-only comparisons. Next, we also included the T/T genotype for a comparison of 12 controls vs. 23 HIV patients. We again found four significant differences after FDR correction, but with significance demonstrated in cingulum rather than the temporal region. All P-values obtained are presented in Table 3, and the GMVT plots from those regions are shown in Fig. 5, which can be compared to the VT plots from the same regions shown in Fig. 2.
Table 3.
Regional P values from combined-genotype comparisons (HIV vs. Healthy Control) based on GMVT
| Regions | C/C NHIV=12 Ncontrol=8 |
FDR q=0.05 |
C/C+C/T NHIV=20 Ncontrol=11 |
FDR q=0.05 |
ALL NHIV=23 Ncontrol=12 |
FDR q=0.05 |
|---|---|---|---|---|---|---|
| Temporal CTX | 0.032 | 0.007 | * | 0.028 | ||
| Caudate | 0.353 | 0.516 | 0.245 | |||
| Globus Pallidus | 0.575 | 0.785 | 0.957 | |||
| SMC | 0.820 | 0.703 | 0.972 | |||
| Frontal CTX | 0.061 | 0.074 | 0.036 | |||
| Cingulate CTX | 0.087 | 0.020 | 0.012 | * | ||
| Amygdala | 0.207 | 0.864 | 0.909 | |||
| Occipital CTX | 0.401 | 0.143 | 0.099 | |||
| Supramarginal CTX | 0.005 | * | 0.0004 | * | 0.001 | * |
| Thalamus | 0.923 | 0.773 | 0.638 | |||
| Parietal CTX | 0.919 | 0.454 | 0.307 | |||
| HPpHP | 0.982 | 0.962 | 0.982 | |||
| White Matter | 0.005 | * | 0.008 | * | 0.005 | * |
The values of P<0.05 are in bold, and significant findings after correcting for false discovery rate (FDR) are indicated by an asterisk
CTX cortex, SMC supplementary motor cortex, HPpHP hippocampal/parahippocampal area
Fig. 5.
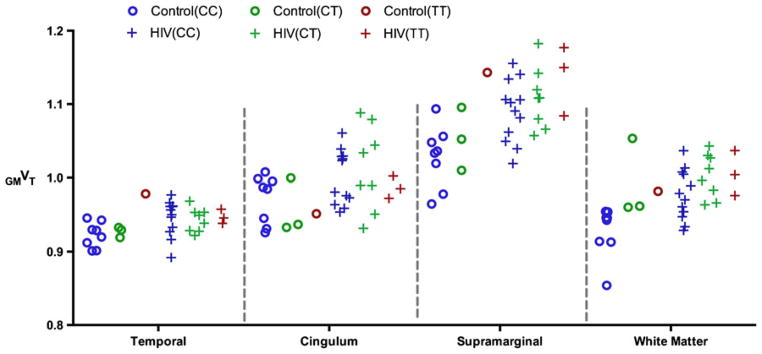
Plots of individual GMVT data in both control and HIV cohorts, including all three different genotypes in four brain regions (This can be compared to the VT plots shown in Fig. 2, showing the normalization approach uncovered significant findings, as detailed in Table 3)
Neuropsychological stratification and further data analysis
Among the 20 (out of 23) HIV patients who underwent neuropsychological testing, eight patients (age, 44.9±9.1, 4C/C, 2 C/T, 2 T/T) were neuro-asymptomatic (without evidence of functional, mental or motor impairment; MSK score, 0), four patients (age, 47.0±5.0, 3C/C, 1 C/T) had mild-impairment (MSK 0.5), and eight patients (age, 45.6± 5.1, 2 C/C, 5C/T, 1 T/T) had unequivocal evidence of functional, intellectual and/or motor deficits of dementia (MSK score: 1 in seven patients, and 2 in a single patient). Given the results from the above mentioned subsections, particularly those in Table 3 and Fig. 5, we conducted further analyses using GMVT including all genotypes. The overall trends among healthy controls, HIV asymptomatic, mild impairment, and HAD sub-cohorts were plotted in Fig. 6 using GMVT (mean and standard deviation) for selected regions.
Fig. 6.

Plots using GMVT showing the trends among healthy controls, HIV asymptomatic, mild impairment, and HIV dementia sub-cohorts (mean and standard deviation shown for each region)
With HIV patients grouped into HIV-ND (asymptomatic+ mild impairment) and HAD sub-cohorts: non-demented (MSK score<1, N=12, age 45.6±7.8) vs. demented (MSK score≥1, N=8, age 45.6±5.1), significantly higher GMVT in frontal cortex was found in HAD patients (FDR q=0.05). When comparing completely neuro-asymptomatic patients (MSK score 0, N=8, age 44.9±9.1) vs. healthy controls (N= 12, age 38.4±11.9), with FDR q at 5 %, no discoveries were made; however, with FDR q=10 %, WM, cingulum, occipital, and temporal regions showed significant findings. The detailed P-values for the above mentioned comparisons are shown in Table 4.
Table 4.
Examples of regional P values from stratified comparisons based on GMVT in control and HIV cohorts
| Regions | HIV-ND vs. HAD NHIV-ND=12 NHAD=8 |
FDR q=0.05 | HIV-Asym. vs. Healthy Control NHIV-Asym=8 Ncontrol=12 |
FDR q=0.10 |
|---|---|---|---|---|
| Temporal CTX | 0.185 | 0.037 | * | |
| Globus pallidus | 0.091 | 0.608 | ||
| Frontal CTX | 0.001 | * | 0.251 | |
| Cingulate CTX | 0.724 | 0.029 | * | |
| Occipital CTX | 0.204 | 0.026 | * | |
| Supramarginal CTX | 0.170 | 0.058 | ||
| Parietal CTX | 0.024 | 0.826 | ||
| White matter | 0.978 | 0.024 | * |
The values of P<0.05 are in bold, and significant findings after correcting for false discovery rate (FDR) are indicated by an asterisk
CTX cortex
Discussion
We confirmed the expected rs6971 genotypic dependency for the second-generation TSPO-targeted radioligands [3H]- and [11C]DPA-713 through both in vitro dissociation constant (Kd) measurements using [3H]DPA-713 in peripheral platelets isolated from randomly selected individuals (Table 1), and in vivo [11C]DPA-713 PET imaging VT measurements (Fig. 2). Accordingly, it is possible to classify an individual as a high-, low- or medium-affinity class binder either through rs6971 genotyping or by performing a peripheral platelet binding experiment before conducting brain PET imaging in that individual. These findings are consistent with those shown for other second-generation TSPO-targeted radio-tracers such as [11C]PBR28 and [18F]FEPPA (Mizrahi et al. 2012; Kreisl et al. 2013a).
However, even with this classification, we have identified concerns with analyzing [11C]DPA-713 PET data using VT. First and foremost, while both test and retest data met the requirements of using the Logan graphical method and demonstrated good fitting, reproducibility was non-existent when using such measures, evident from the systematic increases in regional VT values from test to retest (Fig. 2a), which could not be eliminated by taking into account free plasma fraction. To our knowledge there have been no test–retest studies published for any other second-generation TSPO ligand, and the published reproducibility study for [11C]R-PK11195 placed test and retest scans from days to weeks apart (Jucaite et al. 2012). Although we have not yet investigated the exact mechanism of the systematic increase of VT upon same-day retest, there are several possible explanations, such as hormone-mediated phasic changes in TSPO expression, tonic changes due to stress/anxiety related to the procedure, or alteration in blood cholesterol due to food intake between the scans, which was not controlled (Drugan 1996; Gavish et al. 1999). One may argue that if the time of the scan were controlled such that the test and retest studies were performed at the same time during the day but on different days, the systematic bias observed in this same-day test–retest might not manifest. This appeared to be the case for the aforementioned reproducibility study using [11C]R-PK11195, however, the extremely poor ICC (= 0) observed in our healthy control subjects of the same C/C genotype may cast doubt on the effectiveness of similar approaches, as the data resulting in ICC=0 were all from the first (or only) scan that took place in the morning. While the utility of requiring subjects to fast prior to scanning with [11C]DPA-713 remains to be determined, there is evidence indicating that TSPO density could be affected by chronic, non-disease-related factors as well, which would be difficult to control. The [11C]R-PK11195 reproducibility study (Jucaite et al. 2012) suggested the possibility of such confounding variables.
We have shown that for [11C]DPA-713 PET neuroimaging, GMVT may enable analysis of scans where the standard measure of VT is confounded by poor intra-subject reproducibility and inter-subject ICC in what should be a healthy, homogenous (with respect to rs6971 genotype) cohort. Although an empirical approach, we believe that the assumptions for using the GMVT, as outlined in the introduction, are reasonable based on TSPO physiology, and the results from this study have demonstrated its effectiveness. Without normalization, no significant findings were discovered, and with normalization, fairly significant and relatively consistent regional findings across genotypes were obtained—including regions that are corroborated by prior HIV imaging studies, both with PET, e.g. (Garvey et al. 2013) and MRI, e.g. (Kuper et al. 2011). We refrain from applying these arguments to other TSPO PET imaging studies, many of which employed fairly small sample sizes and examined few brain regions. However, we believed it was important to examine the intra-subject reproducibility and inter-subject ICC using a variety of outcome measures for [11C]DPA-713 PET before undertaking further clinical analyses.
While we have shown that with GMVT the sensitivity of detection was improved, as VT was very likely contaminated by uncontrolled physiological factors (Supplementary Table 3), an obvious concern of using such a normalization approach was losing the ability to detect possible changes in the region used as the denominator, i.e., the tissue used for normalization—GM in this case. We acknowledge such a limitation, while postulating that TSPO is an inherently challenging target, as discussed above. We realize that future studies may be needed to validate a normalization approach as provided here, perhaps leading to PET imaging methods that avoid arterial blood sampling. However, such studies are beyond the scope of the current work.
To use the proposed normalization approach for cross-genotype studies, one must assume that the pattern of TSPO distribution described by GMVT is consistent across different genotypes in healthy controls—that there are no significant pre-existing regional differences associated with rs6971 genotype. The small number of healthy C/T and T/T subjects in our study does not provide a sufficient sample size to examine this. While adding C/T and T/T subjects to the C/C group did slightly degrade the ICC among healthy controls, results obtained from comparing healthy control and HIV cohorts were consistent upon inclusion of C/T and later T/T subjects in the original C/C-only comparisons (Table 3). In fact, with those subjects included, findings in regions such as cingulum and supramarginal cortex have been statistically enhanced. This might indirectly suggest the validity of using GMVT for cross-genotype analysis in [11C]DPA-713 PET studies. Also, we noted that previously published studies employing second-generation TSPO-targeted radioligands exclude subjects with the low affinity (or T/T) genotype, because these subjects showed very low binding and compartmental models providing adequate fitting for TACs from both high- and mixed-affinity binders did not fit T/T subjects. From our limited [11C]DPA-713 PET data of T/T subjects, we observed that they fit the two-tissue three-compartment models as well as the C/C or C/T genotypes. More data from future [11C]DPA-713 PET scans of additional T/T subjects may further confirm the validity of using GMVT for studying T/T subjects together with C/C and C/T. Based on our observations in Table 3, we did not exclude T/T subjects in the subsequent HIV studies.
Employing GMVT we were able to discover significant differences in the healthy control vs. HIV, healthy control vs. neuro-asymptomatic HIV subjects, and HIV-ND vs. HAD comparisons (Table 4 through 5). Trends also emerged with more detailed HIV patient stratification, as shown in Fig. 6. Taken together, these results may suggest that regional TSPO changes precede neuro-cognitive decline, and the occurrence of more pronounced changes in these regions as well as the emergence of new regional abnormality are linked to the worsening of neurological symptoms. A particularly strong finding was the higher frontal TSPO GMVT in HAD vs. HIV-ND. The association between frontal lobe changes and HAD has generated considerable interest (Lopez-Villegas et al. 1997; Cysique et al. 2013; Roberts et al. 2013). Particularly, (Zhang et al. 2012) suggested that higher level of reactive oxygen species (ROS) in frontal cortex would contribute to the HIV induced neuro-inflammation and apoptosis of neuronal and glial cells. The predicted neuroinflammation in the frontal cortices of HAD patients was confirmed by our study. Other regional abnormalities discovered in our study have also been previously linked to HIV, such as in WM (Chiang et al. 2007; Chen et al. 2009; Mohamed et al. 2010; Kuper et al. 2011) and in the cingulate (Cysique et al. 2013), supramarginal (Melrose et al. 2008), and temporal (Kuper et al. 2011) cortices. The recent study by Garvey et al., using [11C]R-PK11195 in neuro-asymptomatic HIV-infected subjects on effective antiretroviral therapy (N=7 vs. control: N= 9), reported voxel-based abnormalities in corpus callosum (the largest WM structure in the brain), anterior and posterior cingulate, temporal, and frontal locations (Garvey et al. 2013). These findings are in agreement with the results shown in Table 4, where asymptomatic HIV infected individuals (N= 8) and healthy controls (N=12) were compared, with the following differences: We uncovered regional differences explicitly correcting for FDR, and at q=10 % showed significant findings in the occipital but not in the frontal cortex. Lateral occipital cortex (LOC) network abnormality has been linked to early HIV infection (Wang et al. 2011). As also shown in Table 4, findings in the frontal cortex distinguished HAD from HIV-ND sub-cohorts at FDR q=5 %, in keeping with published studies supporting the involvement of frontal cortex in HAD as discussed above. The [11C]R-PK11195 HIV study employed cluster analysis (Turkheimer et al. 2007) to extract and identify (GM) voxels that mirrored distribution within a normal population (to serve as a reference region). This strategy of stratifying GM voxels was based on the assumptions that portions of GM have no specific tracer binding and can be used as reference tissue, and that physiological factors do not affect binding. However, these assumptions might be less valid in the case of second-generation TSPO radioligands. The reliability of cluster analysis may also be questioned for [11C]R-PK11195 (Jucaite et al. 2012), where high intra-subject variability was observed. These limitations, combined with the use of only a subset of GM voxels (assumed to be devoid of specific uptake) as the reference region in the context of cluster analysis, may have contributed to the inability of detecting regional differences in (Garvey et al. 2013). The simple GM normalization approach we propose, although empirical to a degree, has proved to be an effective method for analyzing [11C]DPA-713 PET data, and may be useful for other TSPO ligands.
Conclusions
By employing an empirical normalization approach we uncovered regional abnormalities in glial cell activation in the brains of HIV infected individuals that correlate with findings of previous neuroimaging studies. These abnormalities suggest ongoing neuroinflammation in WM, cingulum, and supramarginal cortex. Elevated [11C]DPA-713 uptake in frontal cortex was associated with HAD, also in keeping with prior studies. The GM normalization approach may obviate physiological factors that confound imaging with TSPO-targeted agents, provides findings that improve test–retest reproducibility and inter-subject regional outcome ICC within the healthy control cohort, and may be useful for extension to study of other diseased cohorts using second-generation radiotracers that target TSPO.
Supplementary Material
Acknowledgments
We acknowledge NIH 5R21MH082277, NIH 5R01MH092443, NIH R01EB012547, NIEHS ES007062, NIH 5T32EB006351, the Lupus Foundation for America and NFL Charities for financial support. We are also grateful to Alimamy Kargbo for performing PET metabolite analyses, to Dean Wong, M.D., Ph.D. for sharing his knowledge and ideas, and to the Johns Hopkins PET Center for provision of the radiotracer.
Support
NIH 5R21MH082277, NIH 5R01MH092443, NIH R01EB012547, NIH 5T32EB006351, NIEHS ES007062, Lupus Foundation of America, NFL Charities.
Abbreviations
- HAND
HIV-associated neurocognitive disorder
- HAD
HIV-associated dementia
- cART
Combination antiretroviral therapy
- TSPO
Translocator protein
- PET
Positron emission tomography
Footnotes
Electronic supplementary material The online version of this article (doi:10.1007/s13365-014-0239-5) contains supplementary material, which is available to authorized users.
Disclosure/Conflict of Interest: None.
Contributor Information
Jennifer M. Coughlin, Department of Psychiatry and Behavioral Sciences, Johns Hopkins Medical Institutions, Baltimore, MD, USA
Yuchuan Wang, Russell H. Morgan, Department of Radiology and Radiological Science, Johns Hopkins Medical Institutions, Baltimore, MD, USA.
Shuangchao Ma, Department of Health Sciences Informatics, Johns Hopkins Medical Institutions, Baltimore, MD, USA.
Chen Yue, Department of Biostatistics, Johns Hopkins Medical Institutions, Baltimore, MD, USA.
Pearl K. Kim, Department of Psychiatry and Behavioral Sciences, Johns Hopkins Medical Institutions, Baltimore, MD, USA
Ashley V. Adams, Department of Psychiatry and Behavioral Sciences, Johns Hopkins Medical Institutions, Baltimore, MD, USA
Heidi V. Roosa, Department of Neurology, Johns Hopkins Medical Institutions, Baltimore, MD, USA
Kenneth L. Gage, Russell H. Morgan, Department of Radiology and Radiological Science, Johns Hopkins Medical Institutions, Baltimore, MD, USA
Marigo Stathis, Brain Science Institute, Johns Hopkins Medical Institutions, Baltimore, MD, USA.
Rana Rais, Department of Neurology, Johns Hopkins Medical Institutions, Baltimore, MD, USA. Brain Science Institute, Johns Hopkins Medical Institutions, Baltimore, MD, USA.
Camilo Rojas, Brain Science Institute, Johns Hopkins Medical Institutions, Baltimore, MD, USA. Department of Molecular and Comparative Pathobiology, Baltimore, MD, USA.
Jennifer L. McGlothan, Department of Environmental Health Sciences, Columbia University, New York, NY, USA
Crystal C. Watkins, Department of Psychiatry and Behavioral Sciences, Johns Hopkins Medical Institutions, Baltimore, MD, USA
Ned Sacktor, Department of Neurology, Johns Hopkins Medical Institutions, Baltimore, MD, USA.
Tomas R. Guilarte, Department of Environmental Health Sciences, Columbia University, New York, NY, USA
Yun Zhou, Russell H. Morgan, Department of Radiology and Radiological Science, Johns Hopkins Medical Institutions, Baltimore, MD, USA.
Akira Sawa, Department of Psychiatry and Behavioral Sciences, Johns Hopkins Medical Institutions, Baltimore, MD, USA.
Barbara S. Slusher, Department of Neurology, Johns Hopkins Medical Institutions, Baltimore, MD, USA. Brain Science Institute, Johns Hopkins Medical Institutions, Baltimore, MD, USA
Brian Caffo, Department of Biostatistics, Johns Hopkins Medical Institutions, Baltimore, MD, USA.
Michael Kassiou, School of Chemistry, The University of Sydney, NSW 2006 Sydney, Australia. Discipline of Medical Radiation Sciences, The University of Sydney, NSW 2006 Sydney, Australia.
Christopher J. Endres, Russell H. Morgan, Department of Radiology and Radiological Science, Johns Hopkins Medical Institutions, Baltimore, MD, USA
Martin G. Pomper, Email: mpomper@jhmi.edu, Russell H. Morgan, Department of Radiology and Radiological Science, Johns Hopkins Medical Institutions, CRB II, Room 492, 1550 Orleans Street, Baltimore, MD 21231, USA. Johns Hopkins Medical Institutions, Baltimore, MD, USA
References
- Antinori A, Arendt G, Becker JT, Brew BJ, Byrd DA, Cherner M, Clifford DB, Cinque P, Epstein LG, Goodkin K, Gisslen M, Grant I, Heaton RK, Joseph J, Marder K, Marra CM, McArthur JC, Nunn M, Price RW, Pulliam L, Robertson KR, Sacktor N, Valcour V, Wojna VE. Updated research nosology for HIV-associated neurocognitive disorders. Neurology. 2007;69:1789–1799. doi: 10.1212/01.WNL.0000287431.88658.8b. [DOI] [PMC free article] [PubMed] [Google Scholar]
- Brown AK, Fujita M, Fujimura Y, Liow JS, Stabin M, Ryu YH, Imaizumi M, Hong J, Pike VW, Innis RB. Radiation dosimetry and biodistribution in monkey and man of 11C-PBR28: a PET radioligand to image inflammation. J NuclMed: Off Publ, Soc Nucl Med. 2007;48:2072–2079. doi: 10.2967/jnumed.107.044842. [DOI] [PubMed] [Google Scholar]
- Chauveau F, Boutin H, Van Camp N, Dolle F, Tavitian B. Nuclear imaging of neuroinflammation: a comprehensive review of [11C]PK11195 challengers. Eur J Nucl Med Mol Imag. 2008;35:2304–2319. doi: 10.1007/s00259-008-0908-9. [DOI] [PubMed] [Google Scholar]
- Chauveau F, Van Camp N, Dolle F, Kuhnast B, Hinnen F, Damont A, Boutin H, James M, Kassiou M, Tavitian B. Comparative evaluation of the translocator protein radioligands 11C-DPA-713, 18F-DPA-714, and 11C-PK11195 in a rat model of acute neuroinflammation. J Nucl Med: Off Publ, Soc Nucl Med. 2009;50:468–476. doi: 10.2967/jnumed.108.058669. [DOI] [PubMed] [Google Scholar]
- Chen Y, An H, Zhu H, Stone T, Smith JK, Hall C, Bullitt E, Shen D, Lin W. White matter abnormalities revealed by diffusion tensor imaging in non-demented and demented HIV + patients. NeuroImage. 2009;47:1154–1162. doi: 10.1016/j.neuroimage.2009.04.030. [DOI] [PMC free article] [PubMed] [Google Scholar]
- Chiang MC, Dutton RA, Hayashi KM, Lopez OL, Aizenstein HJ, Toga AW, Becker JT, Thompson PM. 3D pattern of brain atrophy in HIV/AIDS visualized using tensor-based morphometry. NeuroImage. 2007;34:44–60. doi: 10.1016/j.neuroimage.2006.08.030. [DOI] [PMC free article] [PubMed] [Google Scholar]
- Churchill M, Nath A. Where does HIV hide? A focus on the central nervous system. Curr Opin HIV and AIDS. 2013;8:165–169. doi: 10.1097/COH.0b013e32835fc601. [DOI] [PMC free article] [PubMed] [Google Scholar]
- Cysique LA, Moffat K, Moore DM, Lane TA, Davies NW, Carr A, Brew BJ, Rae C. HIV, vascular and aging injuries in the brain of clinically stable HIV-infected adults: a (1)H MRS study. PloS one. 2013;8:e61738. doi: 10.1371/journal.pone.0061738. [DOI] [PMC free article] [PubMed] [Google Scholar]
- Doorduin J, de Vries EF, Willemsen AT, de Groot JC, Dierckx RA, Klein HC. Neuroinflammation in schizophrenia-related psychosis: a PET study. J Nucl Med: Off Publ, Soc Nucl Med. 2009;50:1801–1807. doi: 10.2967/jnumed.109.066647. [DOI] [PubMed] [Google Scholar]
- Drugan RC. Peripheral benzodiazepine receptors: molecular pharmacology to possible physiological significance in stress-induced hypertension. Clin Neuropharmacol. 1996;19:475–496. doi: 10.1097/00002826-199619060-00002. [DOI] [PubMed] [Google Scholar]
- Endres CJ, Coughlin JM, Gage KL, Watkins CC, Kassiou M, Pomper MG. Radiation dosimetry and biodistribution of the TSPO ligand 11C-DPA-713 in humans. J Nucl Med: Off Publ, Soc Nucl Med. 2012;53:330–335. doi: 10.2967/jnumed.111.094565. [DOI] [PMC free article] [PubMed] [Google Scholar]
- Endres CJ, Pomper MG, James M, Uzuner O, Hammoud DA, Watkins CC, Reynolds A, Hilton J, Dannals RF, Kassiou M. Initial evaluation of 11C-DPA-713, a novel TSPO PET ligand, in humans. J Nucl Med: Off Publ, Soc Nucl Med. 2009;50:1276–1282. doi: 10.2967/jnumed.109.062265. [DOI] [PMC free article] [PubMed] [Google Scholar]
- Garvey LJ, Pavese N, Politis M, Ramlackhansingh A, Brooks DJ, Taylor-Robinson SD, Winston A. Increased microglia activation in neurologically asymptomatic HIV-infected patients receiving effective ART; An 11C–PK11195 PET study. Aids. 2013 doi: 10.1097/01.aids.0000432467.54003.f7. [DOI] [PubMed] [Google Scholar]
- Gavish M, Bachman I, Shoukrun R, Katz Y, Veenman L, Weisinger G, Weizman A. Enigma of the peripheral benzodiazepine receptor. Pharmacol Rev. 1999;51:629–650. [PubMed] [Google Scholar]
- Hammoud DA, Endres CJ, Chander AR, Guilarte TR, Wong DF, Sacktor NC, McArthur JC, Pomper MG. Imaging glial cell activation with [11C]-R-PK11195 in patients with AIDS. J Neurovirol. 2005;11:346–355. doi: 10.1080/13550280500187351. [DOI] [PubMed] [Google Scholar]
- Heaton RK, Franklin DR, Ellis RJ, McCutchan JA, Letendre SL, Leblanc S, Corkran SH, Duarte NA, Clifford DB, Woods SP, Collier AC, Marra CM, Morgello S, Mindt MR, Taylor MJ, Marcotte TD, Atkinson JH, Wolfson T, Gelman BB, McArthur JC, Simpson DM, Abramson I, Gamst A, Fennema-Notestine C, Jernigan TL, Wong J, Grant I, Group C, Group H. HIV-associated neurocognitive disorders before and during the era of combination antiretroviral therapy: differences in rates, nature, and predictors. J Neurovirol. 2011;17:3–16. doi: 10.1007/s13365-010-0006-1. [DOI] [PMC free article] [PubMed] [Google Scholar]
- Jucaite A, Cselenyi Z, Arvidsson A, Ahlberg G, Julin P, Varnas K, Stenkrona P, Andersson J, Halldin C, Farde L. Kinetic analysis and test-retest variability of the radioligand [11C](R)-PK11195 binding to TSPO in the human brain—a PET study in control subjects. EJNMMI Res. 2012;2:15. doi: 10.1186/2191-219X-2-15. [DOI] [PMC free article] [PubMed] [Google Scholar]
- Kaul M, Garden GA, Lipton SA. Pathways to neuronal injury and apoptosis in HIV-associated dementia. Nature. 2001;410:988–994. doi: 10.1038/35073667. [DOI] [PubMed] [Google Scholar]
- Kreisl WC, Jenko KJ, Hines CS, Hyoung Lyoo C, Corona W, Morse CL, Zoghbi SS, Hyde T, Kleinman JE, Pike VW, McMahon FJ, Innis RB Biomarkers Consortium PETRPT. A genetic polymorphism for translocator protein 18 kDa affects both in vitro and in vivo radioligand binding in human brain to this putative biomarker of neuroinflammation. J Cereb Blood Flow Metab: Off J Int Soc Cereb Blood Flow Metab. 2013a;33:53–58. doi: 10.1038/jcbfm.2012.131. [DOI] [PMC free article] [PubMed] [Google Scholar]
- Kreisl WC, Lyoo CH, McGwier M, Snow J, Jenko KJ, Kimura N, Corona W, Morse CL, Zoghbi SS, Pike VW, McMahon FJ, Turner RS, Innis RB Biomarkers Consortium PETRPT. In vivo radioligand binding to translocator protein correlates with severity of Alzheimer’s disease. Brain: J Neurol. 2013b;136:2228–2238. doi: 10.1093/brain/awt145. [DOI] [PMC free article] [PubMed] [Google Scholar]
- Kuper M, Rabe K, Esser S, Gizewski ER, Husstedt IW, Maschke M, Obermann M. Structural gray and white matter changes in patients with HIV. J Neurol. 2011;258:1066–1075. doi: 10.1007/s00415-010-5883-y. [DOI] [PubMed] [Google Scholar]
- Lopez-Villegas D, Lenkinski RE, Frank I. Biochemical changes in the frontal lobe of HIV-infected individuals detected by magnetic resonance spectroscopy. Proc Natl Acad Sci U S A. 1997;94:9854–9859. doi: 10.1073/pnas.94.18.9854. [DOI] [PMC free article] [PubMed] [Google Scholar]
- Marder K, Albert SM, McDermott MP, McArthur JC, Schifitto G, Selnes OA, Sacktor N, Stern Y, Palumbo D, Kieburtz K, Cohen B, Orme C, Epstein LG. Inter-rater reliability of a clinical staging of HIV-associated cognitive impairment. Neurology. 2003;60:1467–1473. doi: 10.1212/01.wnl.0000064172.46685.82. [DOI] [PubMed] [Google Scholar]
- Melrose RJ, Tinaz S, Castelo JM, Courtney MG, Stern CE. Compromised fronto-striatal functioning in HIV: an fMRI investigation of semantic event sequencing. Behav Brain Res. 2008;188:337–347. doi: 10.1016/j.bbr.2007.11.021. [DOI] [PubMed] [Google Scholar]
- Mizrahi R, Rusjan PM, Kennedy J, Pollock B, Mulsant B, Suridjan I, De Luca V, Wilson AA, Houle S. Translocator protein (18 kDa) polymorphism (rs6971) explains in-vivo brain binding affinity of the PET radioligand [(18)F]-FEPPA. J Cereb Blood Flow Metab: Off J Int Soc Cereb Blood Flow Metab. 2012;32:968–972. doi: 10.1038/jcbfm.2012.46. [DOI] [PMC free article] [PubMed] [Google Scholar]
- Mohamed MA, Lentz MR, Lee V, Halpern EF, Sacktor N, Selnes O, Barker PB, Pomper MG. Factor analysis of proton MR spectroscopic imaging data in HIV infection: metabolite-derived factors help identify infection and dementia. Radiology. 2010;254:577–586. doi: 10.1148/radiol.09081867. [DOI] [PMC free article] [PubMed] [Google Scholar]
- Owen DR, Gunn RN, Rabiner EA, Bennacef I, Fujita M, Kreisl WC, Innis RB, Pike VW, Reynolds R, Matthews PM, Parker CA. Mixed-affinity binding in humans with 18-kDa translocator protein ligands. J Nucl Med: Off Publ, Soc Nucl Med. 2011;52:24–32. doi: 10.2967/jnumed.110.079459. [DOI] [PMC free article] [PubMed] [Google Scholar]
- Owen DR, Yeo AJ, Gunn RN, Song K, Wadsworth G, Lewis A, Rhodes C, Pulford DJ, Bennacef I, Parker CA, StJean PL, Cardon LR, Mooser VE, Matthews PM, Rabiner EA, Rubio JP. An 18-kDa translocator protein (TSPO) polymorphism explains differences in binding affinity of the PET radioligand PBR28. J Cereb Blood Flow Metab: Off J Int Soc Cereb Blood Flow Metab. 2012;32:1–5. doi: 10.1038/jcbfm.2011.147. [DOI] [PMC free article] [PubMed] [Google Scholar]
- Papadopoulos V, Baraldi M, Guilarte TR, Knudsen TB, Lacapere JJ, Lindemann P, Norenberg MD, Nutt D, Weizman A, Zhang MR, Gavish M. Translocator protein (18kDa): new nomenclature for the peripheral-type benzodiazepine receptor based on its structure and molecular function. Trend Pharmacol Sci. 2006;27:402–409. doi: 10.1016/j.tips.2006.06.005. [DOI] [PubMed] [Google Scholar]
- Rahmim A, Lenox M, Reader AJ, Michel C, Burbar Z, Ruth TJ, Sossi V. Statistical list-mode image reconstruction for the high resolution research tomograph. Phys Med Biol. 2004;49:4239–4258. doi: 10.1088/0031-9155/49/18/004. [DOI] [PubMed] [Google Scholar]
- Roberts ES, Chana G, Nguyen TB, Perera G, Landau S, Rabe-Hesketh S, Glass JD, McArthur J, Everall IP. The spatial relationship between neurons and astrocytes in HIV-associated dementia. J Neurovirol. 2013;19:123–130. doi: 10.1007/s13365-013-0149-y. [DOI] [PubMed] [Google Scholar]
- Rusjan PM, Wilson AA, Bloomfield PM, Vitcu I, Meyer JH, Houle S, Mizrahi R. Quantitation of translocator protein binding in human brain with the novel radioligand [18F]-FEPPA and positron emission tomography. J Cereb Blood Flow Metab: Off J Int Soc Cereb Blood Flow Metab. 2011;31:1807–1816. doi: 10.1038/jcbfm.2011.55. [DOI] [PMC free article] [PubMed] [Google Scholar]
- Spudich S. HIV and Neurocognitive Dysfunction. Curr HIV/AIDS Report. 2013;10:235–243. doi: 10.1007/s11904-013-0171-y. [DOI] [PMC free article] [PubMed] [Google Scholar]
- Turkheimer FE, Edison P, Pavese N, Roncaroli F, Anderson AN, Hammers A, Gerhard A, Hinz R, Tai YF, Brooks DJ. Reference and target region modeling of [11C]-(R)-PK11195 brain studies. J Nucl Med: Off Publ, Soc Nucl Med. 2007;48:158–167. [PubMed] [Google Scholar]
- Venneti S, Lopresti BJ, Wiley CA. The peripheral benzodiazepine receptor (Translocator protein 18kDa) in microglia: from pathology to imaging. Prog Neurobiol. 2006;80:308–322. doi: 10.1016/j.pneurobio.2006.10.002. [DOI] [PMC free article] [PubMed] [Google Scholar]
- Wang X, Foryt P, Ochs R, Chung JH, Wu Y, Parrish T, Ragin AB. Abnormalities in resting-state functional connectivity in early human immunodeficiency virus infection. Brain Connect. 2011;1:207–217. doi: 10.1089/brain.2011.0016. [DOI] [PMC free article] [PubMed] [Google Scholar]
- Wiley CA, Lopresti BJ, Becker JT, Boada F, Lopez OL, Mellors J, Meltzer CC, Wisniewski SR, Mathis CA. Positron emission tomography imaging of peripheral benzodiazepine receptor binding in human immunodeficiency virus-infected subjects with and without cognitive impairment. J Neurovirol. 2006;12:262–271. doi: 10.1080/13550280600873868. [DOI] [PubMed] [Google Scholar]
- Zhang Y, Wang M, Li H, Zhang H, Shi Y, Wei F, Liu D, Liu K, Chen D. Accumulation of nuclear and mitochondrial DNA damage in the frontal cortex cells of patients with HIV-associated neurocognitive disorders. Brain Res. 2012;1458:1–11. doi: 10.1016/j.brainres.2012.04.001. [DOI] [PubMed] [Google Scholar]
Associated Data
This section collects any data citations, data availability statements, or supplementary materials included in this article.