

Introduction
There are increasing concerns that excess consumption of sugars may lead to metabolic and cardiovascular pathologies. The seriousness of the issue is seen in the position statement put forth by the American Heart Association which recommends a significant reduction in intake of sugars 1. Indeed, an extensive clinical study in young adults showed that consumption of sugar sweetened beverages was associated with higher waist circumference, lipids and blood pressure 2. Consumption of more than one sugar-containing beverage per day resulted in a marked increase in the prevalence of diabetes and hypertension 3,3,4.
An issue of importance is the amount of sugars consumed and the relationship with morbidity. Longitudinal epidemiological data show record levels of consumption of soft drinks, which are largely sweetened with high fructose corn syrup (HFCS, 55% fructose). In children and adolescents, the proportion of daily energy intake provided by soft drinks increased more than 80% in 20 years 5. This and other epidemiological studies has led to the supposition that high dietary fructose intake is correlated with metabolic and cardiovascular disease 6-9. Direct experimental tests of fructose loading in animals and humans show that fructose consumption increases blood pressure and triglycerides and alters insulin levels 10-14.
Circadian factors in nutritionally based diseases are also an important consideration. There is evidence to support the idea that a reversal in the eating and activity patterns causes increase in body weight, increased blood pressure and insulin resistance. In humans, this is seen in the pathologies associated with shift work, such as, diabetes, weight gain, hypertension, coronary artery disease and other maladies 15-18. Even a short term alteration in the day/night rhythms, as would occur with jet lag, produced an increase in blood pressure and metabolic derangements 19. There are also associations among circadian rhythms, CLOCK genes and the regulation of metabolic function. Mice lacking the CLOCK gene showed a diabetic syndrome, obesity, hyperlipidaemia, hyperleptinemia, hyperglycaemia and hypoinsulinemia 20. When the feeding schedule is altered, either in animals or humans, there are consequential changes in metabolic and endocrine parameters 21-25. In humans, this is seen in the “night time eating” syndrome”, which is associated with weight gain and depression even though total calories consumed were similar to controls 25,26. In mice, consumption of a high fat diet during the light, inactive period resulted in a greater increase in body weight, even though there were no significant difference in calories or activity 21. Likewise, a change in the light cycle, exposure to light during the normally dark phase, resulted in a syndrome of obesity and insulin resistance 27. Leptin levels were also increased when animals were forced to eat during the light period 22.
In view of the fact that fructose consumption and altered feeding schedules cause similar pathologies as related to adiposity and metabolism, we designed a protocol in which both risk factors are combined. The hypothesis is that fructose given during the light period would accentuate the gain in body fat, produce insulin resistance and alter metabolic hormones.
Methods
Experimental protocols were approved by the Wright State University Laboratory Animal Care and Use Committee (Dayton, OH). All animal procedures were conducted in accordance with the National Institutes of Health standards.
Animals and General Procedures
C57BL/6 male mice with initial body weights of 22-24 g (Harlan Inc., Indianapolis, IN) were housed individually at 22°C with 12 hr light (270 Lux) and 12 hr dark. Z0 (Zeitgeber) = 0700 h and Z12 = 1900h. Mice had ad libitum access to fluid (10% fructose or water) and standard mouse chow (58% CHO, 30% PRO, and 12% FAT). Animals were assigned randomly to one of three groups: 1) Control (C): 24 h of water access (n=10); 2) Fructose Light (FL): 12h 10% fructose (Fisher Scientific, Pittsburgh, PA) during the light period and 12h water during the dark period (n=11); 3) Fructose Dark (FD): 12h 10% fructose during the dark period and 12h water during the light period (n=11). Figure 1 provides a diagram of the experimental protocol including the times of interventions. Fructose/water intake (12 or 24h), chow consumption (24 hr), body weight, body fat were evaluated at wk 2 and 6. Total caloric intake was determined by calculating the combined intake of liquid fructose and chow (wk 2 and 6). Measurements were made over a 2 day period with the 12 or 24 hr average used for comparison. The amount of chow consumed was less accurate than liquid measurements since the food pellets sometimes disintegrate. This is seen in the variation of the intake results (Table 3). A glucose tolerance test was performed at wk 7. Mice were euthanatized by decapitation at wk 8 (after an 8h fast). The time of termination was 0900 - 1100h (Z2 – Z4). Blood and epididymal white adipose tissue (WAT) were collected for analyses. Blood samples were centrifuged and plasma was separated and stored at -80° C. WAT was fixed and embedded in paraffin for histological analysis.
Figure 1.

Schedule of general procedures. Week 1, male mice began the dietary challenge with fructose (10%) given during either the 12 hr light (0700h -1900h) or 12hr dark period (1900h-0700h). At weeks 2 and 6, body composition (body weight and body fat), fluid intake and chow comsumption were evaluated ( n = 9-11/group). Glucose tolerance test (GTT) was performed at week 7. At week 8, animals were euthanatized for tissue and plasma collection for measurement of adipocyte size and metabolic related plasma analytes.
Table 3.
Caloric intake in Control, FL and FD at 2 and 6 wk
| Chow (kcal/24 h) | Fructose (kcal/12 h) | Total (kcal/24 h) | ||||
|---|---|---|---|---|---|---|
| Groups | 2 wk | 6 wk | 2 wk | 6 wk | 2 wk | 6 wk |
| Control | 16 ± 0.3 | 16 ± 0.3 | ..... | ..... | 16 ± 0.3 | 16 ± 0.3 |
| FL | 15 ± 0.5 | 16 ± 1.7 | 4 ± 0.2 | 3 ± 0.2 | 19 ± 1.0 | 19 ± 2.0 |
| FD | 23 ± 0.6 | 12 ± 0.3 | 5 ± 0.4 | 6 ± 0.2 | 28 ± 1.0 | 18 ± 2.0 |
Control: Water (24 h), n=10; FL: Fructose during 12 h light period, n=11; FD: Fructose during 12h dark period, n=9-11. Values are mean ± SEM. Repeated 2-way ANOVA showed no significant differences among groups. CV: Coefficient Variation (%)
Body Fat Measurements
Body fat was measured using EchoMRI (Echo Medical Systems EchoMRI™, Houston, TX). For the test, a conscious mouse was placed in a clear plastic cylindrical holder (4.7 cm diameter). The holder was placed in the MRI machine and the animal was scanned, a two min procedure.
Glucose Tolerance Testing (GTT)
Mice were fasted for 8 hr before GTT. Animals were injected intraperitoneally with a sterile glucose solution (1.5 mg/g, ~ .8 ml). Blood samples (~50ul) were taken from a small tail cut at 0, 15, 30, 60, 90 and 120 min after injection. Glucose (mg/dl) was determined using a portable glucometer (ACCU-CHEK, Roche Diagnostics, Indianapolis, IN). Data were calculated as area under the curve.
Plasma Hormones, Glucose and Lipid Profile
Adiponectin, leptin, insulin, glucose, total cholesterol and triglycerides were measured in a fasted state (8 hr fast, wk 8). Tests were performed by the University of Cincinnati Mouse Metabolic Phenotyping Center (MMPC, Cincinnati, OH). Adiponectin concentrations were determined by ELISA. Glucose, cholesterol, and triglyceride were measured using specific colorimetric assays. Plasma insulin and leptin were determined using the Luminex fluorescent bead system (Bio-Rad Lab, Hercules, CA).
Histological Evaluation of White Adipose Tissue
Epididymal WAT was fixed in 4% paraformaldehyde. Paraffin embedded tissues were sectioned (4 μm) and stained with hematoxylin & eosin (AML Laboratories Inc., Rosedale, MD). Tissues were examined microscopically and fat cell size was measured using a computerized imaging system (Metamorph® 7.6, Molecular Devices Inc., Sunnydale, CA). Four tissue sections from each animal were used for analysis with two digital images made of each section. Images (24-bit TIF files) were used for computer processing. For each image, the number and area of the cells were measured in a defined region. Broken cells or damaged areas were removed from the quantification.
Statistical Analysis
Data were analyzed using Statistica 7.0 (StatSoft, Tulsa, OK). Data are reported as mean ± SEM. Statistical significance was analyzed by one, two-way, or repeated measures of variance (ANOVA) followed by the Tukey's post-hoc test. The significance level was established at p<0.05.
Results
Body Weight, Body Fat and Adipocyte Size
Body weight increased significantly over the 6 wk time course (Figure 2a, time effect of p<0.0001 without significant group effect). Concomitant changes in body fat were observed over time (p<0.0001) with evidence of group effect (p<0.05) and time/group interactions (p<0.02) (Figure 2b). There was no significant change in body fat in Controls. FL mice showed an enhanced response to fructose consumption (2.6 and 1.5 fold higher than Control and FD, respectively). Fructose consumption also caused a change in WAT cell size (group effect, p<0.03) (Figure 3). Adipocytes were significantly larger in the FL group when compared to Control (p<0.05).
Figure 2.

Body Weight, Body Fat and Adipocyte Size Body weight increased significantly over the 6 wk time course (Figure 2a, time effect of p<0.0001 without significant group effect). Concomitant changes in body fat were observed over time (p<0.0001) with evidence of group effect (p<0.05) and time/group interactions (p<0.02) (Figure 2b). There was no significant change in body fat in Controls. FL mice showed an enhanced response to fructose consumption (2.6 and 1.5 fold higher than Control and FD, respectively).
Figure 3.
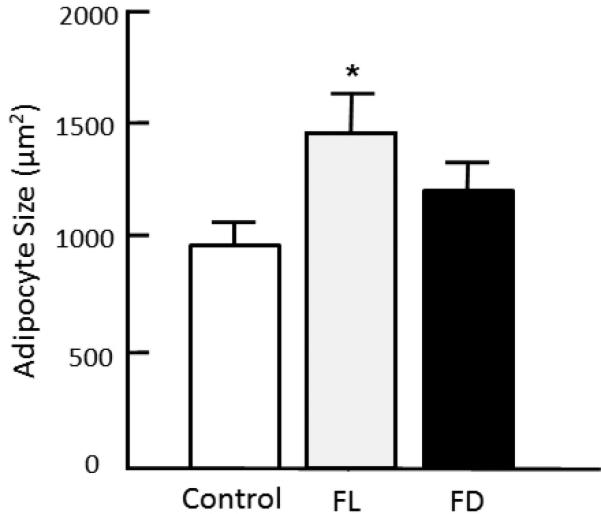
Cell size in white epididymal fat. Fixed, H&E stained tissue was examined using light microscopy and image analysis. Data show mean ± SEM. Control: Water; Fructose Light: Water during dark and fructose during light; Fructose Dark: Water during light and fructose during dark. ANOVA showed a group effect [F(2,18) = 3.80, p<0.042]. *p<0.05, Fructose Light vs. Control.
Insulin, Leptin, Adiponectin, Glucose, Glucose Tolerance and Lipids
Plasma levels of triglycerides, cholesterol, adiponectin and glucose were analyzed in fasted mice (wk 8, Table 1). There were no significant differences in any of the parameters. There were significant increases in plasma insulin and leptin in FL as compared to FD (Figure 4), providing evidence for metabolic dysfunction in mice consuming fructose during the light period.
Table 1.
Measurement of glucose tolerance test (GTT) and plasma levels of glucose, adiponectin, triglycerides, and cholesterol
| Parameter | Control (n=10) | Groups† FL (n=11) | FD (n=11) |
|---|---|---|---|
| GTT (AUC/min) | 204 ± 8.6 | 192 ± 7.4 | 187 ± 7.5 |
| Glucose (mg/dL) | 157 ± 23.6 | 139 ± 22.0 | 154 ± 21.0 |
| Adiponectin (μg/mL) | 12 ± 1.8 | 11 ± 2.4 | 11 ± 2.1 |
| Triglycerides (mg/dL) | 77 ± 9.3 | 89 ± 12.0 | 63 ± 5.3 |
| Cholesterol (mg/dL) | 83 ± 6.3 | 93 ± 8.0 | 90 ± 5.5 |
CONTROL: Water (24h); Fructose Light (FL): Fructose during 12h light period; Fructose Dark (FD): Fructose during 12h dark period. There were no significant differences among groups for any variable at 8 wk. Values are expressed as mean ±SEM.
Figure 4.
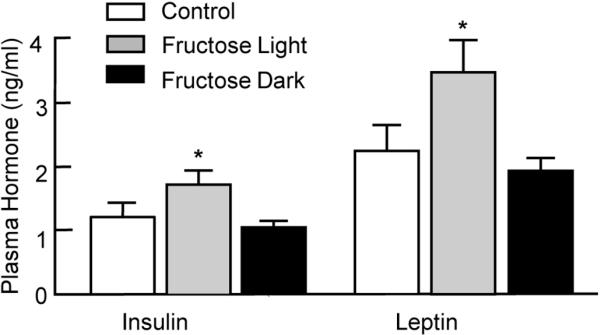
Insulin, Leptin, Adiponectin, Glucose, Glucose Tolerance and Lipids Plasma levels of triglycerides, cholesterol, adiponectin and glucose were analyzed in fasted mice (wk 8, Table 1). There were no significant differences in any of the parameters. There were significant increases in plasma insulin and leptin in FL as compared to FD (Figure 4), providing evidence for metabolic dysfunction in mice consuming fructose during the light period.
Fluid and Caloric Intake
In addition to regular chow, a 10% fructose solution provided added calories with a concomitant increase in fluid intake and total calories (Tables 2 & 3). Repeated 2-way ANOVA for liquid fructose consumption was significant for time (p<0.001) and group (p<0.002). In general, FD animals consumed more fructose than Control or FL (almost two fold higher in FD as compared to FL at wk 6). Total fluid intake was significantly greater in FD and FL than Control, but not different from each other. Overall there were no differences in total caloric intake over the experimental period (Table 3).
Table 2.
Fluid intake in Control, FL and FD at 2 and 6 wk
| Water 24h or 12h (ml) | Fructose 12h (ml) | Total Fluid Intake 24h (ml) | ||||
|---|---|---|---|---|---|---|
| 2 wk | 6 wk | 2 wk | 6 wk | 2 wk | 6 wk | |
| Control | 13 ± 0.8 | 14 ± 0.3 | ..... | ..... | 13 ± 0.8 | 14 ± 0.3† |
| FL | 6 ± 0.5 | 8 ± 0.3 | 11 ± 0.5 | 13 ± 0.4 | 16 ± 0.8 | 19 ± 1.4† |
| FD | 9 ± 0.6 | 7 ± 0.7 | 13 ± 1.0 | 19 ± 0.8** | 22 ± 1.3‡ | 26 ± 1.0 |
Control: Water (24 h), n=10; FL: Fructose during 12 h light period, n=9-11; FD: Fructose during 12 h dark period, n=9-11. Values are mean ± SEM. Repeated 2-way ANOVA for fructose intake was significant over time ([F(1,17) = 61.07, p<0.0001] and time/group [F(1,17) = 12.82, p<0.002]. Total fluid intake was significant for time [F(1,24) = 17.05, p<0.0004] and group [F(2,24) = 71.00, p<0.0001]
p<0.001 vs FL 6 wk
p<0.01 vs. FD 6 wk
p<0.01 vs. Control and FL 2 wk
Discussion
The epidemic of obesity and diabetes, which is occurring in industrialized and developing nations, is likely to end in a worldwide public health crisis. There is evidence which associates consumption of high levels of sugars with insulin resistance, obesity, and cardiovascular and lipid abnormalities, symptoms which are also observed in persons with type 2 diabetes 9,11,28-30. In the present study, we tested the hypothesis that the time period (day or night) of fructose consumption could influence adiposity and endocrine and metabolic parameters. The idea was based on clinical studies, which showed that the “night time eating syndrome” produced adiposity without alterations in total caloric consumption 25,26. Confirming our hypothesis, we observed that light phase consumption of fructose (inactive period for mice) produced a marked increase in body fat and white adipose cell size as well as alterations in circulating leptin and insulin.
Circadian rhythms play an important role in cardiovascular disease, obesity, and diabetes. It is well established that shift-work is associated with increased cardiovascular morbidity/mortality, obesity, and diabetes 16,17,31,32. Experimentally-induced misalignment in the sleep/wake cycle in humans produced an increase in blood pressure along with metabolic changes, indicative of insulin resistance 19. Likewise, in hamsters subjected to a reversed light/dark cycle, there was a reduction in survival in animals subjected to experimentally induced heart failure 33. We reported that there are day/night variations in stress-induced pressor responses with peak changes occurring during the light phase 34. Using radiotelemetry for chronic blood pressure monitoring in mice, we found that there was a light/dark pattern in the hypertensive response to a high fructose diet 11. When fructose was given in the drinking water only during the light phase, there was an absence in the light/dark blood pressure rhythm 35. Changes in circadian patterns are also associated with the risk of cardiovascular pathologies in humans; the peak period for heart attacks and strokes is seen in the early waking hours 36,37.
There is much information on the pathological effects of a high fructose intake in experimental models. For example, fructose produced high levels of plasma insulin, glucose, cholesterol and triglycerides in rats 38-41. Mice demonstrate similar scenarios indicative of a model of insulin resistance, that is, obesity, high blood pressure and vascular dysfunction 11,13,42-44. A diet which combined fructose with fat produced a profound syndrome with pathologies seen in multiple organ systems 45. We showed that dietary and liquid fructose produced autonomic aberrations along with changes in brain expression of catecholaminergic and angiotensinergic markers 11,35. As mentioned previously, changes in sleeping or eating patterns may have detrimental effects on physiological function. This is seen in humans required to perform shift work or animals exposed to various experimental conditions, such as when food is provided during the “wrong” time of the daily life cycle. There is some evidence that daytime feeding in nocturnal rodents shifts circadian oscillations in peripheral organs such as liver, heart, adipose tissue and kidney 23,46. Adipose tissue is often altered in disease states and is tightly coupled to metabolic dysfunction. For example, night-shift workers, whose activity period is chronically reversed, show an increased prevalence of metabolic syndrome associated with increased body weight 15,47. Shift workers also consume diets high in sugar and carbohydrates, which may bear a relationship to the metabolic changes 48. Moreover, adipose tissue is a source for leptin and adiponectin, which display a circadian pattern 49. Our data provide new evidence that alteration in the time period of fructose consumption alters adiposity (total body fat) as well as white adipose cell size. This occurs when fructose access is restricted to the light period as compared to the dark, suggesting that the timing is critical in the response. It is important to note that the increase in body fat in the fructose light group occurred even though total caloric intake was similar among groups. The conclusions are mitigated by the fact that there was variation in the intake data, probably reflecting methodological issues. In the human syndrome of night time snacking, there is evidence of increased BMI and altered patterns of metabolic hormones without changes in total food intake 25,50. In a unique experimental model for shift work, rats were exposed to constant slow movement and provided food only during the light period 51. The result was obesity and loss of blood glucose rhythms. Likewise, Arble et al. reported that a high fat diet given during the light period resulted in greater weight gain in mice 21. There was no difference in body fat or activity patterns. Evidence for a role of light/dark cycle in modulating weight gain was seen in mice exposed to dim light during the dark period 27. The light exposed mice gained more weight and showed glucose intolerance, a pattern similar to that seen in our experiments which tested the effect of light restricted fructose access.
An important and unique facet of the present study is that animals had time-limited access to fructose. Most studies use models in which fructose is provided continuously. Our results show that there are significant differences in the response, dependent on whether the sugar is provided during the active/waking or inactive/sleeping period. Mice given fructose during the light period show insulin resistance as determined by high insulin and leptin levels as well as enhanced adiposity. An association between high-fructose intake and metabolic alterations such as impairment of glucose tolerance and hyperinsulinemia was recognized in other studies 52,53. Our data are in accordance with the idea that fructose-induced insulin resistance is closely associated with lipid deposition. Indeed, we found specific time induced effects, high body fat as measured using non-invasive Echo-MRI and increased size of white adipocytes. The changes developed with time on the diet; significant differences were noted at 6 weeks between the FL and FD groups. Fructose fed rats also showed increased epididymal fat and cell size in association with high insulin and reduced sensitivity 14. Numerous studies have linked high lipids, triglycerides and cholesterol with fructose although no changes were seen in the present study using the limited access paradigm.
Experimental and clinical studies showed an association between obesity and elevated serum leptin, an adipocyte-derived hormone that plays an important role in regulation of feeding and energy expenditure 53. Circulating leptin concentrations are directly correlated with body adiposity 54 and exhibit a diurnal pattern 55-57. Moreover, there is a positive correlation between insulin and leptin. Leptin gene expression and leptin secretion are increased by insulin and insulin plays a role in the diurnal pattern of secretion 58,59. In our study, fructose intake during the light period was associated with higher leptin levels (samples taken during the morning hours), suggesting a model of leptin resistance. There are questions as to the precise relationship between the changes in the behavioral cycles induced by the feeding paradigms and the hormonal results. It would be important to expand the studies to provide detailed information on the time course and the relationship with the various cycles. Similar findings indicated that there was fructose induced leptin resistance which may provide a link between fructose intake and obesity 60.
The prevalence of obesity and diabetes is increasing rapidly in the human population and may be correlated with an increase in sugar (fructose) consumption. It is important to know that not only is the amount of fructose intake important, but also the timing. In a test of intake rhythms, we found that fructose taken during the light, inactive phase in mice has pathological consequences. This is seen as enhanced adiposity and high leptin and insulin. In conclusion, our results have clinical implications in control of adiposity deposition and metabolic syndrome that may contribute to increased cardiovascular risk.
SUMMARY.
Overconsumption of fructose produces glucose intolerance, autonomic abnormalities, and renal dysfunction and may be related to the worldwide epidemic of obesity and diabetes.
Experiments were conducted to determine whether the time period (light or dark) of fructose consumption influenced the pathological consequences. C57BL mice were given standard chow and assigned to one of three groups: Control (n=10, water 24h); FL (n=11, 10% fructose solution during 12h light period); and FD (n=11, 10% fructose solution during 12h dark period).
There was a time-related increase in body weight (BW) (p<0.0001). Body fat as measured with Echo-MRI showed a greater increase in the FL group as compared to Control and FD. The changes in adiposity occurred even though the total caloric intake was not significantly different among groups (~18 kcal/day). Total fluid (water plus fructose) consumption was greater in FD and FL than Controls at 6 wk. Significant increases were noted for plasma insulin and leptin with highest levels in FL as compared to FD (p<0.05). There were no significant changes in glucose, glucose tolerance, cholesterol, triglycerides or adiponectin.
Results suggest that there was a mismatch in caloric consumption, metabolism, and adiposity as related to the light/dark cycle of fructose consumption. These findings have clinical implications in the control of body weight, abdominal fat accumulation, and type 2 diabetes.
Acknowledgements
Financial support: MM, NIH HL093567, IAC and MC received fellowships from CAPES, Brazil, VAF, Fundação de Amparo a Pesquisa do Estado de São Paulo 09/52556-7; U.S.-Brazil Higher Education Consortia Program, U.S. Department of Education (Contents do not necessarily represent the policy of the U.S. Department of Education, and not endorsement by the Federal Government); Cincinnati MMPC U24 DK059630.
Footnotes
No conflicts of interest noted.
References
- 1.Johnson RK, Appel LJ, Brands M, et al. Dietary sugars intake and cardiovascular health: a scientific statement from the American Heart Association. Circulation. 2009;120:1011–20. doi: 10.1161/CIRCULATIONAHA.109.192627. [DOI] [PubMed] [Google Scholar]
- 2.Duffey KJ, Gordon-Larsen P, Steffen LM, Jacobs DR, Jr., Popkin BM. Drinking caloric beverages increases the risk of adverse cardiometabolic outcomes in the Coronary Artery Risk Development in Young Adults (CARDIA) Study. Am.J.Clin.Nutr. 2010;92:954–59. doi: 10.3945/ajcn.2010.29478. [DOI] [PMC free article] [PubMed] [Google Scholar]
- 3.Schulze MB, Manson JE, Ludwig DS, et al. Sugar-sweetened beverages, weight gain, and incidence of type 2 diabetes in young and middle-aged women. JAMA. 2004;292:927–34. doi: 10.1001/jama.292.8.927. [DOI] [PubMed] [Google Scholar]
- 4.Dhingra R, Sullivan L, Jacques PF, et al. Soft drink consumption and risk of developing cardiometabolic risk factors and the metabolic syndrome in middle-aged adults in the community. Circulation. 2007;116:480–88. doi: 10.1161/CIRCULATIONAHA.107.689935. [DOI] [PubMed] [Google Scholar]
- 5.Nielsen SJ, Siega-Riz AM, Popkin BM. Trends in energy intake in U.S. between 1977 and 1996: similar shifts seen across age groups. Obes.Res. 2002;10:370–78. doi: 10.1038/oby.2002.51. [DOI] [PubMed] [Google Scholar]
- 6.Bray GA, Bellanger T. Epidemiology, trends, and morbidities of obesity and the metabolic syndrome. Endocrine. 2006;29:109–17. doi: 10.1385/ENDO:29:1:109. [DOI] [PubMed] [Google Scholar]
- 7.Brown CM, Dulloo AG, Montani JP. Sugary drinks in the pathogenesis of obesity and cardiovascular diseases. Int.J Obes.(Lond) 2008;32(Suppl 6):S28–S34. doi: 10.1038/ijo.2008.204. [DOI] [PubMed] [Google Scholar]
- 8.Malik VS, Popkin BM, Bray GA, Despres JP, Hu FB. Sugar-sweetened beverages, obesity, type 2 diabetes mellitus, and cardiovascular disease risk. Circulation. 2010;121:1356–64. doi: 10.1161/CIRCULATIONAHA.109.876185. [DOI] [PMC free article] [PubMed] [Google Scholar]
- 9.Elliott SS, Keim NL, Stern JS, Teff K, Havel PJ. Fructose, weight gain, and the insulin resistance syndrome. Am.J.Clin.Nutr. 2002;76:911–22. doi: 10.1093/ajcn/76.5.911. [DOI] [PubMed] [Google Scholar]
- 10.Teff KL, Grudziak J, Townsend RR, et al. Endocrine and metabolic effects of consuming fructose- and glucose-sweetened beverages with meals in obese men and women: influence of insulin resistance on plasma triglyceride responses. J.Clin.Endocrinol.Metab. 2009;94:1562–69. doi: 10.1210/jc.2008-2192. [DOI] [PMC free article] [PubMed] [Google Scholar]
- 11.Farah V, Elased KM, Chen Y, et al. Nocturnal hypertension in mice consuming a high fructose diet. Autonomic Neuroscience: Basic and Clinical. 2006;130:41–50. doi: 10.1016/j.autneu.2006.05.006. [DOI] [PubMed] [Google Scholar]
- 12.Brown CM, Dulloo AG, Yepuri G, Montani JP. Fructose ingestion acutely elevates blood pressure in healthy young humans. Am.J.Physiol Regul.Integr.Comp Physiol. 2008;294:R730–R737. doi: 10.1152/ajpregu.00680.2007. [DOI] [PubMed] [Google Scholar]
- 13.Shinozaki K, Ayajiki K, Nishio Y, Sugaya T, Kashiwagi A, Okamura T. Evidence for a causal role of the renin-angiotensin system in vascular dysfunction associated with insulin resistance. Hypertension. 2004;43:255–62. doi: 10.1161/01.HYP.0000111136.86976.26. [DOI] [PubMed] [Google Scholar]
- 14.Furuhashi M, Ura N, Takizawa H, et al. Blockade of the renin-angiotensin system decreases adipocyte size with improvement in insulin sensitivity. J Hypertens. 2004;22:1977–82. doi: 10.1097/00004872-200410000-00021. [DOI] [PubMed] [Google Scholar]
- 15.Esquirol Y, Bongard V, Mabile L, Jonnier B, Soulat JM, Perret B. Shift work and metabolic syndrome: respective impacts of job strain, physical activity, and dietary rhythms. Chronobiol.Int. 2009;26:544–59. doi: 10.1080/07420520902821176. [DOI] [PubMed] [Google Scholar]
- 16.Morikawa Y, Nakagawa H, Miura K, et al. Effect of shift work on body mass index and metabolic parameters. Scand.J.Work Environ.Health. 2007;33:45–50. doi: 10.5271/sjweh.1063. [DOI] [PubMed] [Google Scholar]
- 17.Morikawa Y, Nakagawa H, Miura K, et al. Shift work and the risk of diabetes mellitus among Japanese male factory workers. Scand.J.Work Environ.Health. 2005;31:179–83. doi: 10.5271/sjweh.867. [DOI] [PubMed] [Google Scholar]
- 18.Knutsson A, Boggild H. Shiftwork and cardiovascular disease: review of disease mechanisms. Rev.Environ.Health. 2000;15:359–72. doi: 10.1515/reveh.2000.15.4.359. [DOI] [PubMed] [Google Scholar]
- 19.Scheer FA, Hilton MF, Mantzoros CS, Shea SA. Adverse metabolic and cardiovascular consequences of circadian misalignment. Proc.Natl.Acad.Sci.U.S.A. 2009;106:4453–58. doi: 10.1073/pnas.0808180106. [DOI] [PMC free article] [PubMed] [Google Scholar]
- 20.Turek FW, Joshu C, Kohsaka A, et al. Obesity and metabolic syndrome in circadian Clock mutant mice. Science. 2005;308:1043–45. doi: 10.1126/science.1108750. [DOI] [PMC free article] [PubMed] [Google Scholar]
- 21.Arble DM, Bass J, Laposky AD, Vitaterna MH, Turek FW. Circadian timing of food intake contributes to weight gain. Obesity. 2009;17:2100–02. doi: 10.1038/oby.2009.264. [DOI] [PMC free article] [PubMed] [Google Scholar]
- 22.Bodosi B, Gardi J, Hajdu I, Szentirmai E, Obal F, Jr., Krueger JM. Rhythms of ghrelin, leptin, and sleep in rats: effects of the normal diurnal cycle, restricted feeding, and sleep deprivation. Am.J.Physiol Regul.Integr.Comp Physiol. 2004;287:R1071–R1079. doi: 10.1152/ajpregu.00294.2004. [DOI] [PubMed] [Google Scholar]
- 23.Zvonic S, Ptitsyn AA, Conrad SA, et al. Characterization of peripheral circadian clocks in adipose tissues. Diabetes. 2006;55:962–70. doi: 10.2337/diabetes.55.04.06.db05-0873. [DOI] [PubMed] [Google Scholar]
- 24.Kudo T, Akiyama M, Kuriyama K, Sudo M, Moriya T, Shibata S. Night-time restricted feeding normalises clock genes and Pai-1 gene expression in the db/db mouse liver. Diabetologia. 2004;47:1425–36. doi: 10.1007/s00125-004-1461-0. [DOI] [PubMed] [Google Scholar]
- 25.Colles SL, Dixon JB, O'Brien PE. Night eating syndrome and nocturnal snacking: association with obesity, binge eating and psychological distress. Int.J.Obes.(Lond) 2007;31:1722–30. doi: 10.1038/sj.ijo.0803664. [DOI] [PubMed] [Google Scholar]
- 26.Allison KC, Ahima RS, O'Reardon JP, et al. Neuroendocrine profiles associated with energy intake, sleep, and stress in the night eating syndrome. J.Clin.Endocrinol.Metab. 2005;90:6214–17. doi: 10.1210/jc.2005-1018. [DOI] [PubMed] [Google Scholar]
- 27.Fonken LK, Workman JL, Walton JC, et al. Light at night increases body mass by shifting the time of food intake. Proc.Natl.Acad.Sci.U.S.A. 2010;107:18664–69. doi: 10.1073/pnas.1008734107. [DOI] [PMC free article] [PubMed] [Google Scholar]
- 28.Bray GA, Nielsen SJ, Popkin BM. Consumption of high-fructose corn syrup in beverages may play a role in the epidemic of obesity. Am.J.Clin Nutr. 2004;79:537–43. doi: 10.1093/ajcn/79.4.537. [DOI] [PubMed] [Google Scholar]
- 29.Basciano H, Federico L, Adeli K. Fructose, insulin resistance, and metabolic dyslipidemia. Nutr.Metab (Lond) 2005;2:5. doi: 10.1186/1743-7075-2-5. [DOI] [PMC free article] [PubMed] [Google Scholar]
- 30.Johnson RJ, Segal MS, Sautin Y, et al. Potential role of sugar (fructose) in the epidemic of hypertension, obesity and the metabolic syndrome, diabetes, kidney disease, and cardiovascular disease. Am.J Clin Nutr. 2007;86:899–906. doi: 10.1093/ajcn/86.4.899. [DOI] [PubMed] [Google Scholar]
- 31.Knutsson A, Akerstedt T, Jonsson BG. Prevalence of risk factors for coronary artery disease among day and shift workers. Scand.J.Work Environ.Health. 1988;14:317–21. doi: 10.5271/sjweh.1913. [DOI] [PubMed] [Google Scholar]
- 32.van Amelsvoort LG, Schouten EG, Kok FJ. Duration of shiftwork related to body mass index and waist to hip ratio. Int.J.Obes.Relat Metab Disord. 1999;23:973–78. doi: 10.1038/sj.ijo.0801028. [DOI] [PubMed] [Google Scholar]
- 33.Penev PD, Kolker DE, Zee PC, Turek FW. Chronic circadian desynchronization decreases the survival of animals with cardiomyopathic heart disease. Am.J Physiol. 1998;275:H2334–H2337. doi: 10.1152/ajpheart.1998.275.6.H2334. [DOI] [PubMed] [Google Scholar]
- 34.Bernatova I, Key MP, Lucot JB, Morris M. Circadian differences in stress-induced pressor reactivity in mice. Hypertension. 2002;40:768–73. doi: 10.1161/01.hyp.0000036405.27562.02. [DOI] [PubMed] [Google Scholar]
- 35.Senador D, Swapnil S, Irigoyen MC, Elased KM, Morris M. Restricted Fructose Access Accentuates Weight Gain and Abolishes Blood Pressure Circadian Rhythms. Experimental Diabetes Research. 2011 in press: [Google Scholar]
- 36.Muller JE. Circadian variation in cardiovascular events. Am.J Hypertens. 1999;12:35S–42S. doi: 10.1016/s0895-7061(98)00278-7. [DOI] [PubMed] [Google Scholar]
- 37.Elliott WJ. Circadian variation in the timing of stroke onset: a meta-analysis. Stroke. 1998;29:992–96. doi: 10.1161/01.str.29.5.992. [DOI] [PubMed] [Google Scholar]
- 38.Dai S, McNeill JH. Fructose-induced hypertension in rats is concentration- and duration-dependent. J.Pharmacol.Toxicol.Methods. 1995;33:101–07. doi: 10.1016/1056-8719(94)00063-a. [DOI] [PubMed] [Google Scholar]
- 39.Katovich MJ, Reaves PY, Francis SC, Pachori AS, Wang HW, Raizada MK. Gene therapy attenuates the elevated blood pressure and glucose intolerance in an insulin-resistant model of hypertension. J Hypertens. 2001;19:1553–58. doi: 10.1097/00004872-200109000-00006. [DOI] [PubMed] [Google Scholar]
- 40.Kamide K, Rakugi H, Higaki J, et al. The renin-angiotensin and adrenergic nervous system in cardiac hypertrophy in fructose-fed rats. Am.J Hypertens. 2002;15:66–71. doi: 10.1016/s0895-7061(01)02232-4. [DOI] [PubMed] [Google Scholar]
- 41.Hsieh PS. Reversal of fructose-induced hypertension and insulin resistance by chronic losartan treatment is independent of AT2 receptor activation in rats. J.Hypertens. 2005;23:2209–17. doi: 10.1097/01.hjh.0000189871.94031.e2. [DOI] [PubMed] [Google Scholar]
- 42.Farah V, Elased KM, Morris M. Genetic and dietary interactions: role of angiotensin AT1a receptors in response to a high-fructose diet. Am.J Physiol Heart Circ.Physiol. 2007;293:H1083–H1089. doi: 10.1152/ajpheart.00106.2006. [DOI] [PubMed] [Google Scholar]
- 43.Jurgens H, Haass W, Castaneda TR, et al. Consuming fructose-sweetened beverages increases body adiposity in mice. Obes.Res. 2005;13:1146–56. doi: 10.1038/oby.2005.136. [DOI] [PubMed] [Google Scholar]
- 44.Kamata K, Kanie N, Inose A. Mechanisms underlying attenuated contractile response of aortic rings to noradrenaline in fructose-fed mice. Eur.J Pharmacol. 2001;428:241–49. doi: 10.1016/s0014-2999(01)01262-6. [DOI] [PubMed] [Google Scholar]
- 45.Panchal SK, Poudyal H, Iyer A, et al. High-carbohydrate high-fat diet-induced metabolic syndrome and cardiovascular remodeling in rats. J.Cardiovasc.Pharmacol. 2011;57:51–64. doi: 10.1097/FJC.0b013e3181feb90a. [DOI] [PubMed] [Google Scholar]
- 46.Damiola F, Le MN, Preitner N, Kornmann B, Fleury-Olela F, Schibler U. Restricted feeding uncouples circadian oscillators in peripheral tissues from the central pacemaker in the suprachiasmatic nucleus. Genes Dev. 2000;14:2950–61. doi: 10.1101/gad.183500. [DOI] [PMC free article] [PubMed] [Google Scholar]
- 47.Holmback U, Forslund A, Lowden A, et al. Endocrine responses to nocturnal eating--possible implications for night work. Eur.J.Nutr. 2003;42:75–83. doi: 10.1007/s00394-003-0386-6. [DOI] [PubMed] [Google Scholar]
- 48.de Assis MA, Kupek E, Nahas MV, Bellisle F. Food intake and circadian rhythms in shift workers with a high workload. Appetite. 2003;40:175–83. doi: 10.1016/s0195-6663(02)00133-2. [DOI] [PubMed] [Google Scholar]
- 49.Gavrila A, Peng CK, Chan JL, Mietus JE, Goldberger AL, Mantzoros CS. Diurnal and ultradian dynamics of serum adiponectin in healthy men: comparison with leptin, circulating soluble leptin receptor, and cortisol patterns. J.Clin.Endocrinol.Metab. 2003;88:2838–43. doi: 10.1210/jc.2002-021721. [DOI] [PubMed] [Google Scholar]
- 50.Goel N, Stunkard AJ, Rogers NL, et al. Circadian rhythm profiles in women with night eating syndrome. J.Biol.Rhythms. 2009;24:85–94. doi: 10.1177/0748730408328914. [DOI] [PMC free article] [PubMed] [Google Scholar]
- 51.Salgado-Delgado R, ngeles-Castellanos M, Saderi N, Buijs RM, Escobar C. Food intake during the normal activity phase prevents obesity and circadian desynchrony in a rat model of night work. Endocrinology. 2010;151:1019–29. doi: 10.1210/en.2009-0864. [DOI] [PubMed] [Google Scholar]
- 52.Zavaroni I, Sander S, Scott S, Reaven GM. Effect of fructose feeding on insulin secretion and insulin action in the rat. Metabolism. 1980;29:970–73. doi: 10.1016/0026-0495(80)90041-4. [DOI] [PubMed] [Google Scholar]
- 53.Havel PJ. Dietary fructose: implications for dysregulation of energy homeostasis and lipid/carbohydrate metabolism. Nutr.Rev. 2005;63:133–57. doi: 10.1301/nr.2005.may.133-157. [DOI] [PubMed] [Google Scholar]
- 54.Maffei M, Halaas J, Ravussin E, et al. Leptin levels in human and rodent: measurement of plasma leptin and ob RNA in obese and weight-reduced subjects. Nat.Med. 1995;1:1155–61. doi: 10.1038/nm1195-1155. [DOI] [PubMed] [Google Scholar]
- 55.Ahren B. Diurnal variation in circulating leptin is dependent on gender, food intake and circulating insulin in mice. Acta Physiol Scand. 2000;169:325–31. doi: 10.1046/j.1365-201x.2000.00746.x. [DOI] [PubMed] [Google Scholar]
- 56.Saad MF, Riad-Gabriel MG, Khan A, et al. Diurnal and ultradian rhythmicity of plasma leptin: effects of gender and adiposity. J.Clin.Endocrinol.Metab. 1998;83:453–59. doi: 10.1210/jcem.83.2.4532. [DOI] [PubMed] [Google Scholar]
- 57.Teff KL, Elliott SS, Tschop M, et al. Dietary fructose reduces circulating insulin and leptin, attenuates postprandial suppression of ghrelin, and increases triglycerides in women. J.Clin.Endocrinol.Metab. 2004;89:2963–72. doi: 10.1210/jc.2003-031855. [DOI] [PubMed] [Google Scholar]
- 58.Saad MF, Khan A, Sharma A, et al. Physiological insulinemia acutely modulates plasma leptin. Diabetes. 1998;47:544–49. doi: 10.2337/diabetes.47.4.544. [DOI] [PubMed] [Google Scholar]
- 59.Havel PJ. Control of energy homeostasis and insulin action by adipocyte hormones: leptin, acylation stimulating protein, and adiponectin. Curr.Opin.Lipidol. 2002;13:51–59. doi: 10.1097/00041433-200202000-00008. [DOI] [PubMed] [Google Scholar]
- 60.Shapiro A, Mu W, Roncal C, Cheng KY, Johnson RJ, Scarpace PJ. Fructose-induced leptin resistance exacerbates weight gain in response to subsequent high-fat feeding. Am.J.Physiol Regul.Integr.Comp Physiol. 2008;295:R1370–R1375. doi: 10.1152/ajpregu.00195.2008. [DOI] [PMC free article] [PubMed] [Google Scholar]