

Significance
Bovine tuberculosis (TB) killed 1,500 people annually in 1930s Britain. TB control efforts still entail slaughtering many thousands of cattle annually, costing British farmers and taxpayers millions of dollars. Transmission from wild badgers impedes control of cattle TB, but nonselective badger culls confer limited benefits because culling changes badger behavior in ways that increase disease spread. A new plan to cull only test-positive badgers, and vaccinate test-negative badgers [termed test–vaccinate/remove (TVR)], is probably more publicly acceptable, and might be more effective if culling small numbers of badgers prompts no behavioral change. Unfortunately, this study shows that small-scale culling (such as TVR) changes badgers’ behavior in ways that risk increasing TB transmission among badgers and exacerbating cattle TB incidence rather than reducing it.
Keywords: zoonotic disease, epidemiology, Bacillus Calmette-Guérin, wildlife management
Abstract
Where wildlife disease requires management, culling is frequently considered but not always effective. In the British Isles, control of cattle tuberculosis (TB) is hindered by infection in wild badger (Meles meles) populations. Large-scale badger culling can reduce the incidence of confirmed cattle TB, but these benefits are undermined by culling-induced changes in badger behavior (termed perturbation), which can increase transmission among badgers and from badgers to cattle. Test–vaccinate/remove (TVR) is a novel approach that entails testing individual badgers for infection, vaccinating test-negative animals, and killing test-positive animals. Imperfect capture success, diagnostic sensitivity, and vaccine effectiveness mean that TVR would be expected to leave some infected and some susceptible badgers in the population. Existing simulation models predict that TVR could reduce cattle TB if such small-scale culling causes no perturbation, but could increase cattle TB if considerable perturbation occurs. Using data from a long-term study, we show that past small-scale culling was significantly associated with four metrics of perturbation in badgers: expanded ranging, more frequent immigration, lower genetic relatedness, and elevated prevalence of Mycobacterium bovis, the causative agent of TB. Though we could not reject the hypothesis that culling up to three badgers per social group might avoid perturbation, we also could not reject the hypothesis that killing a single badger prompted detectable perturbation. When considered alongside existing model predictions, our findings suggest that implementation of TVR, scheduled for 2014, risks exacerbating the TB problem rather than controlling it. Ongoing illegal badger culling is likewise expected to increase cattle TB risks.
Infectious diseases are often difficult to control where wildlife hosts contribute to pathogen persistence. Wildlife culling is a frequently considered control option, which is sometimes effective (1, 2), but often ineffective (3–6).
In the United Kingdom, the cattle farming industry is seriously affected by bovine tuberculosis (TB) caused by Mycobacterium bovis (7). Selective culling of test-positive cattle has helped to eradicate TB across much of the developed world, but eradication from the United Kingdom is impeded by M. bovis infection in European badgers (Meles meles) (8), as well as by continued transmission among cattle (9–11). Transmission has also been documented among badgers (12), from cattle to badgers (13), and from badgers to cattle (14, 15). Because badgers are clearly a contributing factor to the UK’s TB problem, successive TB control policies have included culling of badgers (7, 8). To date, cattle controls have emphasized selective slaughter of test-positive animals, whereas badger culls have typically been nonselective, with no testing of live animals before culling (but see ref. 16).
The impacts of nonselective badger culling on M. bovis transmission are well established. Such culling reduces badger density (17), but also promotes dispersal into the culled area (18) as well as expanding badger ranging in and around the areas where culls occurred (19). In Britain these behavioral changes—termed social perturbation—have been linked to increases in the proportion of badgers infected with M. bovis (13, 20), and reductions in the spatial clustering of infection (21). In cattle, the incidence of confirmed TB was reduced inside large culling areas where badger numbers were substantially suppressed by annual “proactive” culling. However, on adjoining unculled lands, and in areas receiving localized “reactive” culling, reductions in badger numbers were smaller, the incidence of confirmed cattle TB was elevated (14, 15, 22–24), and spatial clustering of cattle infection was reduced (21).
This propensity of nonselective badger culling to prompt social perturbation and hence increase disease transmission is a major constraint on its utility as a tool for controlling cattle TB. An alternative approach, first proposed in the 1980s, would be to target culling at test-positive badgers, just as current controls target test-positive cattle (16, 25). A further elaboration, termed test–vaccinate/remove (TVR), involves killing test-positive badgers while vaccinating test-negative badgers. A pilot TVR program is scheduled to take place across 100 sq km in Northern Ireland in 2014 (26).
Selective culling approaches (such as TVR) are likely to remove relatively small numbers of badgers. First, constraints on capture success limit testing to 56–85% of the badger population (27, 28). Second, not all captured badgers will be infected with M. bovis: in the 10 initial proactive culls of the Randomized Badger Culling Trial (RBCT), 2–38% of badgers had infection detectable by bacterial culture at standard necropsy (29). Third, not all infected badgers are detectable by available live tests: the only available trap-side test detected 49% of badgers that were culture-positive at necropsy (30), and standard necropsy itself detected only 55% of infected badgers (31). This combination of imperfect capture success, low average infection prevalence, and imperfect test sensitivity means that the numbers of badgers to be killed by selective culling would probably be low, usually just one or two badgers within a social group (32). The same factors, combined with incomplete vaccine efficacy (33), mean that some infected and some susceptible badgers would be expected to remain despite implementation of TVR.
Simulations indicate that the likely consequences of TVR for cattle TB control are highly sensitive to assumptions about whether culling small numbers of badgers prompts social perturbation (34, 35). Neither cage trapping for testing nor vaccination has been found to cause behavioral change. If the culling component of TVR likewise causes no perturbation, then TVR is predicted to reduce the prevalence of M. bovis infection in badgers and hence the incidence of cattle TB (34, 35). However, if TVR causes perturbation similar to that associated with past large- and small-scale culling, then it is projected to prompt sustained (34) or transient (35) increases in cattle TB. Unfortunately, it is not known which of these scenarios is more likely. Although the behavioral and epidemiological consequences of nonselective culling are relatively well understood, there have been no empirical studies of badgers’ behavioral responses to killing small numbers of animals per social group, as would occur under TVR and other forms of selective culling.
In this paper, we use data from a large-scale study to assess whether killing small numbers of badgers would be expected to prompt social perturbation. We compare patterns of badger movement and M. bovis infection at the start of the RBCT (conducted 1998–2005) (14) with two indices of badger mortality. Our first measure, road density, provides an index of the numbers of badgers killed in road accidents (36), an important cause of badger mortality in Britain (37, 38). Our second measure is prior nonselective culling, conducted during the period 1986–1998 as small-scale badger removal operations (BROs), which typically targeted single farms (8). We hypothesized that high road densities and intense prior culling would each lead to expanded badger movement and elevated M. bovis prevalence. Further, we hypothesized that perturbation might be avoided if the number of badgers killed remained below a certain threshold, and sought to estimate this threshold.
Results
The RBCT proactive culling areas contained 826 badger social group territories with data on four metrics of social perturbation: territory size, recent dispersal (mean D; see Methods), intragroup genetic relatedness, and M. bovis prevalence. Of these 826 territories, 179 had previously experienced at least one BRO (Table 1; Fig. S1). The time elapsed from the midpoint of the most recent BRO to completion of the first proactive cull on the same land averaged 2,062 d (5.6 y; Table 1). For comparison, generation time (the average age of parents when cubs are born) for badgers is likely to be 4–5 y.
Table 1.
History of BROs (conducted 1986–1998) within 826 badger territories mapped at the start of the RBCT (conducted 1998–2005)
| n | Mean | Median | Range | SD | |
| BROs per territory | |||||
| All territories | 826 | 0.345 | 0 | 0–5 | 0.78 |
| Culled territories | 179 | 1.59 | 1 | 1–5 | 0.90 |
| Badgers culled per BRO | 285 | 4.15 | 3 | 1–31 | 4.45 |
| Badgers culled per territory | |||||
| All territories | 826 | 1.43 | 0 | 0–48 | 4.08 |
| Culled territories | 179 | 6.61 | 5 | 1–48 | 6.54 |
| Years since most recent BRO | 179 | 5.64 | 5.10 | 0.6–15.2 | 3.65 |
In contrast with our prediction that high road mortality might prompt expanded ranging, a higher density of minor roads per territory was associated with smaller territory size after adjusting for base model covariates (Table 2). The fit of this model was not improved by a covariate representing elevational range, a measure of hilliness that might improve food availability for badgers and hence reduce territory size (39) while also increasing road density. There were no significant effects of road density on the other three metrics of perturbation.
Table 2.
Factors associated with territory size measured (in hectares, square root-transformed for analysis) at the start of the RBCT, one of four metrics of perturbation
| Estimate | 95% confidence intervals | P | |
| Intercept | 12.15 | 11.41, 12.89 | |
| No. of RBCT badgers | −0.15 | −0.2386, −0.08603 | <0.001 |
| Minor road length, m | −0.00057 | −0.00095, −0.00012 | 0.012 |
| Proportion pasture | 0.0122 | −0.00316, 0.0224 | 0.104 |
| Discounted BRO badgers | 0.27 | 0.106, 0.933 | 0.020 |
| Optimal k parameter | 0.001 | 0, 0.012 | |
| Optimal threshold | 1 | 1, 4 | |
| Negative log-likelihood | 1283.4 | ||
| R2 | 0.089 | ||
| df | 494 |
In this model, which excludes trial area, past culling is represented as the number of badgers previously culled within each territory, discounted by the number of days elapsed between the date of the past cull(s) and the date territory size was measured. The k parameter, estimated in the course of model fitting, describes the rate at which the impact of culling on territory size diminishes over time. The threshold indicates the number of badgers culled above which perturbation effects are observed. Here the optimal value is 1, indicating no threshold. Additional models exploring associations between metrics of perturbation and measures of past culling are provided in Tables S1–S10.
Table 3 summarizes effects of past culling on perturbation metrics; full models are presented in Tables S1–S10. Badgers captured in territories with prior culling were more likely to be immigrants than were those captured in territories with no prior culling, although this measure of past culling had no significant effect on mean relatedness (Table S3). Badgers captured in territories with prior culling were also more likely to be infected with M. bovis (Fig. 1A; Table S4).
Table 3.
Directions of relationships between metrics of social perturbation and measures of prior culling
| Trial area included? | Any past culling? (yes/no) | Time since last BRO | Badgers killed (discounted) | |||
| Yes | No | Yes | No | Yes | No | |
| Perturbation metrics | ||||||
| Territory size | + | + | – | –* | +* | +* |
| Recent immigration D | +* | +* | – | –* | – | + |
| Mean relatedness | – | – | +* | + | n/a | n/a |
| M. bovis prevalence | +* | – | – | – | n/a | n/a |
Fig. 1.
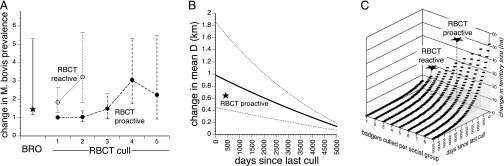
Comparisons of culling effects documented in this study with those observed in the RBCT. (A) Odds ratio associated with difference in M. bovis prevalence in territories with and without past culling, compared with successive RBCT culls; (B) predicted values for association between mean D (in kilometers) and time (in days) since the most recent cull; and (C) predicted values for association between territory size (in hectares) and discounted numbers of badgers culled. Graphs draw upon RBCT data from refs. 13 and 18–20.
Territories that had been subjected to more recent BROs were significantly larger (Table S5), were more likely to contain badgers that were recent immigrants (Fig. 1B; Table S6), and contained social groups with lower intragroup relatedness (Table S7) than those culled in the more distant past or not at all. There was no significant association between M. bovis prevalence and the time since the most recent BRO (Table S8).
Territories where greater numbers of badgers had been culled on previous BROs (discounted by the time since each cull occurred) were significantly larger than those where fewer badgers had been culled (Table 2, Fig. 1C, and Table S9). Fig. 2A shows how the negative log-likelihood of this model varied with the assumed discount parameter k. The maximum-likelihood estimate of k indicates fairly rapid discounting of culled badgers; the immediate impact on territory size of culling 10 badgers would have diminished to an effect equivalent to culling 6.9 badgers after 1 y and 1.6 badgers after 5 y. Consistent with this pattern, the discount function variable provided little improvement in model fit beyond that associated with time since the most recent cull, itself a component of the discount function (compare Tables S5 and S9). This pattern indicates that the time since the most recent BRO dominated the impact on territory size of the discounted number of badgers culled.
Fig. 2.

An example of methods for estimating perturbation thresholds, using the model of territory size shown in Table 2. (A) Variation in negative log-likelihood under different assumptions about the threshold number of culled badgers needed to prompt perturbation, and different values of the discount parameter, k. The horizontal line indicates the 95% confidence interval obtained by likelihood profiling. (B) Frequency distribution of the maximum-likelihood perturbation threshold for the same model. Vertical lines indicate the upper and lower 95% confidence limits. For this model, likelihood profiling and bootstrapping indicated a maximum-likelihood perturbation threshold of one badger and a 95% confidence interval of 1–4 badgers.
Mean D was not significantly associated with the discounted number of badgers culled on previous BROs (Table S10). Due to problems of model convergence, we were unable to explore how within-group relatedness and M. bovis prevalence were affected by this measure of culling intensity.
Table 4 summarizes analyses to explore threshold numbers of badgers killed, below which perturbation effects might be avoided. Fig. 2A illustrates how the maximum-likelihood threshold estimate was obtained for the territory size model presented in Table 2, and Fig. 2B shows a 95% confidence interval derived from this model by bootstrapping. The maximum-likelihood threshold estimates varied between different measures of past culling and different metrics of perturbation but, where significant relationships existed, the 95% confidence interval always included the range 1–4 (Table 4). Hence, our analyses did not allow us to reject the hypothesis that culls as small as one badger prompted perturbation, or that culling as many as three badgers did not.
Table 4.
Summary of the threshold numbers of badgers culled, above which changes in perturbation metrics were detectable, estimated by optimizing negative log-likelihood
| Trial area included? | Any past culling? (yes/no) | Time since last BRO | Badgers killed (discounted) | |||
| Yes | No | Yes | No | Yes | No | |
| Perturbation metrics | ||||||
| Territory size | 1 (1, 9) | 1 (1, 9) | 4 (1, 9) | 1* (1, 7) | 1* (1, 4) | 1* (1, 4) |
| Recent immigration D | 6* (1, 6) | 4* (1, 6) | 6 (1, 10) | 3* (1, 6) | 10 (1, 10) | 1 (1, 9) |
| Mean relatedness | 3 (1, 10) | 3 (1, 7) | 3* (1, 9) | 3 (1, 6) | n/a | n/a |
| M. bovis prevalence | 2* (1, 10) | 2 (2, 8) | 2 (2, 8) | 1 (1, 10) | n/a | n/a |
Figures in parentheses indicate 95% confidence intervals estimated by bootstrapping. Asterisks indicate model relationships where P < 0.05. Details of each model are provided in Table 2 and Tables S1–S10. + and − symbols refer to the directions of association in the statistical models which best fit the data.
Discussion
Our study provides the best information currently available on the likely consequences of small-scale culling for badger ecology. Hence, our findings indicate the more probable scenario for cattle TB dynamics under a TVR strategy. Existing models predict detrimental consequences for cattle TB if TVR prompts considerable perturbation of badger populations (34, 35). Although our indices of both past culling and subsequent perturbation were necessarily imprecise, our principal findings—that expanded badger ranging, increased dispersal, lower relatedness, and elevated M. bovis prevalence were detectable several years after killing even small numbers of badgers––raise the concern that TVR might indeed increase the incidence of cattle TB rather than reducing it, if model projections are correct.
Our findings also suggest that illegal culling of badgers (which in most cases will be small-scale) would prompt perturbation. Such localized nonselective culling is likely to elevate cattle TB risks rather than reducing them, as was observed with RBCT reactive culling (15, 40).
Associations between culling and altered badger behavior have been observed repeatedly elsewhere (13, 18–20, 41–44), suggesting that the associations we report may be causal. Alternatively, because BROs targeted land used by TB-affected cattle (8) where badgers are also likely to be infected (20, 29), our findings might reflect the characteristics of TB-affected land rather than the consequences of culling. However, the inclusion of base model covariates undermines support for this alternative explanation. Analyses adjusted for factors likely to influence badger ecology and the prevalence of M. bovis infection, such as social group size, availability of pasture, and (where appropriate) territory size (32). Our finding of elevated M. bovis prevalence where culling had previously occurred might reflect persistent local infection despite control efforts in the form of BROs and cattle slaughter. Alternatively, this pattern might indicate that culls increased prevalence in badgers, as observed in the RBCT (20). In either case, this association indicates that control efforts failed to eliminate local infection.
The degree of perturbation we observed was comparable with that caused by RBCT culling (Fig. 1). The increase in mean D between first and second RBCT proactive culls (18) falls within the confidence intervals estimated in this study (Fig. 1B). The difference in M. bovis prevalence between territories with and without previous BRO culling (Fig. 1A) is similar to that between first and third RBCT proactive culls (13). Increases in ranging behavior associated with RBCT proactive and reactive culling (19) are somewhat larger than those documented here (Fig. 1C), but were measured by a different method so may not be directly comparable. Changes in mean relatedness were not measured in the RBCT.
In contrast with past culling, road density was not associated with evidence of perturbation. This difference may be because road accidents caused less mortality than did culling. The average territory had lost 1.43 badgers to culling (Table 1), whereas road kill rates from mainland Europe (45–47) suggest that 0.06–0.24 badgers might be killed annually on the 1.1 km of road present in such a territory. We speculate that the negative relationship between territory size and road density might reflect high densities of roads in habitat capable of supporting high badger densities, although our analyses suggest that this association is not related to hilliness. There is no evidence to suggest that particular age/sex categories are more susceptible to culling than to road accidents.
Our analyses provided no clear evidence that culling small numbers of badgers per social group—as would occur under selective culling strategies like TVR—would avoid causing perturbation. Although we found some evidence that BROs that culled more than a certain threshold number of badgers were more likely to prompt perturbation, in all cases the 95% confidence interval for the threshold value included culls of a single badger. Hence we were unable to reject the hypothesis that even the smallest culls might prompt perturbation. We likewise cannot reject the hypothesis that culling as many as three badgers within a social group might avoid perturbation.
Our failure to find evidence of a “tipping point” for perturbation may reflect our use of relatively crude measures for both culling intensity and perturbation. Our metrics of perturbation were imprecise and, in most cases, were measured several years after BROs had been conducted (Table 1). Different characteristics of badger populations may recover from culling at different rates (e.g., although culling elevates both territory size and M. bovis prevalence, the former might decline more rapidly postculling, because changes in behavior can occur rapidly, whereas changes in prevalence depend on mortality of infected animals over time). Such differences in recovery rates, and lack of precision, may help to explain the different thresholds associated with our four perturbation metrics. Behavioral studies conducted during or immediately after culling would allow a more sensitive investigation of the behavioral and epidemiological effects of small-scale badger culling.
Despite these caveats, our findings aid interpretation of existing simulation models (34, 35), and increase concern that TVR might prove a counterproductive approach to the control of cattle TB. If TVR were to be carried out under current circumstances, implementation should include intensive monitoring of badger behavior and M. bovis epidemiology, combined with carefully formulated stopping rules to minimize potentially deleterious consequences.
The projected detrimental effects of TVR result not from perturbation alone, but from the interaction between perturbation and incomplete removal of infected badgers. If TVR (or other culling approaches) removed all infected badgers from a large area, the remaining (uninfected) badgers would not be able to transmit infection to one another or to cattle, whether or not their social structure was perturbed. Similar constraints are thought to impede the utility of selective culling for controlling other wildlife diseases. Poor diagnostic sensitivity appears to have contributed to the failure of selective culling to control infectious cancer in Tasmanian devils (Sarcophilus harrisii) (3, 48) and white-nose syndrome in bats (49). Demographic and behavioral responses to culling are thought to increase the transmission of classical swine fever in wild boar (Sus scrofa), and rabies in both red foxes (Vulpes vulpes) and vampire bats (Desmodus rotundus) (4, 5, 50). Our findings provide further evidence of the challenges associated with controlling wildlife disease by culling.
Methods
Outcome Data.
Outcome data were taken from the 10 initial proactive culls of the RBCT (14). Our units of analysis were badger social group territories. Before culling, each trial area was surveyed for signs of badger activity, including setts (dens) and latrines (14). These data were used, along with the locations of subsequent badger captures, to map badger social group territories and to allocate captured badgers to social groups using methods detailed in Woodroffe et al. (32).
We used RBCT data to estimate four metrics (Table S11) that might reflect social perturbation or its epidemiological consequences.
Territory size.
The sizes (in hectares) of delineated territories were estimated using ESRI ArcMap 9.3 (32).
Recent dispersal (D).
For eight of the 10 initial proactive culls, badgers were subjected to genetic profiling using 16 microsatellite markers (18). We used these data to estimate the rate of recent dispersal into each territory. BadMove software was used to predict the geographical origin of each adult badger, based on its genetic profile relative to other badgers (18). This approach assumes that allele frequencies vary spatially with a scale dependent on dispersal. Given this variation, the expected frequency of an allele at a point location can be estimated as a weighted mean of the frequency of the allele in the sampled individuals, with the weights inversely proportional to the distance between the focal point and the location of each individual. The distance (in kilometers) between badgers’ predicted locations and their actual capture locations (D) gives a reliable measure of recent dispersal within badger populations (18). To avoid biases caused by close kinship among badgers in the same social group, other members of the same group were excluded when predicting the location of each badger.
Mean relatedness.
Microsatellite data were used to estimate pairwise genetic relatedness between all badgers captured on a particular cull (51). These pairwise values were used to calculate the mean relatedness between badgers in the same social group. Low relatedness among group members could indicate recent immigration, but could also result from high levels of extragroup mating, as might occur where badgers range widely. Relatedness calculations excluded cubs to avoid bias caused by high levels of mother–cub relatedness.
M. bovis prevalence.
We used RBCT data to estimate the proportion of adult badgers within each social group with evidence of M. bovis infection at necropsy.
Measures of Road Density.
We estimated the lengths (in meters) of three different road types (A roads, B roads, and minor roads) within a 500-m radius of each territory centroid using Ordnance Survey Meridian 2 (www.ordnancesurvey.co.uk/business-and-government/products/meridian2.html). A radius of 500 m was chosen to approximate the size of a badger territory, while avoiding bias caused by using actual territories that vary in size. Our analyses distinguished different road types because smaller roads have been found to kill larger numbers of badgers, but accidents on larger roads more often involve multiple badgers (46).
Measures of Past Culling.
Data on the history of past culling within the RBCT proactive areas were taken from records of the UK Department for Environment, Food and Rural Affairs (Defra). For each territory delineated at the start of the RBCT, we recorded the identities of all badgers culled within a 500-m radius of the territory centroid, during the period 1986–1998. We then used these identities to calculate the numbers of BROs previously conducted within each territory, their start and end dates, and the numbers of badgers culled. We used these data to derive three measures of past culling intensity within each territory: (i) A binary measure of whether culling had (1) or had not (0) occurred. (ii) The time (in days) from the midpoint of the most recent BRO to the end of the first proactive cull. For social groups with no prior culling, this time was set to 6,000 d, exceeding the maximum time from the first BRO in 1986 to the final RBCT initial cull in 2002. (iii) The number of badgers taken in each BRO, discounted by time. As the impacts of culling on badger numbers and social behavior are known to decline over time (41), we combined the numbers of badgers culled on a BRO, and the time since that BRO, within an exponential decay function of the form
| [1] |
where RDVi is the relative discounted value of BRO event i, Ai is the number of badgers culled in event i, k is the per-day rate of discounting, and ti is the time in days since event i. Maximum-likelihood estimates of k, the rate of discounting over time, were obtained in the course of statistical model fitting (see below). For each territory, this measure of past culling was then estimated as
| [2] |
where n is the total number of BROs conducted within a particular territory.
Other Covariates.
A range of environmental factors is known to affect badger ecology and might therefore influence our four outcome metrics. Before investigating the effects of prior mortality, we therefore constructed base models to account for such covariates. Candidate explanatory variables were the proportion of pasture land (within a 500-m radius circle centered on the territory centroid) (32, 52), the number of adult badgers captured within the territory on the initial proactive RBCT cull (32), the elevational range (in meters) within the territory (a measure of hilliness, which might elevate badger density) (53), and the size of the territory (in hectares, except for analyses with territory size as a response variable).
Statistical Analyses.
Statistical models of territory size, mean D, and mean relatedness were constructed using linear regression models, and models of M. bovis prevalence used logistic regression. Analyses were conducted in the software package R (54). For analysis purposes, territory size was square root-transformed, and mean D was natural log-transformed. Variables were screened by fitting the univariable relationship between each explanatory variable and each metric of perturbation; variables with P < 0.20 were considered for inclusion in multivariable models. To construct multivariable models, the variable with the lowest P value was the starting point, with other candidate variables added in a forward selection process. The variable that produced the greatest reduction in negative log-likelihood was kept in the model and included for the next stage of testing. Variables were added until no further terms were significant. All models were constructed with and without RBCT trial area as a categorical covariate. Including trial area controlled for a variety of potential covariates, including geographical location and the calendar year and season when surveys and culls took place. However, there was also substantial variation in the culling history of different trial areas, the impacts of which were explored by including and excluding the trial area variable. Conformity with assumptions of normality was checked as appropriate.
To explore whether perturbation was avoided if the number of badgers killed per social group was below a certain threshold, we repeated our analyses assuming thresholds of 1, 2, 3... 10 badgers per social group. For each analysis, we coded data as although BROs below the candidate threshold had not taken place. We reasoned that, if perturbation is avoided when the number of badgers killed is below a certain threshold, then ignoring BROs below this threshold would maximize the data likelihood.
We used log-likelihood profiles to estimate slope parameters, thresholds, and the k-parameter for discount functions (Fig. 2). We generated P values and confidence intervals for those parameters using 10,000 bootstraps of the dataset, with trial area being the randomly resampled element of each bootstrap. For computational reasons, only 1,000 bootstraps were performed for analyses involving discounted culling.
Supplementary Material
Acknowledgments
We gratefully acknowledge staff of the UK Department for Environment, Food and Rural Affairs (Defra) and its associated agencies, who collected the data and provided constructive comment, and Tom Johnston for help with data collation and processing. This study was funded by Defra using genetic markers developed with support from the Natural Environment Research Council. The Medical Research Council provided Centre funding (C.A.D.).
Footnotes
The authors declare no conflict of interest.
*This Direct Submission article had a prearranged editor.
This article contains supporting information online at www.pnas.org/lookup/suppl/doi:10.1073/pnas.1401503111/-/DCSupplemental.
References
- 1.Caley P, Hickling GJ, Cowan PE, Pfeiffer DU. Effects of sustained control of brushtail possums on levels of Mycobacterium bovis infection in cattle and brushtail possum populations from Hohotaka, New Zealand. N Z Vet J. 1999;47(4):133–142. doi: 10.1080/00480169.1999.36130. [DOI] [PubMed] [Google Scholar]
- 2.Griffin JM, et al. The impact of badger removal on the control of tuberculosis in cattle herds in Ireland. Prev Vet Med. 2005;67(4):237–266. doi: 10.1016/j.prevetmed.2004.10.009. [DOI] [PubMed] [Google Scholar]
- 3.Lachish S, McCallum H, Mann D, Pukk CE, Jones ME. Evaluation of selective culling of infected individuals to control Tasmanian devil facial tumor disease. Conserv Biol. 2010;24(3):841–851. doi: 10.1111/j.1523-1739.2009.01429.x. [DOI] [PubMed] [Google Scholar]
- 4.Anderson RM, Jackson HC, May RM, Smith AM. Population dynamics of fox rabies in Europe. Nature. 1981;289(5800):765–771. doi: 10.1038/289765a0. [DOI] [PubMed] [Google Scholar]
- 5.Streicker DG, et al. Ecological and anthropogenic drivers of rabies exposure in vampire bats: implications for transmission and control. Proc Royal Soc B. 2012;279(1742):3384–3392. doi: 10.1098/rspb.2012.0538. [DOI] [PMC free article] [PubMed] [Google Scholar]
- 6.Conner MM, Miller MW, Ebinger MR, Burnham KP. A meta-BACI approach for evaluating management intervention on chronic wasting disease in mule deer. Ecol Appl. 2007;17(1):140–153. doi: 10.1890/1051-0761(2007)017[0140:amafem]2.0.co;2. [DOI] [PubMed] [Google Scholar]
- 7. Defra (2011) The government's policy on bovine TB and badger control in England. Available at www.defra.gov.uk/publications/files/pb13691-bovinetb-policy-statement.pdf.
- 8.Krebs JR, et al. Bovine Tuberculosis in Cattle and Badgers. London: HMSO; 1997. [Google Scholar]
- 9.Conlan AJK, et al. Estimating the hidden burden of bovine tuberculosis in Great Britain. PLOS Comput Biol. 2012;8(10):e1002730. doi: 10.1371/journal.pcbi.1002730. [DOI] [PMC free article] [PubMed] [Google Scholar]
- 10.Gilbert M, et al. Cattle movements and bovine tuberculosis in Great Britain. Nature. 2005;435(7041):491–496. doi: 10.1038/nature03548. [DOI] [PubMed] [Google Scholar]
- 11.Donnelly CA, Nouvellet P. The contribution of badgers to confirmed tuberculosis in cattle in high-incidence areas in England. PLoS Curr. 2013 doi: 10.1371/currents.outbreaks.097a904d3f3619db2fe78d24bc776098. [DOI] [PMC free article] [PubMed] [Google Scholar]
- 12.Carter SP, et al. BCG vaccination reduces risk of tuberculosis infection in vaccinated badgers and unvaccinated badger cubs. PLoS ONE. 2012;7(12):e49833. doi: 10.1371/journal.pone.0049833. [DOI] [PMC free article] [PubMed] [Google Scholar]
- 13.Woodroffe R, et al. Culling and cattle controls influence tuberculosis risk for badgers. Proc Natl Acad Sci USA. 2006;103(40):14713–14717. doi: 10.1073/pnas.0606251103. [DOI] [PMC free article] [PubMed] [Google Scholar]
- 14.Donnelly CA, et al. Positive and negative effects of widespread badger culling on tuberculosis in cattle. Nature. 2006;439(7078):843–846. doi: 10.1038/nature04454. [DOI] [PubMed] [Google Scholar]
- 15.Donnelly CA, et al. Impact of localized badger culling on tuberculosis incidence in British cattle. Nature. 2003;426(6968):834–837. doi: 10.1038/nature02192. [DOI] [PubMed] [Google Scholar]
- 16.Woodroffe R, Frost SDW, Clifton-Hadley RS. Attempts to control tuberculosis in cattle by culling infected badgers: Constraints imposed by live test sensitivity. J Appl Ecol. 1999;36(4):494–501. [Google Scholar]
- 17.Woodroffe R, et al. Effects of culling on badger abundance: implications for tuberculosis control. J Zool. 2008;274(1):28–37. [Google Scholar]
- 18.Pope LC, et al. Genetic evidence that culling increases badger movement: Implications for the spread of bovine tuberculosis. Mol Ecol. 2007;16(23):4919–4929. doi: 10.1111/j.1365-294X.2007.03553.x. [DOI] [PubMed] [Google Scholar]
- 19.Woodroffe R, et al. Effects of culling on badger (Meles meles) spatial organization: Implications for the control of bovine tuberculosis. J Appl Ecol. 2006;43(1):1–10. doi: 10.1111/1365-2664.13512. [DOI] [PMC free article] [PubMed] [Google Scholar]
- 20.Woodroffe R, et al. Bovine tuberculosis in cattle and badgers in localized culling areas. J Wildl Dis. 2009;45(1):128–143. doi: 10.7589/0090-3558-45.1.128. [DOI] [PubMed] [Google Scholar]
- 21.Jenkins HE, et al. Effects of culling on spatial associations of Mycobacterium bovis infections in badgers and cattle. J Appl Ecol. 2007;44(5):897–908. [Google Scholar]
- 22.Donnelly CA, et al. Impacts of widespread badger culling on cattle tuberculosis: Concluding analyses from a large-scale field trial. Int J Infect Dis. 2007;11(4):300–308. doi: 10.1016/j.ijid.2007.04.001. [DOI] [PubMed] [Google Scholar]
- 23.Jenkins HE, Woodroffe R, Donnelly CA. The effects of annual widespread badger culls on cattle tuberculosis following the cessation of culling. Int J Infect Dis. 2008;12(5):457–465. doi: 10.1016/j.ijid.2008.04.001. [DOI] [PubMed] [Google Scholar]
- 24.Jenkins HE, Woodroffe R, Donnelly CA. The duration of the effects of repeated widespread badger culling on cattle tuberculosis following the cessation of culling. PLoS ONE. 2010;5(2):e9090. doi: 10.1371/journal.pone.0009090. [DOI] [PMC free article] [PubMed] [Google Scholar]
- 25.Dunnet GM, Jones DM, McInerney JP. Badgers and Bovine Tuberculosis: Review of Policy. London: HMSO; 1986. [Google Scholar]
- 26. Department of Agriculture and Rural Development (2013) Test and vaccinate or remove (TVR) wildlife intervention research. Available at www.dardni.gov.uk/index/animal-health-and-welfare/animal-diseases/bovine-tuberculosis/tb-research-and-development/test-and-vaccinate-or-remove.htm. Accessed March 27, 2014.
- 27.Tuyttens FAM, et al. Differences in trappability of European badgers Meles meles in three populations in England. J Appl Ecol. 1999;36(6):1051–1062. [Google Scholar]
- 28.Smith G, Cheeseman CL. Efficacy of trapping during the initial proactive culls in the randomised badger culling trial. Vet Rec. 2007;160(21):723–726. doi: 10.1136/vr.160.21.723. [DOI] [PubMed] [Google Scholar]
- 29.Woodroffe R, et al. Spatial association of Mycobacterium bovis infection in cattle and badgers. J Appl Ecol. 2005;42(5):852–862. [Google Scholar]
- 30.Chambers MA, et al. Validation of the BrockTB stat-pak assay for detection of tuberculosis in Eurasian badgers (Meles meles) and influence of disease severity on diagnostic accuracy. J Clin Microbiol. 2008;46(4):1498–1500. doi: 10.1128/JCM.02117-07. [DOI] [PMC free article] [PubMed] [Google Scholar]
- 31.Crawshaw TR, Griffiths IB, Clifton-Hadley RS. Comparison of a standard and a detailed badger necropsy protocol for detecting Mycobacterium bovis. Vet Rec. 2008;163(16):473–477. doi: 10.1136/vr.163.16.473. [DOI] [PubMed] [Google Scholar]
- 32.Woodroffe R, et al. Social group size affects Mycobacterium bovis infection in European badgers (Meles meles) J Anim Ecol. 2009;78(4):818–827. doi: 10.1111/j.1365-2656.2009.01545.x. [DOI] [PubMed] [Google Scholar]
- 33.Chambers MA, et al. Bacillus Calmette-Guérin vaccination reduces the severity and progression of tuberculosis in badgers. Proc Biol Sci. 2011;278(1713):1913–1920. doi: 10.1098/rspb.2010.1953. [DOI] [PMC free article] [PubMed] [Google Scholar]
- 34.FERA . Badger Control Model for Wales—Trap-Test-Cull-Vaccinate Supplemental Report—4th March 2009. Cardiff: Welsh Government; 2009. [Google Scholar]
- 35.Smith GC, Budgey R, Delahay RJ. A Simulation Model to Support a Study of Test and Vaccinate or Remove (TVR) in Northern Ireland. Stormont, United Kingdom: Department of Agriculture and Rural Development; 2013. [Google Scholar]
- 36.Clarke GP, White PCL, Harris S. Effects of roads on badger Meles meles populations in south-west England. Biol Conserv. 1998;86(2):117–124. [Google Scholar]
- 37.Gallagher J, Nelson J. Cause of ill health and natural death in badgers in Gloucestershire. Vet Rec. 1979;105(24):546–551. [PubMed] [Google Scholar]
- 38.Macdonald DW, Newman C. Population dynamics of badgers (Meles meles) in Oxfordshire, U.K.: Numbers, density and cohort life histories, and a possible role of climate change in population growth. J Zool. 2002;256(1):121–138. [Google Scholar]
- 39.Kruuk H. Foraging and spatial organisation in the European badger, Meles meles L. Behav Ecol Sociobiol. 1978;4(1):75–89. [Google Scholar]
- 40.Vial F, Donnelly CA. Localized reactive badger culling increases risk of bovine tuberculosis in nearby cattle herds. Biol Lett. 2012;8(1):50–53. doi: 10.1098/rsbl.2011.0554. [DOI] [PMC free article] [PubMed] [Google Scholar]
- 41.Cheeseman CL, Mallinson PJ, Ryan J, Wilesmith JW. Recolonisation by badgers in Gloucestershire. In: Hayden TJ, editor. The Badger. Dublin: Royal Irish Academy; 1993. pp. 78–93. [Google Scholar]
- 42.Tuyttens FAM, et al. Spatial perturbation caused by a badger (Meles meles) culling operation: Implications for the function of territoriality and the control of bovine tuberculosis (Mycobacterium bovis) J Anim Ecol. 2000;69(5):815–828. doi: 10.1046/j.1365-2656.2000.00437.x. [DOI] [PubMed] [Google Scholar]
- 43.Riordan P, Delahay RJ, Cheeseman C, Johnson PJ, Macdonald DW. Culling-induced changes in badger (Meles meles) behaviour, social organisation and the epidemiology of bovine tuberculosis. PLoS ONE. 2011;6(12):e28904. doi: 10.1371/journal.pone.0028904. [DOI] [PMC free article] [PubMed] [Google Scholar]
- 44.O'Corry-Crowe G, Hammond R, Eves J, Hayden TJ. The effect of reduction in badger density on the spatial organisation and activity of badgers Meles meles L. in relation to farms in central Ireland. Biol Environ Proc Royal Irish Acad. 1996;96B:147–158. [Google Scholar]
- 45.Aaris-Sørensen J. Road kills of badgers (Meles meles) in Denmark. Ann Zool Fenn. 1995;32(1):31–36. [Google Scholar]
- 46.van Langevelde F, van Dooremalen C, Jaarsma CF. Traffic mortality and the role of minor roads. J Environ Manage. 2009;90(1):660–667. doi: 10.1016/j.jenvman.2007.09.003. [DOI] [PubMed] [Google Scholar]
- 47.Grilo C, Bissonette JA, Santos-Reis M. Spatial–temporal patterns in Mediterranean carnivore road casualties: Consequences for mitigation. Biol Conserv. 2009;142(2):301–313. [Google Scholar]
- 48.Beeton N, McCallum H. Models predict that culling is not a feasible strategy to prevent extinction of Tasmanian devils from facial tumour disease. J Appl Ecol. 2011;48(6):1315–1323. [Google Scholar]
- 49.Hallam TG, McCracken GF. Management of the panzootic white-nose syndrome through culling of bats. Conserv Biol. 2011;25(1):189–194. doi: 10.1111/j.1523-1739.2010.01603.x. [DOI] [PubMed] [Google Scholar]
- 50.Bolzoni L, Real L, De Leo G. Transmission heterogeneity and control strategies for infectious disease emergence. PLoS ONE. 2007;2(8):e747. doi: 10.1371/journal.pone.0000747. [DOI] [PMC free article] [PubMed] [Google Scholar]
- 51.Queller DC, Goodnight KF. Estimating relatedness using genetic markers. Evolution. 1989;43(2):258–275. doi: 10.1111/j.1558-5646.1989.tb04226.x. [DOI] [PubMed] [Google Scholar]
- 52.Kruuk H, Parish T, Brown CAJ, Carera J. The use of pasture by the European badger (Meles meles) J Appl Ecol. 1979;16(2):453–459. [Google Scholar]
- 53.Kruuk H, Macdonald DW. Group territories of carnivores: Empires and enclaves. In: Sibly RM, Smith RH, editors. Behavioural Ecology: Ecological Consequences of Adaptive Behaviour. Oxford: Blackwell Scientific; 1985. [Google Scholar]
- 54. R Core Team (2013) R: A Language and Environment for Statistical Computing (R Foundation for Statistical Computing, Vienna)
Associated Data
This section collects any data citations, data availability statements, or supplementary materials included in this article.