

Abstract
The immunosuppressive effects of CD4+ CD25high regulatory T cells interfere with anti-tumor immune responses in cancer patients. Here, we present a novel class of engineered human Interleukin (IL)-2 analogues that antagonize the IL-2 receptor, for inhibiting regulatory T cell suppression. These antagonists have been engineered for high affinity to the α subunit of the IL-2 receptor and very low affinity to either the β or γ subunit, resulting in a signaling-deficient IL-2 analogue that sequesters the IL-2 receptor α subunit from wild type IL-2. Two variants, “V91R” and “Q126T” with residue substitutions that disrupt the β and γ subunit binding interfaces, respectively, have been characterized in both a T cell line and in human primary regulatory T cells. These mutants retain their high affinity binding to IL-2 receptor α subunit, but do not activate STAT5 phosphorylation or stimulate T cell growth. The two mutants competitively antagonize wild-type IL-2 signaling through the IL-2 receptor with similar efficacy, with inhibition constants of 183 pM for V91R and 216 pM for Q126T. Here, we present a novel approach to CD25-mediated Treg inhibition, with the use of an engineered human IL-2 analogue that antagonizes the IL-2 receptor.
Keywords: Interleukin-2, regulatory T cells, antagonist engineering, cytokine engineering
Introduction
CD4+C D25high regulatory T cells (Tregs) suppress immune responses1,2 and have been found in the circulation of patients with various cancers3–6 as well as near tumor sites,5–6 correlating with reduced survival in some cancers.6–8 Tregs dampen anti-tumor immune responses by inhibiting the effector functions of tumor-specific CD4+ and CD8+ T cells.6, 9–11 As a result, the inhibition of Treg suppression of an anti-tumor immune response is one approach to cancer therapy currently being studied.
While the expression of the nuclear transcription factor Foxp3 appears to be the most specific marker for Tregs,12–15 surface receptors for targeting Tregs include glucocorticoid-induced tumor necrosis factor receptor, cytotoxic T-lymphocyte antigen 4, and folate receptor 4.16–18 We chose to target CD25, the Interleukin (IL)-2 receptor α subunit (IL-2Rα), which is constitutively expressed at high levels on CD4+CD25high Tregs. The CD25 marker has been utilized successfully for Treg depletion. For example, anti-CD25 monoclonal antibodies and the diphtheria toxin / Interleukin -2 fusion protein, DAB389-IL-2 (also known as denileukin difitox, or ONTAK) have been used to deplete Tregs alone or in conjunction with a cancer vaccine to induce effective anti-tumor immune responses in mice and humans.19–23 However, these remain sub-optimal for several reasons. For example, the diphtheria toxin portion of DAB389-IL-2 exhibits both toxicity and immunogenicity.24 Anti-CD25 antibodies can cause elimination of Tregs by complement or by antibody dependent cell-mediated cytotoxicity, thereby disturbing T cell homeostasis.25 While the inhibition of Treg function is desirable, their outright elimination would potentially be more disruptive to normal immune regulation and prevention of autoimmunity. Treg functional inhibition may be preferable to depletion as a therapeutic strategy, because Treg inhibition maintains normal T cell numbers, whereas Treg depletion simply leads to replenishment with new, uninhibited Tregs.26.
Here, we present a novel approach to CD25-mediated Treg inhibition, with the use of an engineered human IL-2 analogue that antagonizes the IL-2 receptor. Instead of using CD25 merely as a surface marker to identify and target Tregs, our approach is to inhibit the downstream effects of IL-2 receptor signaling. IL-2 is essential to Treg biology; it is required for the expansion, maintenance and the suppressive function of Tregs.27–30 An IL-2 antagonist that is also an IL-2 analogue could potentially minimize the chances for systemic toxicity and immunogenicity, providing inhibition of Treg function without their elimination.
To construct competitive IL-2 antagonists, we started with 2-4 IL-2, an IL-2 analogue that was originally designed for more potent T cell signaling responses and a better therapeutic index with selective targeting for CD25+ T cells over CD25− natural killer cells. 2-4 IL-2 was engineered for increased binding affinity to the IL-2 receptor α subunit using directed evolution and yeast surface display.31 For antagonists, we constructed and characterized two variants of 2-4 IL-2, one with a valine to arginine substitution at position 91, and the second with a glutamine to threonine at position 126, both on the 2-4 IL-2 background. These mutants, termed V91R and Q126T, are designed to disrupt binding to the IL-2 receptor β (IL-2Rβ) and IL-2 receptor γ (IL-2Rγ) subunits, respectively. They exhibit antagonistic properties without stimulating IL-2 receptor signaling in both the human T cell line Kit225 and human primary CD4+Foxp3+ Tregs ex vivo. These analogues could prove useful as pharmacological Treg inhibitors in the context of cancer immunotherapy. In addition, to the best of our knowledge, this is the first report of engineering a cytokine analogue with high affinity to a non-signaling receptor subunit, and low affinity to the signaling receptor subunits to create effective cytokine antagonists. Therefore, this approach of engineering signaling deficient cytokine analogues that bind tightly and sequester the receptor from the wild type cytokine represents a novel paradigm that can be more broadly applied to antagonist engineering, such as for other γ common receptor cytokines, or for inflammatory cytokines such as IL-1, IL-6, or IL-12.
Materials and Methods
Preparation of IL-2 mutant proteins
Single point mutations were introduced to the 2-4 IL-2 coding sequence using the Quikchange kit (Stratagene, La Jolla, CA) according to the manufacturer’s instructions. IL-2 mutants were expressed in yeast with an N-terminal FLAG tag and a C-terminal c-myc tag as previously described.31 The supernatant was concentrated and buffer exchanged with PBS using a 10kDa MWCO ultrafiltration unit (Millipore, Billerica, MA). The retentate was purified using an anti-FLAG M2 agarose affinity gel (Sigma-Aldrich, St. Louis, MO), followed by size exclusion chromatography with a Superdex 75 column (GE Healthcare, Piscataway, NJ). Elution fractions that contained only monomeric protein were pooled and the protein concentration was determined using the Micro BCA Protein Assay kit (Pierce, Rockford, IL).
Tissue Culture
To characterize the IL-2 mutants, the human IL-2 dependent T cell line Kit225, which constitutively expresses all three subunits of the IL-2 receptor, was used. The cells were cultured in a humidified atmosphere in 5% CO2 in RPMI 1640 supplemented with 10% heat-inactivated fetal bovine serum, 40 pM IL-2, 2 mM L-glutamine, 2 mg/mL sodium bicarbonate, 50 U/mL penicillin, 50 μg/mL streptomycin and 50 μg/mL gentamicin.
Determination of IL-2Rα binding affinities of IL-2 mutants
The equilibrium binding affinities of V91R and Q126T binding to IL-2Rα were evaluated using a modification of a previously described protocol.31 Kit225 cells were incubated in phosphate buffered saline (PBS) + 0.1% bovine serum albumin (BSA) at 37°C for 30 minutes, at 8×10⁵ cells/mL with varying IL-2 mutant concentrations. At low IL-2 mutant concentrations, the total volume was increased to maintain an excess number of IL-2 mutant molecules over the number of IL-2Rα. After incubation, cells were kept on ice and stained with mouse anti-FLAG monoclonal antibody M2 (Sigma Aldrich, St. Louis, MO), followed by an Alexa Fluor 488 conjugated goat anti-mouse antibody (Invitrogen, Carlsbad, CA), to detect cell-surface bound protein. The mean single-cell fluorescence was measured, and the dissociation constant (KD) and the 95% confidence interval were determined as previously described,31 using the following equation: , where Fobs is the background-corrected mean fluorescence, L0 is the initial concentration of the protein being measured, and c is the proportionality constant. The KD of IL-2 C125S, which is equivalent to aldesleukin (Proleukin, Novartis, Basel, Switzerland) and is referred to as “wild type IL-2,” was also measured as a control.
Analysis of STAT5 phosphorylation
For all STAT5 phosphorylation assays, Kit225 cells were starved of IL-2 for 36 hours. Kit225 cells were incubated per at 106cells/mL culture medium at 37°C with IL-2 mutants for 30 minutes (for agonism studies), or with IL-2 mutants and 3 pM wild type IL-2 for 15 minutes (for antagonism studies). The cells were fixed and permeabilized using the method optimized by Krutzik et al.32 The cells were stained with anti-pSTAT5 antibody clone 47 conjugated with Alexa Fluor 488 (BD Biosciences, San Jose, CA) and the mean single-cell fluorescence was measured. For antagonism studies, the half-maximal inhibitory concentration (IC50) and the 95% confidence interval were determined using the following equation , where all variables are defined above. A global fit nonlinear regression was performed for each protein, using a global IC50 value and the proportionality constant from each of two separate experiments.
For analysis of human whole blood, phosphorylation state analysis was performed using BD Phosflow technology according to the manufacturer’s instructions (BD Biosciences, San Jose, CA), and as previously described.33 All human blood samples were obtained with informed consent and according to the Institutional Ethics Review Board Protocols. All blood samples were collected in sterile 10 mL lithium heparin Monoject tubes. For each condition and time point, 4 mL fresh, ex vivo blood from healthy control donors were used. Blood samples were incubated with IL-2 or with a cocktail of IL-2 and IL-2 antagonists in 50 mL polypropylene Falcon conical tubes for 30 min in a 37°C water bath. Fixation of cells and preservation of phosphorylation status was obtained by adding pre-warmed BD Lyse/Fix buffer and incubation in a 37°C water bath. Permeabilization of cells was performed by incubation of cells in BD Perm Buffer III on ice for 30 min. Cells were subsequently washed twice with 2% FBS/PBS and stained using BD Staining Buffer (all reagents from BD Bioscience, San Jose, CA). Cells were stained using APC mouse anti-human CD4 (clone RPA-T4) (BD Bioscience, San Jose, CA), PE anti-human Foxp3 (clone 206D) (Biolegend, US) and Alexa Fluor-488 mouse anti-human pSTAT5 (pY694; clone 47) (BD Bioscience, San Jose, CA).
Kit225 Cell Proliferation Assays
Kit225 cells were starved of IL-2 for 36 hours. Then, 4×10⁵ cells were incubated in 3 mL culture medium at 37°C with IL-2 mutants, either in the absence (for agonism studies), or presence (for antagonism studies) of 25 pM wild type IL-2. At each time point, the live cell number in 100μL culture medium was determined in triplicate using the CellTiter-Glo assay (Promega, Madison, WI) and a Cary Eclipse luminometer (Varian, Palo Alto, CA) according to the manufacturer’s instructions.
Results
Design of IL-2 Mutant Antagonists
IL-2 analogue antagonists were designed using the following criteria: 1) high binding affinity to IL-2Rα, the IL-2 specific capture subunit, and 2) low predicted binding affinity to IL-2Rβ or IL-2Rγ, the two subunits responsible for receptor signaling. The high binding affinity to IL-2Rα leads to preferential IL-2Rα binding of the IL-2 analogue over wild type IL-2, while the low binding affinity to IL-2Rβ or IL-2Rγ would prevent the IL-2 analogue from activating the IL-2 receptor signal itself. We achieved the first design criterion by using a previously engineered mutant of human IL-2, 2-4 IL-2, as a starting point for our IL-2 analogue. 2-4 IL-2 is an IL-2 analogue previously developed in our lab using directed evolution and yeast surface display to have high binding affinity to IL-2Rα.31 The KD of 2-4 IL-2 binding to IL-2Rα is ~200 pM whereas the KD of wild type IL-2 binding to IL-2Rα is ~30 nM. 2-4 IL-2 persists on the surface of cells expressing IL-2Rα for days, significantly longer than the cell surface persistence of wild type IL-2.31
For the second design criterion, we used recently published crystal structures of wild type IL-2 bound to the three IL-2 receptor subunits34, 35 to identify candidate residues likely to make energetically important interactions with the IL-2Rβ or IL-2Rγ subunits. Assuming that these interactions are preserved in 2-4 IL-2 binding to IL-2Rβ and IL-2Rγ, we disrupted binding of 2-4 IL-2 to IL-2Rβ or IL-2Rγ by introducing amino acid substitutions at these locations. Five mutants, each with a single residue substitution on the 2-4 IL-2 background were generated in small scale pilot studies (Table I). Several of these point mutations have been reported in the literature on a wild type IL-2 background to disrupt biological activity36 or more explicitly, to disrupt IL-2 receptor subunit binding affinity.37–40 Of the five mutants generated, V91R and Q126T, which contain single residue substitutions at the binding interfaces with IL-2Rβ and IL-2Rγ, respectively, were secreted in yeast most efficiently and were characterized further (Fig. 1). On wild type IL-2, a valine at position 91 is in the center of the IL-2 / IL-2Rβ interface and makes van der Waals interactions with IL-2Rβ.35 Therefore, a charged amino acid substitution, such as arginine, at position 91 (V91R) was hypothesized to disrupt binding to IL-2Rβ. As for IL-2Rγ binding, previous reports have shown the importance of Q126 for biological activity;40, 41 the crystal structures used also identified Q126 as the most important IL-2 residue that interacts with IL-2Rγ.34, 35 Cassell and coworkers performed an extensive study of the activity of wild type IL-2 mutants on T cells with each of the 20 amino acids in the 126 position, and showed that threonine yielded the lowest activity.36 We assumed that this was due to abrogated IL-2Rγ binding and was the basis for introducing a threonine substitution at position 126 (Q126T) on the 2-4 IL-2 background.
Table I.
Mutations for Disrupting IL-2 Receptor Subunit Binding
| Subunit Binding Disrupted | Mutation |
|---|---|
| IL-2Rβ | D88R*, V91R |
| IL-2Rγ | Q126T, Q126I |
| IL-2Rβ and IL-2Rγ | E15W |
Wild type IL-2 has an asparagine at position 88, but 2-4 IL-2 has an asparagine to an aspartic acid substitution
Figure 1.

Interleukin-2 Antagonist Design
The crystal structure of IL-2 (orange) complexed with the full IL-2 receptor complex, IL-2Rα (yellow), IL-2Rβ (blue), and IL-2Rγ (magenta), is shown with the valine 91 and glutamine 126 residues highlighted (A). Close-ups are shown of the IL-2 / IL-2Rβ interface with V91 (B), and the IL-2 / IL-2Rγ interface with Q126 (C). The crystal structure was calculated by Wang et al.32
IL-2 Analogue Binding Affinity to the IL-2 Receptor α Subunit
The first design criterion for the IL-2 antagonists was to maintain high binding affinity to IL-2Rα in order for IL-2Rα to preferentially bind the antagonist over wild type IL-2. Therefore, the first step in characterizing the IL-2 analogues was to measure their IL-2Rα binding affinity using Kit225, a human T cell line that is dependent on IL-2 for growth. Kit225 constitutively expresses all three subunits of the IL-2 receptor, with IL-2Rα in ~10 fold excess. The surface labeling of Kit225 is thus dominated by binding to IL-2Rα, and the IL-2Rα binding affinity can be measured using cell surface titrations on Kit225.
The binding domains to each of the three IL-2 receptor subunits are on distinct areas of the surface of IL-2.34, 35 Therefore, single residue substitutions at the IL-2Rβ or IL-2Rγ interfaces on the 2-4 IL-2background were estimated to have little or no effect on the binding affinity to IL-2Rα. Indeed, the measured IL-2Rα binding affinities of V91R and Q126T are similar to that of 2-4 IL-2, indicating that the introduction of each of the two point mutations did not disrupt high affinity binding to IL-2Rα (Fig. 2). On the other hand, a Q126T/V91R double mutant that we sought to explore had significantly lower IL-2Rα binding affinity (KD = 2 nM, data not shown), presumably due to some synergistic destabilization by the two mutations that reduces the IL-2Rα binding affinity by disrupting the protein’s conformation. Although this was an unexpected result, this example underscores the importance of ensuring that the protein’s conformation and its IL-2Rα affinity is preserved when introducing other residue substitutions for other antagonists designed in this manner.
Figure 2.
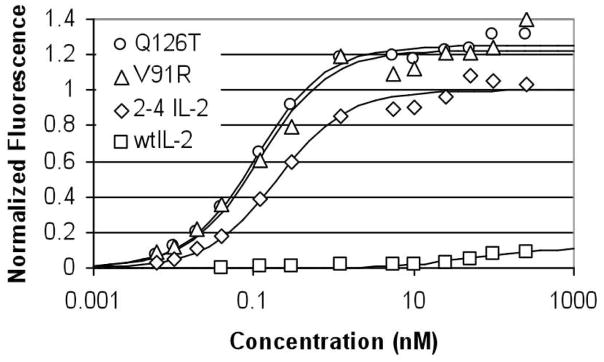
Kit225 cell surface titrations to measure IL-2Rα binding affinity. The binding isotherms are shown for: Q126T (KD = 109±19 pM), V91R (KD = 119±45 pM), 2-4 IL-2 (KD = 199±56 pM), and wild type IL-2 (KD = 46±36 nM). Fluorescence is normalized to the maximum fluorescence of 2-4 IL-2 as determined by least squares regression, and KD values are reported with 95% confidence intervals.
Disruption of Binding to the IL-2 Receptor β and γ Subunits
The second design criterion for the IL-2 antagonists was the disruption of binding affinity to the IL-2Rβ and IL-2Rγ subunits, so that the IL-2 mutants themselves would not agonize the IL-2 receptor. The binding affinities of wild type IL-2 to IL-2Rβ or to IL-2Rγ alone are relatively low, with KD values of approximately 0.5 mM and 0.7 mM, respectively.42 The affinities of the IL-2 analogues with disrupted binding interactions to IL-2Rβ or IL-2Rγ would likely be too low to be measured reliably. Therefore, instead of directly measuring those binding affinities, the inability of the IL-2 analogues to agonize the IL-2 receptor at both an early and late signaling event was measured.
The Jak/STAT pathway is activated by the IL-2 receptor in both non-regulatory T cells and regulatory T cells,43 and thus phosphorylated STAT5 (pSTAT5) was used as an early marker of IL-2 receptor activation. During initial testing, STAT5 phosphorylation in Kit225 was found to be extremely sensitive to wild type IL-2, with a measured half-maximal effective concentration (EC50) of approximately 2 pM wild type IL-2 (Fig. 3A). However, the pSTAT5 profiles of cells treated with 100 nM V91R or Q126T are indistinguishable from those of untreated cells (Fig. 3B), thus indicating that the V91R and Q126T mutations severely inhibit the IL-2 mutants’ ability to activate the IL-2 receptor.
Figure 3.

Lack of Agonism by Q126T and V91R. STAT5 phosphorylation in Kit225 cells is highly sensitive to IL-2. In an IL-2 dose response curve (A) in the absence of antagonist, the measured EC50 is 2.1±1.2pM, and these data are representative of two independently repeated experiments. In both a STAT5 phosphorylation assay (B) and a cell proliferation assay (C) in Kit225, Q126T and V91R were significantly inhibited in their ability to activate the IL-2 receptor. Error bars represent the standard deviation of the live cell number at each data point measured in triplicate. Cell number is normalized to the mean cell number of the 25 pM wild type IL-2 group on day 4. These data are representative of three independently repeated experiments.
Because the Kit225 cell line is dependent on exogenous IL-2 for growth, Kit225 cell proliferation was used as a late signaling event in measuring IL-2 receptor activation. The half maximal effective concentration for wild type IL-2 induced cell growth has been reported to be ~10 pM,44 consistent with our results (data not shown). Similar to the pSTAT5 analysis, there was minimal to no Kit225 proliferation stimulated by V91R and Q126T at concentrations as high as 100 nM (Fig. 3C). At 100 nM, V91R did induce a very slight residual amount of cell growth, but this was still significantly less than the growth induced by 25 pM IL-2, signifying an over 4000-fold reduction in cell proliferative activity on a molar basis.
Antagonism by the IL-2 Analogues
Next, the ability of the IL-2 mutants to antagonize the IL-2 receptor was studied using the same early and late signaling events measured in the agonism studies. In pSTAT5 assays in Kit225, both V91R and Q126T antagonized the IL-2 receptor with equal efficacy and IC50 values of ~500 pM (Fig. 4A). In Kit225 cell proliferation assays, V91R and Q126T effectively antagonized IL-2 receptor as well (Fig. 4B). V91R and Q126T were also tested for antagonism of STAT5 phosphorylation in primary human Tregs ex vivo. As shown in Figure 4C and Figure 1, Supplemental Digital Content 1, http://links.lww.com/JIT/A10, these antagonists potently interfere with wild-type IL-2 signaling.
Figure 4.

Antagonism by Q126T and V91R. The two mutants, Q126T and V91R, were assayed for antagonism in the presence of 3 pM wild type IL-2 in a phosphorylated STAT5 assay (A), where the IC50 values and 95% confidence intervals were determined to be 525±252 pM Q126T, and 445±90 pM V91R. Data for each antagonist are combined from two independent experiments. Fluorescence is normalized to the maximum fluorescence of each antagonist as determined by least squares regression. In the Kit225 cell proliferation assay (B), 100 nM of Q126T or V91R was able to antagonize 25pM wild type IL-2. These data are representative of three independently repeated experiments. Cell number is normalized to the mean cell number of the 25 pM wild type IL-2 group on day 4. Error bars represent the standard deviation of the cell number at each data point measured in triplicate. Antagonism of STAT5 phosphorylation in primary human Treg cells ex vivo in the presence of 40 pM wild type IL-2 was also measured (C). Fluorescence was normalized to a value of 1.0 for 40 pM IL-2 in the absence of antagonist, and 0.0 in the absence of either antagonist or agonist.
For a competitive antagonist, the Cheng-Prusoff relationship45 describes the relationship between the half-maximal inhibitory concentration of antagonist, IC50, and the inhibition constant, KI. It is given by: , where [A]=wild type IL-2 agonist concentration, and the EC50 is the half-maximal effective concentration of wild type IL-2 agonist in the absence of antagonist. Based on the measured IC50 values and the wild type IL-2 concentration used in Figure 4A, the corresponding KI values are 183 pM for V91R and 216 pM for Q126T. These values are consistent with the binding affinity measured (Fig. 2). They are also consistent when repeating the pSTAT5 antagonism assay with a different wild type IL-2 agonist concentration (See Figure 2, Supplemental Digital Content 2, http://links.lww.com/JIT/A11). Because IC50 values are dependent on assay conditions, such as wild type IL-2 agonist concentration, the measured IC50 values are not directly applicable to other in vitro or in vivo assays. Instead, a better indicator of the antagonists’ effectiveness and potency is the assay-independent Ki which are sub-nanomolar for both antagonists and indicate relatively potent antagonists. V91R and Q126T also potently antagonize wild type IL-2 in human primary Tregs. However, a similar analysis based on the Cheng-Prusoff equation for a consistency check cannot be performed, due to a lack of an EC50 value for the assay. The donor variability in IL-2 sensitivity as well as limitations in the amount of blood taken from a single donor make it difficult to measure both an IL-2 agonist dose response (for EC50 determination) and antagonist inhibition curves (for IC50 determination) for use in calculating KI values in primary Tregs.
Discussion
Protein engineering techniques were used to customize the binding affinities of IL-2 to each of its receptor subunits, resulting in a novel class of IL-2 analogues with high affinity to IL-2Rα and low affinity to either IL-2Rβ or IL-2Rγ. These mutants antagonize wild type IL-2 in both a T cell line and in primary Tregs ex vivo. By targeting the downstream effects of the IL-2 receptor rather than simply using CD25 as a cellular marker to deliver cytotoxic payloads, these IL-2 antagonists provide a novel mode of pharmacological Treg inhibition potentially of use for cancer immunotherapy.
The IL-2 variants created by substituting on 2-4 IL-2 either a valine to arginine at position 91 or a glutamine to threonine at position 126 retain high affinity IL-2Rα binding, minimally activate the IL-2 receptor, and antagonize the IL-2 receptor. The assumption that the wild type IL-2 / IL-2 receptor crystal structure could be used to rationally design mutants of 2-4 IL-2 appears to hold up well. In fact, it was surprising that single residue substitutions at V91R or Q126T were so effective at disrupting binding to IL-2Rβ and IL-2Rγ, respectively, and created such signaling deficient analogues of 2-4 IL-2. Of course, effective antagonists are not limited to these substitutions on the 2-4 IL-2 background. Residue substitutions, such as those listed in Table I, or other unidentified substitutions at the IL-2Rβ or IL-2Rγ binding interfaces, or combinations of these, could also potentially yield potent antagonists on the 2-4 IL-2 background.
The potency of antagonism of both mutants tested were nearly identical in this study. However, if additional residue substitutions are explored, a 2-4 IL-2 mutant with disrupted IL-2Rγ affinity may be preferable to one with disrupted IL-2Rβ affinity. Unbound IL-2Rα and IL-2Rβ have been shown to pre-associate on the cell surface46–48 and an IL-2 mutant with high IL-2Rα affinity may still bind preformed IL-2Rα/IL-2Rβ complexes, even with lowered IL2-Rβ affinity.49 Once bound to IL-2Rα/IL-2Rβ complexes, the mutant might bind IL-2Rγ due to undisrupted IL-2Rγ binding affinity, and undesirably create a signaling complex. We speculate this may be the cause of the low levels of agonism by V91R. Second, if a mutant with disrupted IL-2Rβ binding affinity only binds IL-2Rα, this leaves IL-2Rβ and IL-2Rγ available for signaling by wild type IL-2, although signaling in the absence of IL-2Rα is much less efficient. A 2-4 IL-2 analogue with disrupted binding to both IL-2Rβ and IL-2Rγ is another potential design to be explored, but such a double mutant may not sequester preformed IL-2Rα/IL-2Rβ complexes from wild type IL-2 as efficiently as a mutant with disrupted IL-2Rγ affinity only. Unfortunately, our attempts to express a Q126T/V91R double mutant unexpectedly yielded a presumably misfolded protein with significantly lower IL-2Rα binding affinity.
The requirement of IL-2 signaling for many biological functions of Tregs, including activation of their suppressive functions, has been well documented in the literature.27–30 Our antagonists inhibit IL-2 mediated proliferation in a human T cell line, and STAT5 phosphorylation in both a human T cell line and human primary Tregs. Since IL-2 does not activate the PI3K/Akt and MAPK signaling pathways in Tregs,43 the inhibition of STAT5 phosphorylation in primary Tregs is significant, because this represents blockage of all known signaling pathways downstream of the IL-2 receptor. Therefore, the documented requirement of IL-2 signaling for Treg suppressive function, coupled with data that IL-2 signaling is blocked in Tregs by our antagonists, provide strong evidence that these antagonists are capable of inhibiting Treg suppressive function.
To measure Treg suppression in vitro, a coculture assay is traditionally performed, where the proliferation of effector T cells is measured in the presence of Tregs, CD3 activating antibodies and costimulation.1 However, for testing the effects of the antagonists on Tregs, there exist many confounding and competing effects that make the results of such an assay ambiguous and not definitive of the antagonists’ effects in vivo. First of all, the anti CD25 antibody used for Treg purification is detectably bound to the cell’s surface for 48 hours or more after purification, and could inhibit binding of the antagonists to CD25 (data not shown). This was part of the reason that whole blood, instead of purified T cell subsets, was used to analyze the effects of the antagonists on gated CD4+Foxp3+ cells, without staining for CD25. Next, the usefulness of the standard in vitro Treg coculture suppression assay is limited, because IL-2 antagonism would also have mixed effects on activated effector T cells that are upregulated for CD25. Antagonism of wild type IL-2 may inhibit proliferation and other effector functions in activated T cells. However, there is also the possibility that the antagonists may inhibit activation induced cell death, thereby enhancing effector functions by prolonging the lifespan of the effector T cells. Given these competing effects, the results from an in vitro co-culture Treg suppression assay would be difficult to interpret and ambiguous at best. Furthermore, the results would likely be dependent on assay conditions1 such as absolute and relative Treg and effector T cell numbers used, the type and amount of costimulation, the cell isolation method, and other culture conditions; the in vitro assay would thus inaccurately reflect what occurs in vivo. Therefore, our next steps focused on testing these antagonists in vivo. Unfortunately, the 2-4 human IL-2 mutant does not bind with enhanced affinity to the mouse IL-2 receptor α subunit, so the antagonists developed in this study cannot be tested in a mouse model. We are currently recapitulating the approach used here for engineering human IL-2 antagonists with mouse IL-2. It will be interesting to contrast the effects of these specific IL-2 signaling antagonists to those of ablative CD25-targeted therapies such as DAB389-IL-2 and anti-CD25 antibodies in an in vivo model system.
It will also be important to test the selectivity of the IL-2 antagonists for Tregs over activated effector T cells. The significant variability and dependence on assay conditions, as described above and previously reviewed,1 all make an in vitro assay unsuitable for testing this selectivity. Nevertheless, there are several factors that would potentially favor a selective effect on Tregs in vivo. First, effector T cells are activated by IL-2 in an autocrine manner, whereas Tregs do not secrete IL-2 and instead require IL-2 that is secreted by neighboring effector T cells in a juxtacrine manner. Therefore, the local IL-2 concentration surrounding effector T cells would be higher than for Tregs, making it easier to antagonize IL-2 effects on Tregs. Second, activated T cells express CD25 in a transient manner, and therefore have a shorter window of time for inhibition by IL-2 antagonists than Tregs, which constitutively express CD25. Lastly, from an empirical standpoint, Tregs are selectively depleted by the DAB389-IL-2 fusion protein in several studies.19–21 Though the mechanism of this selectivity has not been elucidated, the analogy can be tentatively applied to IL-2 antagonists because both rely on the interactions between IL-2 and the high affinity trimeric IL-2 receptor.
While these antagonists were originally designed as a novel class of Treg inhibitors, their use is not necessarily limited to biological inhibitors of regulatory T cell function. For example, these antagonists may be of use for inhibiting the effects of soluble CD25 in the body. Another potential use may be for targeting CD25 expressing cells for the delivery of drug payloads or for gene delivery, where IL-2 receptor activation, antibody dependent cell cytotoxicity or complement-mediated elimination may be undesirable.
Supplementary Material
Antagonist Dose Response for pSTAT5 in primary human Treg cells characterized by expression of CD4 and FoxP3. Flow histograms for each antagonist treatment series are shown. Wild type IL-2 is used at a concentration of 40 pM wild type IL-2, and ratios given are molar ratios of wild type IL-2 to antagonist. Data are representative of three independent experiments.
Antagonism by Q126T and V91R. The two mutants, Q126T and V91R, were assayed for antagonism in the presence of 25 pM wild type IL-2 in a phosphorylated STAT5 assay, where the IC50 values and 95% confidence intervals were determined to be 1.9±0.4 nM Q126T, and 2.4±0.6 nM V91R. Data for each antagonist are combined from two independent experiments. Fluorescence is normalized to the maximum fluorescence of each antagonist as determined by least squares regression. Based on an analysis by the Cheng-Prusoff relationship, these IC50 values correspond to inhibition constant, KI, values of 180 pM for V91R and 140 pM for Q126T.
Acknowledgments
Grant Support: NIH AI065824 and the NIGMS/MIT Biotechnology Training Program
Financial Support: This work was supported by NIH AI065824 and the NIGMS/MIT Biotechnology Training Program.
Footnotes
Financial Disclosure: All authors have declared there are no financial conflicts of interest in regards to this work.
References
- 1.Baecher-Allan C, Viglietta V, Hafler DA. Human CD4+CD25+ regulatory T cells. Semin Immunol. 2004;16:89–98. doi: 10.1016/j.smim.2003.12.005. [DOI] [PubMed] [Google Scholar]
- 2.Fehervari Z, Sakaguchi S. Development and function of CD25+CD4+ regulatory T cells. Curr Opin Immunol. 2004;16:203–8. doi: 10.1016/j.coi.2004.01.004. [DOI] [PubMed] [Google Scholar]
- 3.Marshall NA, Christie LE, Munro LR, et al. Immunosuppressive regulatory T cells are abundant in the reactive lymphocytes of Hodgkin lymphoma. Blood. 2004;103:1755–62. doi: 10.1182/blood-2003-07-2594. (2004) [DOI] [PubMed] [Google Scholar]
- 4.Woo EY, Chu CS, Goletz TJ, et al. Regulatory CD4+CD25+ T cells in tumors from patients with early-stage non-small cell lung cancer and late-stage ovarian cancer. Cancer Res. 2001;61:4766–72. [PubMed] [Google Scholar]
- 5.Liyanage UK, Moore TT, Joo HG, et al. Prevalence of regulatory T cells is increased in peripheral blood and tumor microenvironment of patients with pancreas or breast adenocarcinoma. J Immunol. 2002;169:2756–61. doi: 10.4049/jimmunol.169.5.2756. [DOI] [PubMed] [Google Scholar]
- 6.Curiel TJ, Coukos G, Zou L, et al. Specific recruitment of regulatory T cells in ovarian carcinoma fosters immune privilege and predicts reduced survival. Nat Med. 2004;10:942–9. doi: 10.1038/nm1093. [DOI] [PubMed] [Google Scholar]
- 7.Bates GJ, Fox SB, Han C, et al. Quantification of regulatory T cells enables the identification of high-risk breast cancer patients and those at risk of late relapse. J Clin Oncol. 2006;24:5373–80. doi: 10.1200/JCO.2006.05.9584. [DOI] [PubMed] [Google Scholar]
- 8.Kobayashi N, Hiraoka N, Yamagumi W, et al. FOXP3+ regulatory T cells affect the development and progression of hepatocarcinogenesis. Clin Cancer Res. 2007;13:902–11. doi: 10.1158/1078-0432.CCR-06-2363. [DOI] [PubMed] [Google Scholar]
- 9.Mempel TR, Khazaie PK, Weninger W, et al. Regulatory T cells reversibly suppress cytotoxic T cell function independent of effector differentiation. Immunity. 2006;25:129–41. doi: 10.1016/j.immuni.2006.04.015. [DOI] [PubMed] [Google Scholar]
- 10.Chen ML, Pittet MJ, Gorelik L, et al. Regulatory T cells suppress tumor-specific CD8 T cell cytotoxicity through TGF-beta signals in vivo. Proc Natl Acad Sci USA. 2005;102:419–24. doi: 10.1073/pnas.0408197102. [DOI] [PMC free article] [PubMed] [Google Scholar]
- 11.Nishikawa H, Jager E, Ritter G, Old LJ, Gnjatic S. CD4+ CD25+ regulatory T cells control the induction of antigen-specific CD4+ helper T cell responses in cancer patients. Blood. 2005;106:1008–11. doi: 10.1182/blood-2005-02-0607. [DOI] [PubMed] [Google Scholar]
- 12.Fontenot JD, Rudenski AY. A well adapted regulatory contrivance: regulatory T cell development and the forkhead family transcription factor Foxp3. Nat Immunol. 2005;6:331–7. doi: 10.1038/ni1179. [DOI] [PubMed] [Google Scholar]
- 13.Fontenot JD, Gavin MA, Rudensky AY. Foxp3 programs the development and function of CD4+CD25+ regulatory T cells. Nat Immunol. 2003;4:330–6. doi: 10.1038/ni904. [DOI] [PubMed] [Google Scholar]
- 14.Hori S, Nomura T, Sakaguchi S. Control of regulatory T cell development by the transcription factor Foxp3. Science. 2003;299:1057–61. doi: 10.1126/science.1079490. [DOI] [PubMed] [Google Scholar]
- 15.Khattri R, Cox T, Yasayko SA, Ramsdell F. An essential role for Scurfin in CD4+CD25+ T regulatory cells. Nat Immunol. 2003;4:337–42. doi: 10.1038/ni909. [DOI] [PubMed] [Google Scholar]
- 16.McHugh RS, Whitters MJ, Piccirillo CA, et al. CD4+CD25+ immunoregulatory T cells gene expression analysis reveals a functional role for the glucocorticoid-induced TNF receptor. Immunity. 2002;16:311–323. doi: 10.1016/s1074-7613(02)00280-7. [DOI] [PubMed] [Google Scholar]
- 17.Takahashi T, Tagami T, Yamazaki S, et al. Immunologic self-tolerance maintained by CD25+ CD4+ regulatroy T cells constitutively expressing cytotoxic T lymphocyte-associated antigen 4. J Exp Med. 2000;192:303–9. doi: 10.1084/jem.192.2.303. [DOI] [PMC free article] [PubMed] [Google Scholar]
- 18.Yamaguchi T, Hirota K, Nagahama K, et al. Control of immune responses by antigen-specific regulatory T cells expressing the folate receptor. Immunity. 2007;27:145–59. doi: 10.1016/j.immuni.2007.04.017. [DOI] [PubMed] [Google Scholar]
- 19.Knutson KL, Dang Y, Lu H, et al. IL-2 immunotoxin therapy modulates tumor-associated regulatory T cells and leads to lasting immune-mediated rejection of breast cancers in neutransgenic mice. J Immunol. 2006;177:84–91. doi: 10.4049/jimmunol.177.1.84. [DOI] [PubMed] [Google Scholar]
- 20.Dannull J, Su Z, Rizzieri D, et al. Enhancement of vaccine-mediated antitumor imunity in cancer patients after depletion of regulatory T cells. J Clin Invest. 2005;115:3623–33. doi: 10.1172/JCI25947. [DOI] [PMC free article] [PubMed] [Google Scholar]
- 21.Litzinger MT, Fernando R, Curiel TJ, Grosenbach DW, Schlom J, Palena C. IL-2 immunotoxin denileukin difitox reduces regulatory T cells and enhances vaccine-mediated T-cell immunity. Blood. 2007;110:3192–201. doi: 10.1182/blood-2007-06-094615. [DOI] [PMC free article] [PubMed] [Google Scholar]
- 22.Curiel TJ, Barnett B, Kryczek I, Cheng P, Zou W. Regulatory T cells in ovarian cancer: biology and therapeutic potential. Am J Reprod Immunol. 2005;54:369–77. doi: 10.1111/j.1600-0897.2005.00330.x. [DOI] [PubMed] [Google Scholar]
- 23.Shimizu J, Yamazaki S, Sakaguchi S. Induction of tumor immunity by removing CD25+CD4+ T cells: a common bais between tumor immunity and autoimmunity. J Immunol. 1999;163:5211–18. [PubMed] [Google Scholar]
- 24.Olsen E, Duvic M, Frankel A, et al. Pivotal Phase III Trial of Two Dose Levels of Denileukin Diftitox for the Treatment of Cutaneous T-Cell Lymphoma. J Clin Oncol. 2001;19:376–88. doi: 10.1200/JCO.2001.19.2.376. [DOI] [PubMed] [Google Scholar]
- 25.Stephens LA, Gray D, Anderton ST. CD4+CD25+ regulatory T cells limit the risk of autoimmune disease arising from T cell receptor crossreactivity. Procl Natl Acad USA. 2005;102:17418–23. doi: 10.1073/pnas.0507454102. [DOI] [PMC free article] [PubMed] [Google Scholar]
- 26.Colombo MP, Piconese S. Regulatory T-cell inhibition versus depletion: the right choice in cancer immunotherapy. Nat Rev Canc. 2007;7:880–7. doi: 10.1038/nrc2250. [DOI] [PubMed] [Google Scholar]
- 27.Setoguchi R, Hori S, Takahashi T, Sakaguchi S. Homeostatic maintenance of natural Foxp3+CD25+CD4+ regulatory T cells by interleukin (IL)-2 and induction of autoimmune disease by IL-2 neutralization. J Exp Med. 2005;201:723–35. doi: 10.1084/jem.20041982. [DOI] [PMC free article] [PubMed] [Google Scholar]
- 28.Fontenot JD, Rasmussen JP, Gavin MA, Rudensky AY. A function for interleukin 2 in Foxp3-expressing regulatory T cells. Nat Immunol. 2005;6:1142–51. doi: 10.1038/ni1263. [DOI] [PubMed] [Google Scholar]
- 29.Thornton AM, Donovan EE, Piccirillo CA, Shevach EM. Cutting Edge: IL-2 is critically required for the in vitro activation of CD4+CD25+ T cell suppressor function. J Immunol. 2004;172:6519–23. doi: 10.4049/jimmunol.172.11.6519. [DOI] [PubMed] [Google Scholar]
- 30.Yu A, Malek TR. Selective availability of IL-2 is a major determinant controlling the production of CD4+CD25+Foxp3+ T regulatory cells. J Immunol. 2006;177:5115–21. doi: 10.4049/jimmunol.177.8.5115. [DOI] [PubMed] [Google Scholar]
- 31.Rao BM, Driver I, Lauffenburger DA, Wittrup KD. High-affinity CD25-binding IL-2 mutants potently stimulate persistent T cell growth. Biochemistry. 2005;44:10696–701. doi: 10.1021/bi050436x. [DOI] [PubMed] [Google Scholar]
- 32.Krutzik PO, Nolan GP. Intracellular phospho-protein staining techniques for flow cytometry: monitoring single cell signaling events. Cytometry A. 2003;55:61–70. doi: 10.1002/cyto.a.10072. [DOI] [PubMed] [Google Scholar]
- 33.Maier LM, Anderson DE, De Jager PL, Wicker LS, Hafler DA. Allelic variant in CTLA4 alters T cell phosphorylation patterns. Proc Natl Acad Sci USA. 2007;104:18607–12. doi: 10.1073/pnas.0706409104. [DOI] [PMC free article] [PubMed] [Google Scholar]
- 34.Wang X, Rickert M, Garcia KC. Structure of the quaternary complex of Interleukin-2 with its α, β, and γc receptors. Science. 2005;310:1159–63. doi: 10.1126/science.1117893. [DOI] [PubMed] [Google Scholar]
- 35.Stauber DJ, Debler EW, Horton PA, Smith KA, Wilson IA. Crystal structure of the IL-2 signaling complex: paradigm for a heterotrimeric cytokine receptor. Procl Natl Acad Sci USA. 2006;103:2788–93. doi: 10.1073/pnas.0511161103. [DOI] [PMC free article] [PubMed] [Google Scholar]
- 36.Cassell DJ, Choudhri S, Humphrey R, Martell RE, Reynolds T, Shanafelt AB. Therapeutic enhancement of IL-2 through molecular design. Curr Pharm Des. 2002;8:2171–83. doi: 10.2174/1381612023393260. [DOI] [PubMed] [Google Scholar]
- 37.Shanafelt AB, Lin Y, Shanafelt MC, et al. A T-cell-selective interleukin 2 mutein exhibits potent antitumor activity and is well tolerated in vivo. Nat Biotechnol. 2000;18:1197–202. doi: 10.1038/81199. [DOI] [PubMed] [Google Scholar]
- 38.Collins L, Tsien WH, Seals J, et al. Identification of specific residues of human interleukin 2 that affect binding to the 70-kDa subunit (p70) of the interleukin 2 receptor. Proc Natl Acad Sci USA. 1988;85:7709–13. doi: 10.1073/pnas.85.20.7709. [DOI] [PMC free article] [PubMed] [Google Scholar]
- 39.Eckenberg R, Xu D, Moreau JL, et al. Analysis of human IL-2/IL-2 receptor β chain interactions: monoclonal antibody H2-8 and new IL-2 mutants define the critical role of α helix-A of IL-2. Cytokine. 1997;9:488–98. doi: 10.1006/cyto.1996.0192. [DOI] [PubMed] [Google Scholar]
- 40.Buchli P, Ciardelli T. Structural and biologic properties of a human aspartic acid-126 Interleukin-2 analog. Arch Biochem Biophys. 1993;307:411–15. doi: 10.1006/abbi.1993.1608. [DOI] [PubMed] [Google Scholar]
- 41.Liang SM, Thatcher DR, Liang CM, Allet B. Studies of structure-activity relationships of human interleukin-2. J Biol Chem. 1986;261:334–37. [PubMed] [Google Scholar]
- 42.Liparoto SF, Myszka DG, Wu Z, Goldstein B, Laue TM, Ciardelli TL. Analysis of the role of the Interleukin-2 receptor γ chain in ligand binding. Biochemistry. 2002;41:2541–51. doi: 10.1021/bi011692m. [DOI] [PubMed] [Google Scholar]
- 43.Bensinger SJ, Walsh PT, Zhang J, et al. Distinct IL-2 receptor signaling pattern in CD4+CD25+ regulatory T cells. J Immunol. 2004;172:5287–96. doi: 10.4049/jimmunol.172.9.5287. [DOI] [PMC free article] [PubMed] [Google Scholar]
- 44.Smith KA. The Interleukin 2 receptor. Annu Rev Cell Biol. 1989;5:397–425. doi: 10.1146/annurev.cb.05.110189.002145. (1989) [DOI] [PubMed] [Google Scholar]
- 45.Cheng Y, Prusoff WH. Relationship between the inhibition constant (KI) and the concentration of inhibitor which causes 50 per cent inhibition (I50) of an enzymatic reaction. Biochem Pharmacol. 1973;22:3099–108. doi: 10.1016/0006-2952(73)90196-2. [DOI] [PubMed] [Google Scholar]
- 46.Saragovi H, Malek TR. Direct identification of the murine IL-2 receptor p55-p75 heterodimer in the absence of IL-2. J Immunol. 1988;141:476–82. [PubMed] [Google Scholar]
- 47.Goldstein B, Jones D, Kevrekidis IG, Perelson AS. Evidence for p55-p75 heterodimers in the absence of IL-2 from Scatchard plot analysis. Int Immunol. 1992;4:23–32. doi: 10.1093/intimm/4.1.23. [DOI] [PubMed] [Google Scholar]
- 48.Roessler E, Grant A, Ju G, Tsudo M, Sugamura K, Waldmann TA. Cooperative interactions between the interleukin 2 receptor α and β chains alter the interleukin 2-binding affinity of the receptor subunits. Proc Natl Acad Sci USA. 1994;91:3344–7. doi: 10.1073/pnas.91.8.3344. [DOI] [PMC free article] [PubMed] [Google Scholar]
- 49.Fallon EM, Liparoto SF, Lee KJ, Ciardelli TL, Lauffenburger DA. Increased endosomal sorting of ligand to recycling enhances potency of an interleukin-2 analog. J Biol Chem. 2000;275:6790–7. doi: 10.1074/jbc.275.10.6790. [DOI] [PubMed] [Google Scholar]
Associated Data
This section collects any data citations, data availability statements, or supplementary materials included in this article.
Supplementary Materials
Antagonist Dose Response for pSTAT5 in primary human Treg cells characterized by expression of CD4 and FoxP3. Flow histograms for each antagonist treatment series are shown. Wild type IL-2 is used at a concentration of 40 pM wild type IL-2, and ratios given are molar ratios of wild type IL-2 to antagonist. Data are representative of three independent experiments.
Antagonism by Q126T and V91R. The two mutants, Q126T and V91R, were assayed for antagonism in the presence of 25 pM wild type IL-2 in a phosphorylated STAT5 assay, where the IC50 values and 95% confidence intervals were determined to be 1.9±0.4 nM Q126T, and 2.4±0.6 nM V91R. Data for each antagonist are combined from two independent experiments. Fluorescence is normalized to the maximum fluorescence of each antagonist as determined by least squares regression. Based on an analysis by the Cheng-Prusoff relationship, these IC50 values correspond to inhibition constant, KI, values of 180 pM for V91R and 140 pM for Q126T.