Abstract
Profiling and imaging MALDI mass spectrometry (MS) allows detection and localization of biomolecules in tissue, of which lipids are a major component. However, due to the in situ nature of this technique, complexity of tissue and need for a chemical matrix, the recorded signal is complex and can be difficult to assign. Ion mobility adds a dimension that provides coarse shape information, separating isobaric lipids, peptides, and oligonucleotides along distinct familial trend lines before mass analysis. Previous work using MALDI-ion mobility mass spectrometry to analyze and image lipids has been conducted mainly in positive ion mode, although several lipid classes ionize preferentially in negative ion mode. This work highlights recent data acquired in negative ion mode to detect glycerophosphoethanolamines (PEs), glycerophosphoserines (PSs), glycerophosphoglycerols (PGs), glycerolphosphoinositols (PIs), glycerophosphates (PAs), sulfatides (STs), and gangliosides from standard tissue extracts and directly from mouse brain tissue. In particular, this study focused on changes in ion mobility based upon lipid head groups, composition of radyl chain (# of carbons and double bonds), diacyl versus plasmalogen species, and hydroxylation of species. Finally, a MALDI-ion mobility imaging run was conducted in negative ion mode, resulting in the successful ion mapping of several lipid species.
Introduction
Tissue profiling and mass spectrometry imaging (MSI) by matrix-assisted laser desorption/ionization mass spectrometry (MALDI-MS) has enabled the direct analysis and localization of biomolecules (proteins and peptides) while maintaining the anatomical integrity of the tissue.1–3 Recently, the use of tissue profiling and MSI has grown rapidly in the field of lipidomics.4–7 Ion mobility (IM) mass spectrometry is a robust method that allows for the rapid separation and detection of a wide range of biologically important compounds.8–10 The coupling of MALDI-MS with IM spectrometry (MALDI-IM MS) has allowed for a variety of samples to be analyzed and offers the potential for real-time separation, which operates within the several hundred microsecond time interval between the application of each focused laser desorption pulse to the sample.10–13 In one study14, MALDI-IM MS was used to analyze and separate complex mixtures of phospholipids in positive mode. The change in phospholipids’ ion drift time was shown to be dictated by the following factors: 1) radyl chain length and its degree of unsaturation, 2) head group type, and 3) type of cationization (salt adducts) of individual species. Additional work has successfully used ion mobility mass spectrometry to analyze mixtures of most major classes of phospholipids and sphingolipids.15–19
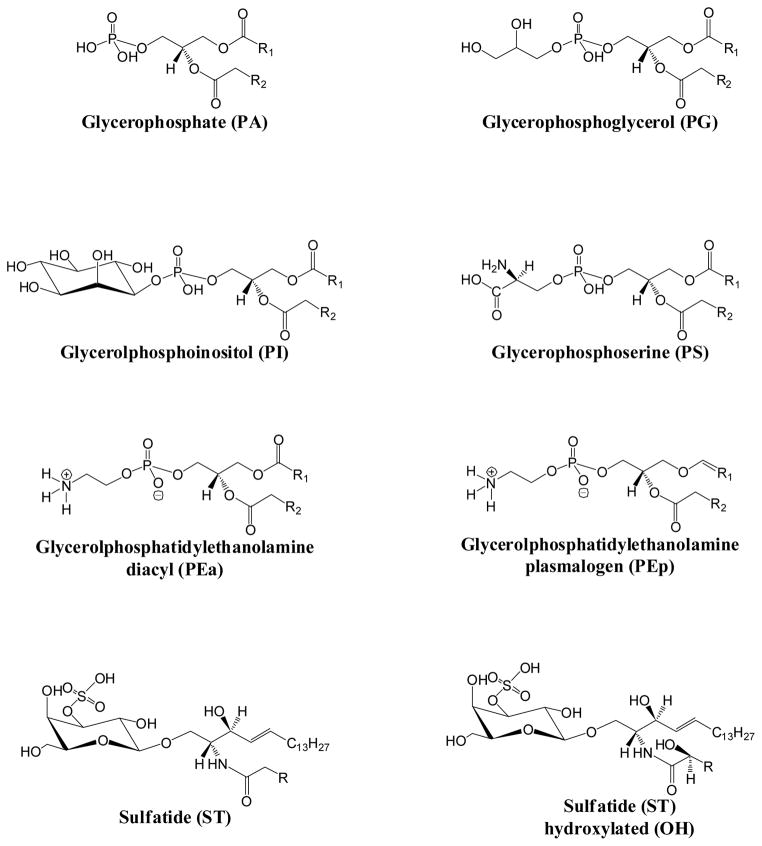
Due to the in situ nature of direct tissue analysis and the complex composition of tissue, MALDI-IM MS offers a distinct advantage for lipids analysis in tissue by separating lipid species by ion mobility prior to mass analysis. The first study to demonstrate this used MALDI-IM MS to profile phospholipids in a rat brain tissue section.20 In this study, nine different species of phospholipids were assigned in positive ion mode. Additional studies profiled cocaine, phospholipids, and gangliosides from rat brain.17,21 MSI by MALDI-IM MS was quick to follow tissue profile studies and has been successful in mapping lipids in brain tissue, breast tumor models, and mouse spleen.22–25 To date most studies of lipids by MALDI-IM MS have analyzed samples in positive ion mode. One drawback to this is that studies have shown that in positive ion mode phosphatidylcholines and sphingomyelins (both contain a positively charged quaternary ammonium group) suppress the detection of other lipid classes.26,27 Additionally, several classes of lipids ionize more readily in negative ion mode28 based on their structure (Figure 1) and in one recent study29 both a PI and ST specie were imaged from brain tissue using MALDI-IM MS in negative ion mode. Herein, MALDI-IM MS is used to simultaneously separate and analyze several classes of negatively ionized lipids from spot profiles and images from standards and tissues. Mobility drift times are tabulated and intercompared between the following lipids: glycerophosphoethanolamines (PEs), glycerophosposerines (PSs), glycerophosphoglycerols (PGs), glycerolphosphoinositols (PIs), glycerophosphates (PAs), sulfatides (STs), and gangliosides in negative ion mode. Additionally, MSI with MALDI-IM MS was employed to image several lipid species from mouse cerebrum in negative ion mode. The results from these experiments and their implications for future tissue imaging are presented below.
Figure 1.
Lipid Structures
Material and Methods
Mass Spectrometer
Data were acquired with a periodic focusing MALDI-IM-TOFMS instrument in negative ion mode (IM-oTOF™ Ionwerks, Inc., Houston, TX). A mobility resolution of 25 (FWHM of drift time) and a mass resolution of 3000 for m/z 1000 are routinely achieved on calibration standards. The length of the mobility cell is ~17 cm with 56 electrodes, operating at ~2000v and filled with 1.4 mbar helium gas. The cell electrodes are configured as a large gap (3.1mm) and small gap (1.55m) pair, producing an electric field gradient of 115 v/cm across each large gap and 230 v/cm across each small gap. The clearance time from the IM drift cell of singly charged ions smaller than 2 kDa is less than 500 microseconds which in principle allows laser pulse rates of 2kHz to be achieved; however, for convenience a 200 Hz pulse rate from a Nd:YLF UV laser (λ = 349 nm) was used in these experiments. An X-Y sample stage (National Aperture Inc., Salemn, NH, folded micro-stage, model MM-3M-F-2) provides 1 μm accuracy in beam positioning and sample scanning. The integral ion mobility spot profile separation of lipids occurred in hundreds of microseconds, while the total signal acquisition time lasted from 0.5 to 2 minutes depending on analyte concentration. For MALDI-IM imaging experiments in this paper, a 100 micron spatial resolution and a 3 sec acquisition time per step was used. At present technical issues such as large file sizes preclude the use of integral mobility to capture the IM separated mass spectrometry of all ions present from each pixel location. Thus for the imaging experiments presented in this paper the drift cell is operated in a differential mode by establishing offsets in both mass and mobility data acquisition parameters. These choices of parameter limit the incoming data to a usable mass range of approximately 100 Da and a mobility drift time range spanning approximately 16μs (at m/z=800). The region of interest mass bins and corresponding intensities are saved to a file along with the positional coordinates.
Data are presented as 2D contour plots of ion intensity as a function of drift time (y-axis) and m/z (x-axis). In addition, the derived 1D ion mobility spectrum and 1D mass spectrum for each MALDI-IM spectrum are also included. In the 2D contour plots of drift time versus m/z, compounds that have the same molecular weight but different structures are observed along ion groupings which have different slopes. The values reported for the m/z and drift time for individual lipid species are based upon a centroid calculation of the (boxcar-averaged) smoothed 2D signal, giving the center-of-mass for a particular 2D ion intensity distribution. All contour plots were produced using IDL software (Exelis Visual Information Solutions, Boulder, CO).
Lipid Extracts
The following lipid extracts: PAs from chicken egg, PEs from porcine brain, PGs from chicken egg, PIs from bovine liver, PSs from porcine brain, and STs from porcine brain were purchased from Avanti Polar Lipids (Alabaster, AL). Stock solutions of the lipids were prepared in chloroform:methanol (2:1 v/v) at a concentration of 10 nmol/μL.
Matrix
2,6-dihydroxyacetophenone (DHA) was used as the MALDI matrix. For lipid extracts, saturated DHA was mixed with 3 mM ammonium sulfate and 0.05% heptafluorobutyric acid in 50% ethanol, while for direct tissue analysis and imaging saturated DHA was mixed with 125 mM ammonium sulfate and 0.05% heptafluorobutyric acid in 50% ethanol. The addition of HFBA has been shown to improve DHA’s lifetime under vacuum and the ammonium sulfate aids in displacing salt adducts.30
Tissue Sectioning and Handling
All the animal use and handling in this work abides by the Guide for the Care and Use of Laboratory Animals (NIH). Mice were euthanized with isoflurane and were decapitated upon cessation of respiration. The brains were quickly removed from the skull and frozen in dry ice-chilled isopentane for no more than 10 seconds, prior to storage at −80°C. The frozen mice brains were transferred from −80°C to the cryostat chamber (CM 3050 S; Leica Microsystems Nussloch GmbH, Nussloch, Germany) at −20°C. The tissue samples were attached to the cryostat sample stages using ice slush made from distilled water. This procedure has been described in detail previously.20 The brains were cut into 16 μm sections and placed onto the MALDI sample targets. The plates were stored at −80°C until analysis.
Sample Preparation
Lipid extract stock solutions were diluted to 500 pmols/μL in DHA matrix solution and 0.5 μL was deposited onto the MALDI sample target. For MALDI imaging, tissue sections were sprayed with matrix using an artistic air brush.31 To improve the matrix coating and limit evaporation, the spraying was done in a cold room (+ 4°C).
Lipid Assignment
Assignment of lipid species was as follows: PA, PG, PI, and PS species numbering equal the total length and number of double bonds of both radyl chains, while ST species numbering corresponds to the length and number of double bonds of the acyl chain attached to the sphingosine base. PE species equal the total length and number of both radyl chains with a representing diacyl species and p representing plasmalogen species.
Results and Discussions
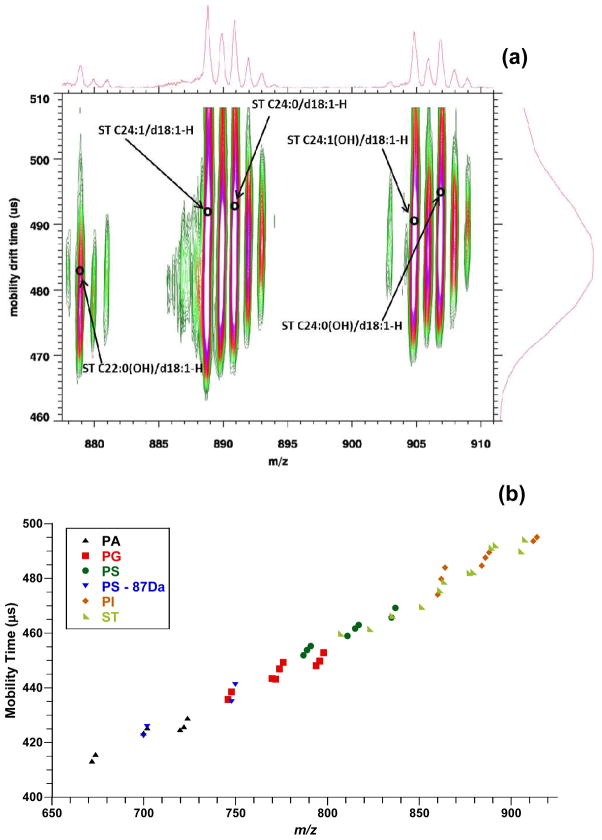
Initial studies were conducted on standard tissue extracts for different classes of glycerolphospholids and sphingolipids in negative ion mode to record their mobility time and molecular weight. Figure 2a illustrates a MALDI-IM MS spectrum of brain ST extracts in negative ion mode with DHA matrix. Five species of sulfatides (ST C22:0(OH)/d18:1, ST C24:1/d18:1, ST C24:0/d18:1, ST C24:1(OH)/d18:1, ST C24:0(OH)/d18:1) were detected as [M-H]− ions in the m/z range shown. As observed previously for other lipid classes by IM-MS in positive ion mode, an increase in mobility time parallels the increase in saturation of the acyl chain (i.e. decrease in the number of double bonds).14–16,18 In one study it was suggested that the variation in collision cross section (and thus in drift time) for lipids with acyl chains containing different degrees of unsaturation can be explained by the fact that the presence of an unsaturated double bond causes the chain to bend.14 As a result, the molecule is less elongated, thus the collision cross section is smaller. Additionally, sulfatides can be hydroxylated on their acyl chain, which causes the mobility time to shift horizontally when compared to change in the length of the acyl chain. This is observed in Figure 2a when comparing ST C24:1/d18:1 and ST C24:0/d18:1 to ST C24:1(OH)/d18:1 and ST CC24:0(OH)/d18:1, in which there is very little change in mobility time between non-hydroxylated and hydroxylated species. In order to further compare different lipid classes by MALDI IM-MS, assigned M-H peaks for egg PAs, egg PGs, liver PIs, brain PSs, and brain STs were plotted as drift time versus m/z (Figure 2b). Additionally for PS species, [PS – 87Da] mass peaks that corresponds to the loss of the serine head group (C3H5NO2) were also plotted in Figure 2b. PAs exhibit the fastest drift time while PIs and STs had the slowest drift time. When similar fatty acyl chains are considered, the drift time for each group is as follows: PA ≅ PS – 87 Da < PG < PS < ST ≅ PI. These results track the size of the lipid head group fairly well as seen in Figure 1 i.e. the smaller the head groups the faster the mobility (smaller drift time) and the larger the head groups the slower the mobility. Thus, PAs have the fastest mobility due to the fact that only a proton is attached to its phosphate at the sn-3 position while PIs have one of the slowest mobility due to the large inositol group attached to its phosphate at the sn-3 position. Analyzing the lipid classes in negative ion mode allowed for easier comparison between classes when compared to previous MALDI-IM studies, due to the fact that the majority of lipid signals were recorded as [M-H]− ions in contrast to positive ion mode data where multiple salt adducts are observed for acidic lipid classes such as PSs and PIs.14 A table containing the lipid assignments with their drift time and m/z values used for Figure 2b is provided in the supplemental data section for this paper. The data provided from these tissue extract standards was used to identify lipid species present in mouse brain tissue sections.
Figure 2.
(a) MALDI-IM 2D plot of brain STs. (b) Plot of drift time versus m/z of egg PA, egg PG, brain PS, liver PI, and brain ST extracts with DHA matrix.
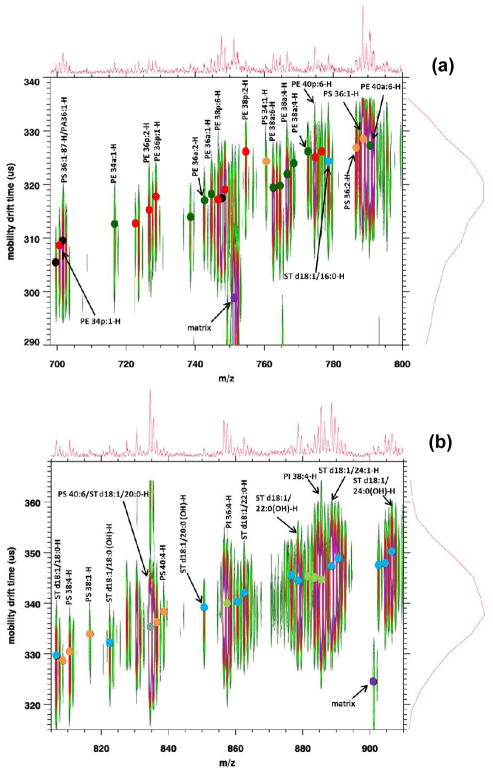
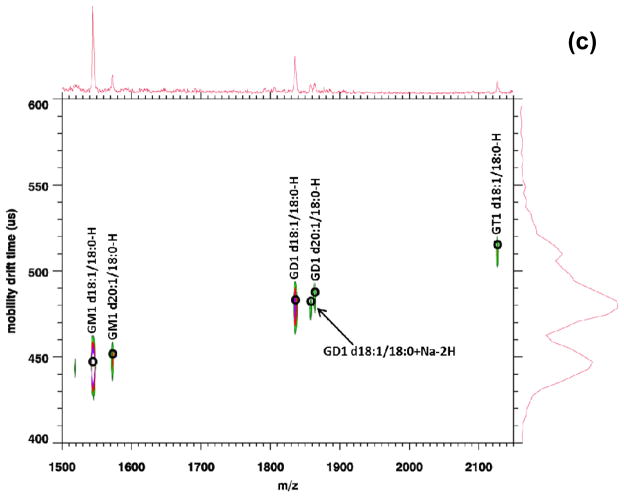
To test the utility of MALDI IM-MS in negative ion mode to analyze complex mixtures of lipids, direct tissue analysis was conducted on mouse brain sections. Figure 3 displays a MALDI-IM 2D plot of mouse brain tissue in negative ion mode with DHA matrix. In order to better view the data, the plot was divided into three m/z ranges (a) 698–800, (b) 800–910, (c) 1500–2150. A total of 51 lipid species were assigned from the spectrum in Figure 3, consisting of 19 PEs (10 diacyls and 9 plasmalogen species), 9 PSs, 4 PIs, 14 STs (8 non-hydroxylated and 6 hydroxylated species), and 5 gangliosides (2 GM1, 2 GD1, and 1 GT1). Five additional mass peaks were assigned but due to the in-source fragmentation and lose of the serine head group from PS species, PA species were unable to be conclusively identify and thus these peaks were labeled as PA/PS-87 Da. A complete list of lipid assignments with drift time and m/z values for Figure 3 is provided in the supplemental data.
Figure 3.
MALDI-IM 2D plot of mouse cerebrum (a) m/z range: 698–800, (b) m/z range: 800–910, (c) m/z range: 1500–2150.
Figure 3a shows the m/z range (698–800) and contains mass peaks mainly associated with PEs and PSs. PEs are one of the most abundant glycerophospholipid classes in brain tissue. In addition to the basic diacyl (a) species of glycerophospholipids, in which two acyl groups are attached to the sn-1 and sn-2 position of the glycerol backbone, PE also contain plasmalogen (p) species, in which a vinyl ether group instead of an acyl group is attached to the sn-1 position. Similar to hydroxylated STs, the mobility drift time is shifted horizontally between plasmalogen and diacyl species with the same fatty acid chain length and carbon double bonds when compared to the shift in drift time for a change in fatty acid composition. The lipid specie at m/z 774 could either be PE 38a:0 or PE 40p:6. However, if the specie was PE 38a:0, the drift time should increase but instead the drift time actually decreased and the specie corresponds well to the expected mobility shift associated with the series of plasmalogen species (PE 40p:6-PE 40p:5) recorded in the figure. Based upon these data, the ion at m/z 774 was labeled as PE 40p:6. This response for PEs has also been observed by MALDI-IM MS in positive ion mode.14 Figure 3b displays the m/z range (800–910) with several mass peaks associated with PSs, PIs, and STs being detected.
Gangliosides are complex glycosphingolipids that contain one or more negatively charged sialic acids, N-acetylneuraminic acid, (GM1 = 1 sialic acid, GD1 = 2 sialic acids, GT1 = 3 sialic acids). Figure 3c shows the m/z range for ganglioside species detected in mouse brain tissue and five species were detected (GM1 d18:1/18:0, GM1 d20:1/18:0, GD1 d18:1/18:0, GD1 d20:1/18:0, GT1 d18:1/18:0) as [M-H]− peaks. GM1, GD1, and GT1 are the main gangliosides in the central nervous systems of mammals and represent 80–90% of total gangliosides.32 As can be seen in Figure 3c, ganglioside species were able to be separated by the number of sialic acid residues by the increase in mobility time corresponding to the increase in the number of sialic acids. GD1 gangliosides are actually composed of two structural isomers, GD1a, containing two silaic acids one attached to the terminal galactose residue and one to the first galactose residue in its oligosaccharide head, and GD1b where the two silaic acids are attached to the first galactose residue in the oligosaccharide head. Standards of both GD1a and GD1b were analyzed (Data not shown). However, the two isomers (GD1a and GD1b) were not able to be separated based upon the mobility time of their [M-H]− peaks and thus their corresponding peaks in tissue were labeled as GD1.
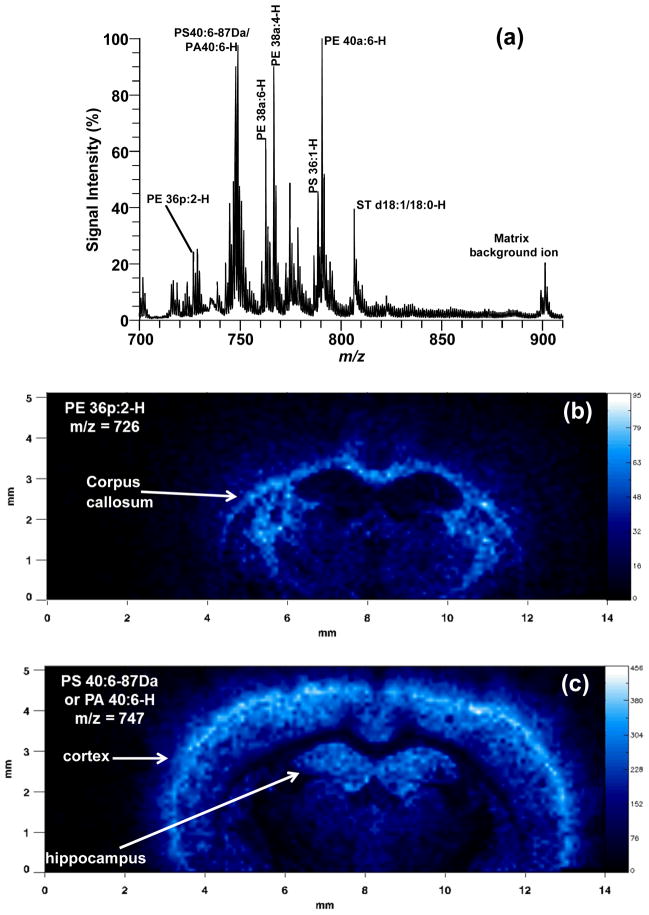
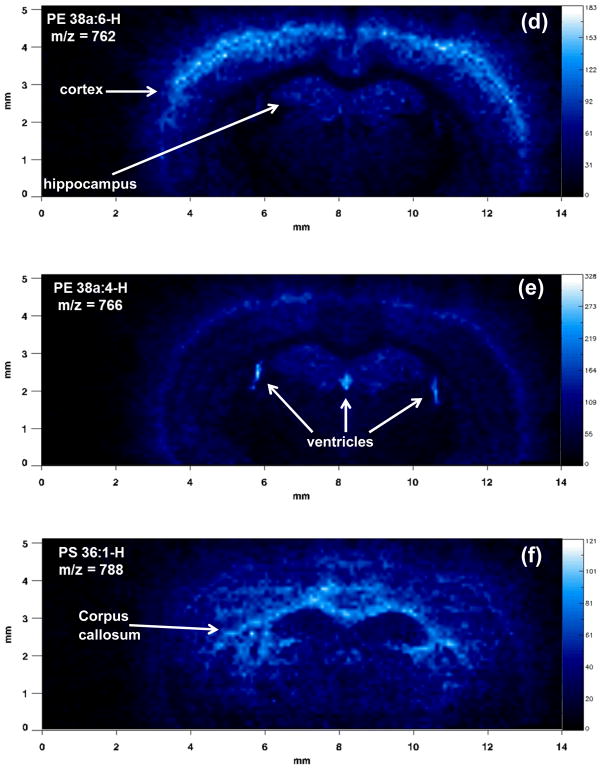
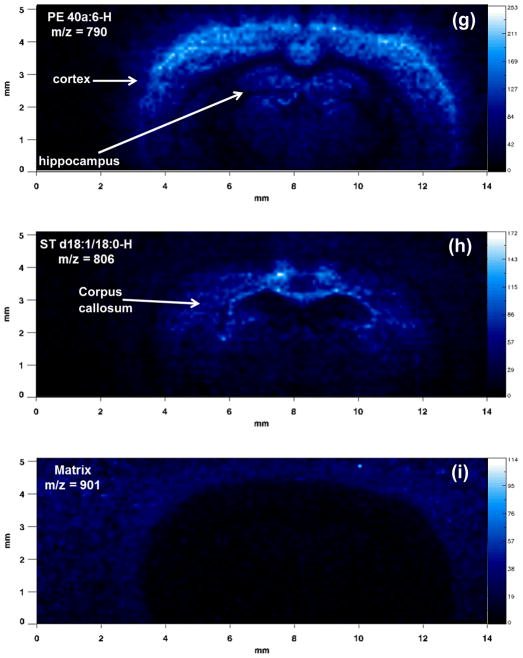
Figure 4 shows the results of a MALDI-IM imaging run obtained with DHA matrix from a mouse cerebrum in negative ion mode. A mass range of 685–955 and a mobility drift time of 320 μs were used to acquire the data in Figure 4. The total 1D mass spectrum for the imaging run is shown in Figure 4a. Major lipid peaks in the mass spectrum correspond to PE 36p:2, PS 40:6–87Da/PA 40:6, PE 38a:6, PE 38a:4, PS 36:1, PE 40a:6, and ST d18:1/18:0. Clear anatomical regions were visualized in the ion images of individual lipid species (Figures 4b–h) mainly tracking white versus grey matter regions. Lipids concentrated in the corpus callosum, a white matter region, were PE 36p:2 (Fig. 4b), PS 36:1 (Fig. 4f), and ST d18:1/18:0 (Fig. 4h). Grey matter regions such as the cerebral cortex and hippocampus contained higher amounts of the following lipid species: PS 40:6–87Da or PA 40:6 (Fig. 4c), PE 38a:6 (Fig. 4d), PE 40a:6 (Fig. 4g). One lipid specie, PE 38a:4 (Fig. 4f) was found in high abundance in the 3 ventricle regions of the cerebrum. Figure 4i shows an ion image for a matrix cluster peak at m/z = 901, which is concentrated on the stainless steel sample plate off of the tissue section. Additionally, this peak is easy to distinguish from the lipid peaks because of the low mobility time for a peak in that mass range, which causes it to be off of the lipid trend line.
Figure 4.
MALDI-IM images using DHA matrix in negative ion mode. (a) 1D mass spectrum obtained from section. Images of (b) PE 36p:2-H at m/z 726, (c) PS 40:6–87Da/PA 40:6-H at m/z 747, (d) PE 38a:6-H at m/z 762, (e) PE 38a:4-H at m/z 766, (f) PS 36:1-H at m/z 788, (g) PE 40a:6-H at m/z 790, (h) ST d18:1/18:0-H at m/z 806, and (i) matrix background ion at m/z 901.
Conclusions
This study is the first time MALDI-IM MS was used in negative ion mode for the analysis of several major classes of lipids. Similar to positive ion mode, MALDI-IM MS allowed for the fast 2D separation of lipid species based upon drift time and m/z in negative ion mode. The change in drift time (i.e. collision cross section of the ion) of lipids was due to the radyl chain length and degree of unsaturation, the head group, and the type of radyl chain (plasmalogen versus diacyl) of individual species. A brief summary of these results are listed in Table 1. Based upon these factors, the identification of lipids species using MALDI-IM MS was able to be simplified and improved. Additionally, the analysis of lipids in negative ion mode further simplified the assignment of acidic lipids by reducing the salt adducts that dominates spectra in positive ion mode. Moreover, direct tissue analysis of lipids in negative ion mode allowed for more acidic (negative) lipid species to be detected and thus imaged when compared to positive ion mode. Future studies will include modification to both the instrument and software to be able to image the whole ion mobility time range instead of the current setup that only allows for an approximately 16μs window. This will greatly increase the number of lipid species imaged and will enable a more complete pre-separation of lipids by mobility prior to mass analysis at the expense of managing ever-enlarging massive file sizes.
Table 1.
Effect of Lipid Structure on Mobility Time.
| Lipid Structure | Effect on Mobility (Drift) Time |
|---|---|
| Head group of lipid | PA ≅ PS – 87 Da < PG < PS < ST ≅ PI for similar radyl chains |
| Increase in radyl chain length | Increase in mobility time |
| Increase in degree of saturation (Decrease in double bonds) | Increase in mobility time |
| Diacyl versus plasmalogen | Little to no change in mobility time for similar radyl chains (Shift horizontally) |
| Hydroxylated versus nonhydroxylated | Little to no change in mobility time for similar radyl chains (Shift horizontally) |
| Increase in # of sialic acids in gangliosides | Increase in mobility time |
Supplementary Material
Acknowledgments
This research was supported by the Intramural Research Program of the National Institute on Drug Abuse, NIH. Ionwerks gratefully acknowledges partial support of this work from NIH SBIR phase II grants 5R44DA030853-and 2R44DA036263-02.
References
- 1.Cornett DS, Reyzer ML, Chaurand P, Caprioli RM. Nat Methods. 2007;4:828–833. doi: 10.1038/nmeth1094. [DOI] [PubMed] [Google Scholar]
- 2.van Hove Amstalden ER, Smith DF, Heeren RMA. J Chromatogr A. 2010;1217:3946–3954. doi: 10.1016/j.chroma.2010.01.033. [DOI] [PubMed] [Google Scholar]
- 3.Seeley EH, Schwamborn K, Caprioli RM. J Biol Chem. 2013;286:25459–25466. doi: 10.1074/jbc.R111.225854. [DOI] [PMC free article] [PubMed] [Google Scholar]
- 4.Jackson SN, Woods AS. J Chromatogr B Analyt Technol Biomed Life Sci. 2009;877:2822–2829. doi: 10.1016/j.jchromb.2008.11.033. [DOI] [PMC free article] [PubMed] [Google Scholar]
- 5.Fernández JA, Ochoa B, Fresnedo O, Giralt MT, Rodríguez-Puertas R. Anal Bioanal Chem. 2011;401:29–51. doi: 10.1007/s00216-011-4696-x. [DOI] [PubMed] [Google Scholar]
- 6.Goto-Inoue N, Hayasaka T, Zaima N, Setou M. Biochim Biophys Acta. 2011;1811:961–969. doi: 10.1016/j.bbalip.2011.03.004. [DOI] [PubMed] [Google Scholar]
- 7.Gode D, Volmer DA. Analyst. 2013;138:1289–1315. doi: 10.1039/c2an36337b. [DOI] [PubMed] [Google Scholar]
- 8.Collins DC, Lee ML. Anal Bioanal Chem. 2002;372:66–73. doi: 10.1007/s00216-001-1195-5. [DOI] [PubMed] [Google Scholar]
- 9.Kanu AB, Dwivedi P, Tam M, Matz L, Hill HH., Jr J Mass Spectrom. 2008;43:1–22. doi: 10.1002/jms.1383. [DOI] [PubMed] [Google Scholar]
- 10.McLean JA, Schultz JA, Woods AS. In: Electrospray and MALDI Mass Spectrometry. 2. Cole RB, editor. Vol. 12. Wiley; Hoboken: 2010. pp. 411–442. [Google Scholar]
- 11.Von Helden G, Wyttenbach T, Bowers MT. Science. 1995;267:1483–1485. doi: 10.1126/science.267.5203.1483. [DOI] [PubMed] [Google Scholar]
- 12.Gillig KJ, Ruotolo B, Stone EG, Russell DH, Fuhrer K, Gonin M, Schultz JA. Anal Chem. 2000;72:3965–3971. doi: 10.1021/ac0005619. [DOI] [PubMed] [Google Scholar]
- 13.Woods AS, Ugarov M, Egan T, Koomen J, Gillig KJ, Fuhrer K, Gonin M, Schultz JA. Anal Chem. 2004;76:2187–2195. doi: 10.1021/ac035376k. [DOI] [PubMed] [Google Scholar]
- 14.Jackson SN, Ugarov M, Post JD, Egan T, Langlais D, Schultz JA, Woods AS. J Am Soc Mass Spectrom. 2008;19:1655–1662. doi: 10.1016/j.jasms.2008.07.005. [DOI] [PMC free article] [PubMed] [Google Scholar]
- 15.Trimpin S, Tan B, Bohrer BC, O’Dell DK, Merenbloom SI, Pazos MX, Clemmer DE, Walker JM. Int J Mass Spectrom. 2009;287:58–69. [Google Scholar]
- 16.Kim HI, Kim H, Pang ES, Ryu EK, Beegle LW, Loo JA, Goddard WA, Kanik I. Anal Chem. 2009;81:8289–8297. doi: 10.1021/ac900672a. [DOI] [PMC free article] [PubMed] [Google Scholar]
- 17.Jackson SN, Colsch B, Egan T, Lewis EK, Schultz JA, Woods AS. Analyst. 2011;136:463–466. doi: 10.1039/c0an00732c. [DOI] [PMC free article] [PubMed] [Google Scholar]
- 18.Kliman M, May JC, McLean JA. Biochimica et Biophysica Acta. 2011;1811:935–945. doi: 10.1016/j.bbalip.2011.05.016. [DOI] [PMC free article] [PubMed] [Google Scholar]
- 19.Shvartsburg AA, Isaac G, Leveque N, Smith RD, Metz TO. J Am Soc Mass Spectrom. 2011;22:1146–1155. doi: 10.1007/s13361-011-0114-z. [DOI] [PMC free article] [PubMed] [Google Scholar]
- 20.Jackson SN, Wang HYJ, Woods AS, Ugarov M, Egan T, Schultz JA. J Am Soc Mass Spectrom. 2005;16:133–138. doi: 10.1016/j.jasms.2004.10.002. [DOI] [PubMed] [Google Scholar]
- 21.Woods AS, Jackson SN. In: Mass Spectrometric Imaging: History, Fundamentals and Protocols. Rubakhin SS, Sweedler JV, editors. Vol. 5. The Humana Press Inc; New York: 2010. pp. 99–111. Methods in Molecular Biology Series vol. 656. [Google Scholar]
- 22.Jackson SN, Ugarov M, Egan T, Post JD, Langlais D, Schultz JA, Woods AS. J Mass Spectrom. 2007;42:1093–1098. doi: 10.1002/jms.1245. [DOI] [PMC free article] [PubMed] [Google Scholar]
- 23.McLean JA, Ridenour WB, Caprioli RM. J Mass Spectrom. 2007;42:1099–1105. doi: 10.1002/jms.1254. [DOI] [PubMed] [Google Scholar]
- 24.Chughtai K, Jiang L, Greenwood TR, Glunde K, Heeren RMA. J Lipid Res. 2013;54:333–344. doi: 10.1194/jlr.M027961. [DOI] [PMC free article] [PubMed] [Google Scholar]
- 25.Snel MF, Fuller M. Anal Chem. 2010;82:3664–3670. doi: 10.1021/ac902939k. [DOI] [PubMed] [Google Scholar]
- 26.Estrada R, Yappert MC. J Mass Spectrom. 2004;39:412–422. doi: 10.1002/jms.603. [DOI] [PubMed] [Google Scholar]
- 27.Petkovic M, Schiller J, Muller M, Benard S, Reichl S, Arnold K, Arnhold J. Anal Biochem. 2001;289:202–216. doi: 10.1006/abio.2000.4926. [DOI] [PubMed] [Google Scholar]
- 28.Woods AS, Wang HYJ, Jackson SN. Curr Pharm Des. 2007;13:3344–3356. doi: 10.2174/138161207782360636. [DOI] [PMC free article] [PubMed] [Google Scholar]
- 29.Woods AS, Jackson SN, Schultz JA. In: Ion Mobility Spectroscopy - Mass Spectrometry: Theory and Applications. Wilkins CL, Trimpin S, editors. Vol. 12. CRC Press; Boco Raton: 2011. pp. 257–268. [Google Scholar]
- 30.Colsch B, Woods AS. Glycobiolgy. 2010;20:661–667. doi: 10.1093/glycob/cwq031. [DOI] [PMC free article] [PubMed] [Google Scholar]
- 31.Colsch B, Jackson SN, Dutta S, Woods AS. ACS Chem Neurosci. 2011;2:213–222. doi: 10.1021/cn100096h. [DOI] [PMC free article] [PubMed] [Google Scholar]
- 32.Schwarz A, Futerman AH. Biochim Biophys Acta. 1996;1286:247–267. doi: 10.1016/s0304-4157(96)00011-1. [DOI] [PubMed] [Google Scholar]
Associated Data
This section collects any data citations, data availability statements, or supplementary materials included in this article.


