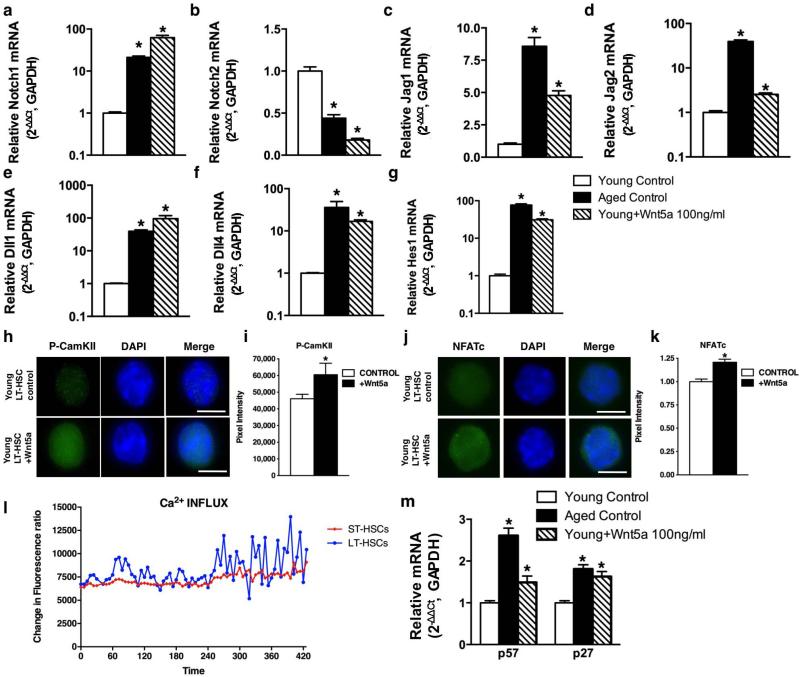
Extended Data Figure 5. Wnt pathways in HSCs and ageing.
a–g, Reverse transcriptase real-time PCR analysis of Notch1, Notch2, Jag1, Jag2, Dll1 (delta like1), Dll4 (delta like 4) and Hes1 transcript levels in young, aged and young Wnt5a-treated (16 h treatment) LT-HSCs. Notch3, Notch4 and Dll3 (delta like 3) transcripts were below detection limits in all the assayed samples. Data are expressed as fold difference compared to the expression in young LT-HSCs arbitrarily set to 1. Data were analysed with the 2−ΔΔCt method and plotted on a logarithmic or linear scale. Bars are mean + 1 s.e.; n = 3, *P < 0.05. h, Representative immunofluorescence picture of p-CamKII (green) expression and localization in young control and young Wnt5a-treated LT-HSCs. Pictures are shown on a dark background and as overlap with DAPI (staining nuclei). Scale bar, 5 μm. i, Relative expression of p-CamKII in young LT-HSCs and on Wnt5a treatment, determined by integration of pixel intensity. *P < 0.05. j, Representative immunofluorescence picture of NFATc (green) expression and localization in young control and young Wnt5a-treated LT-HSCs. Pictures are shown on a dark background and as overlap with DAPI (staining nuclei). Scale bar, 5 μm. k, Relative expression of NAFTc in young LT-HSCs and on Wnt5a treatment, determined by integration of pixel intensity. *P < 0.05. l, Changes in intracellular Ca2+ concentrations in ST-HSCs and LT-HSCs in response to stimulation with Wnt5a as determined by flow cytometry. m, Reverse transcriptase real-time PCR analysis of p57 and p27 transcript levels in young, aged and young Wnt5a-treated (100 ng ml−1, 16 h treatment) LT-HSCs. Data are expressed as fold difference compared to the expression in young LT-HSCs arbitrarily set to 1. Data were analysed with the 2−ΔΔCt method and plotted on a logarithmic or linear scale. Bars are mean + 1 s.e.; n = 3, *P < 0.05.

