Abstract
Increased Ca2+ influx through activated N-methyl-D-aspartate (NMDA) receptors and voltage-dependent Ca2+ channels (VDCC) is a major determinant of cell injury following brain ischemia. The activity of these channels is modulated by dynamic changes in the actin cytoskeleton, which may occur, in part, through the actions of the actin filament–severing protein gelsolin. We show that gelsolin-null neurons have enhanced cell death and rapid, sustained elevation of Ca2+ levels following glucose/oxygen deprivation, as well as augmented cytosolic Ca2+ levels in nerve terminals following depolarization in vitro. Moreover, major increases in infarct size are seen in gelsolin-null mice after reversible middle cerebral artery occlusion, compared with controls. In addition, treatment with cytochalasin D, a fungal toxin that depolymerizes actin filaments, reduced the infarct size of both gelsolin-null and control mice to the same final volume. Hence, enhancement or mimicry of gelsolin activity may be neuroprotective during stroke.
Introduction
Ca2+-ion homeostasis is a key determinant of neuronal injury following both acute and chronic neurodegenerative disorders, including brain ischemia (1–3). Intracellular Ca2+ overload activates several enzymes, including calpain, phospholipase, xanthine oxidase, and neuronal nitric oxide synthase, which are capable of either direct or indirect destruction of cellular structures (1, 2). Massive glutamate release is an early event following brain ischemia, leading to activation of N-methyl-D-aspartate (NMDA) receptors and voltage-dependent Ca2+ channels (VDCC), both of which mediate this excitotoxic Ca2+ influx (1, 2, 4). Activity of these channels can be modified by dynamic changes in the actin cytoskeleton, consistent with a model in which actin filaments compartmentalize channel-regulatory proteins (5, 6). We demonstrated previously that actin depolymerization by the fungal toxin cytochalasin (cyto) D protects neurons from excitotoxicity by stabilizing intracellular calcium levels, [Ca2+]i (7). Therefore, depolymerization of the actin microfilament network in vivo may be a promising approach to prevent neuronal death from NMDA excitotoxicity during cerebral ischemia.)
Gelsolin (gsn) is an 80-kDa actin-binding protein and is the first and most widely expressed member of a family of actin-severing proteins, which includes adseverin and villin (8). After activation by micromolar Ca2+, gelsolin severs actin filaments, reducing actin cytoskeleton integrity, and remains bound to the barbed ends, inhibiting actin filament extension (9). Upon reduction in free Ca2+ to less than micromolar levels, and in the presence of polyphosphoinositides, gelsolin is released from the barbed ends, providing sites for rapid actin filament extension (9). Thus, gelsolin appears to serve a critical role in actin filament dynamics (10–13). Gelsolin is constitutively expressed throughout the central nervous system and is particularly concentrated in neuronal growth cones (14). We demonstrated recently that gelsolin modulates VDCC and NMDA receptor–coupled channel activity and reduces vulnerability to excitotoxicity in cultured hippocampal neurons after its activation by Ca2+ (15). In this report, we explored the possibility that gelsolin could serve as a neuroprotective factor in cerebral ischemia in response to [Ca2+]i by enhancing VDCC- and NMDA-channel rundown.
Methods
Gelsolin knockout mice.
Gross and microscopic anatomy of the brain of gsn–/– mice revealed no overt abnormalities (13). Because the gelsolin-null state is not viable in either pure C57/Bl/6 or BALB/C backgrounds (Witke, W., and Kwiatkowski, D. J., unpublished observations), we used gender-matched littermates from gsn+/– × gsn+/– crosses in a mixed 129/SV × C57BL/6 background for all in vivo experiments. In vitro experiments used littermates from gsn+/– × gsn+/– crosses from both mixed 129/Sv × BALB/C and 129/SV × C57BL/6 backgrounds (13, 15). For immunoblot analyses of gelsolin cleavage, we used male wild-type 129/SVEvTacBR mice (Taconic Farms, Germantown, New York, USA).
Glucose/oxygen deprivation in hippocampal cell cultures.
Hippocampal cell cultures were established from 18-day-old embryos as described previously (15, 16). Hippocampi from each embryo were dissociated by trypsinization and trituration and plated into culture dishes; DNA from the body of each embryo was isolated and used for PCR-based genotyping. Experiments were performed in a blinded fashion. Cells were grown in polyethylenimine-coated plastic or glass bottom 35-mm culture dishes containing Eagle's MEM supplemented with 10% (vol/vol) heat-inactivated FBS, 20 mM KCl, and 1mM pyruvate. Atmosphere consisted of 6% CO2/94% room air and was maintained near saturation. Cells were exposed to 30 min of glucose and oxygen (G/O) deprivation as described previously (15). For controls, medium was changed without G/O deprivation. Cultures were then incubated for an additional 20 h in Locke's solution, and neuronal survival was quantified using a method that has been shown to correlate closely with trypan-blue staining (7, 16, 17). Briefly, neuronal viability was assessed by morphological criteria: cells with intact neurites of uniform diameter and a soma with a smooth round appearance were considered viable, whereas neurons with fragmented neurites and a vacuolated or swollen soma were considered nonviable. Analyses were made in a blinded fashion.
Calcium imaging methods.
Intracellular free Ca2+ levels were quantified by ratiometric imaging of the fluorescent calcium indicator dye fura-2 (Molecular Probes Inc., Eugene, Oregon, USA) as described (18). Briefly, cells were loaded with the acetoxymethylester form of fura-2 (30-min incubation in the presence of 10 mM fura-2/AM), and imaging was performed using a Zeiss AttoFluor system with a 40× oil objective. The average [Ca2+]i in individual neuronal cell bodies was determined from the ratio of the fluorescence emissions obtained using two different excitation wavelengths (334 and 380 nm). The system was calibrated with solutions containing either no Ca2+ or a saturating level of Ca2+ (1 mM) using the formula [Ca2+]i = Kd [(R – Rmin)/Rmax – R0(F0/Fs)] (19).
[Ca2+]i measurement in synaptosomes.
Synaptosomes (torn-off and resealed nerve terminals) were prepared from gsn+/+ or gsn–/– mice according to Gleitz et al. (20), with slight modifications. Briefly, cerebral cortices were homogenized with a Potter-Elvehjem glass homogenizer (900 rpm) in 40 vol (wt/vol) of 0.32 M sucrose. The homogenate was centrifuged (10 min, 1,000 g at 4°C), and the supernatant was frozen and stored at –80°C. After thawing at 37°C, the supernatant was centrifuged (10 min, 12,000 g at 4°C), and the synaptosomal pellet was resuspended in a Ca2+-free buffer (pH 7.4) containing 133 mM NaCl, 4.8 mM KCl, 10 mM HEPES, 1.2 mM Na2HPO4, 1.2 mM MgSO4, and 10 mM glucose. [Ca2+]i was measured by a fluorescence ratiometric method according to Grynkiewicz et al. (19) and Meder et al. (21) using a Perkin-Elmer LS 50B spectrofluorometer (λex = 340/380 nm, λem = 510 nm). The synaptosomal suspension was incubated with fura-2/AM (5 μM) for 35 min at 37°C. Fura-2–loaded synaptosomes were washed and kept on ice until they were used. Aliquots (200 μl) of the washed synaptosomal suspension containing 136 ± 7 μg/ml of protein were diluted with 1.8 ml Ca2+-free buffer (as above) plus 1.3 mM CaCl2. The diluted samples were placed in a quartz cuvette at 37°C and preincubated for 6 min before K+ (30 mM) was added for depolarization. The system was calibrated with Triton X-100 for maximum Ca2+ concentrations and with EGTA for minimum Ca2+ concentrations. [Ca2+]i was calculated as above (19).
Drug administration.
Cyto D (Aldrich Chemical Co., Milwaukee, Wisconsin, USA) was dissolved in 1% DMSO in PBS. Then, 2 μl of the solution or vehicle was administered intracerebroventricularly (bregma –0.9 mm lateral, –0.1 mm posterior, –3.1-mm deep) 10 min before ischemia using a Hamilton syringe (Fisher Scientific Co., Pittsburgh, Pennsylvania, USA) as described (22, 23).
Mouse model of focal cerebral ischemia.
All animal experiments were conducted in accordance with National Institutes of Health and institutional guidelines. Mice (18–23 g) were anesthetized with 1.5% halothane (induction) and maintained on 1.0% halothane in 70% nitrous oxide and 30% oxygen by face mask. Regional cerebral blood flow (rCBF) was measured by Laser-Doppler monitoring using a flexible skull probe as described (22, 24, 25). In randomly selected animals, the left femoral artery was cannulated for arterial blood pressure and blood gas determination as described (22, 24, 25). Arterial blood samples (50 μl) were analyzed for pH, arterial oxygen pressure (PaO2), and partial pressure of carbon dioxide (PaCO2) using a Ciba-Corning 248 PH/blood gas analyzer (Ciba-Corning Diagnostics, Corp. Medfield, Massachusetts, USA). Focal cerebral ischemia was induced by introducing a silicone-coated 8-0 monofilament into the internal carotid artery and advancing it (22, 24, 25). By so doing, the middle cerebral artery was occluded. Two hours later, the filament was completely withdrawn to allow reperfusion. Rectal temperature was controlled and maintained at ∼37°C with a temperature feedback-control unit (Frederick Haer and Co., Brunswick, Maine, USA) and a heating lamp during the monitoring period until 1 h after reperfusion. No differences in rectal temperatures were observed between groups during the monitoring period and after 24 h. Moreover, when we determined temporalis muscle temperature for up to 2 h, and again after 24 h, we did not observe any significant changes between groups (gsn-null mice and cyto D–treated mice) at any time (<± 0.3°C, P > 0.05).
Neurological deficits.
Mice were tested for neurological deficits 30 min and 24 h after induction of ischemia and rated on a scale from 0 (no observable deficit) to 3 (severe) (22, 24, 25). Briefly, failure to extend the forepaw when suspended vertically is graded as mild injury [1], circling to the contralateral side is graded as moderate [2], and loss of circling or righting reflex is graded as severe [3]. Animals were graded by an observer blinded to group identity.
Determination of infarct size.
The animals were sacrificed 22 h or 70 h after reperfusion. The brains were snap-frozen in isopentane for cryostat sectioning or directly divided into five coronal 2-mm sections using a brain matrix (RBM-2000C; Activational Systems, Ann Arbor, Michigan, USA). Infarction areas were quantitated with MCID M4 image analysis software (Imaging Research Inc., St. Catharine's, Ontario, Canada) on 2% 2,3,5 triphenyltetrazoliumchloride–stained 2-mm slices (cyto D experiments with 22 h of reperfusion) or on 20-μm hematoxylin-and eosin–stained cryostat sections (all gsn experiments and cyto D experiments with 70 h of reperfusion). Infarction volume was calculated by summing the volumes of each section directly (25) or indirectly using the following formula: contralateral hemisphere (mm3) – undamaged ipsilateral hemisphere (mm3) (26). The difference between direct and indirect infarct volumes is likely to be accounted for by brain swelling.
Gelsolin Western blotting.
After 2 h of middle cerebral artery (MCA) occlusion and varying times of reperfusion, animals were injected with 200 mg/kg pentobarbital intraperitoneally and transcardially perfused with ice-cold PBS (pH 7.4). Subsequently, brains were cut into 2-mm slices with a brain matrix and placed on a chilled glass plate. Using a dissecting microscope, tissue from the ischemic MCA territory was isolated and snap-frozen in liquid nitrogen along with tissue from corresponding brain regions in the contralateral hemisphere. Samples were stored at –80°C until used. Tissue was homogenized in 10 mM HEPES buffer (pH 7.6) containing 5 mM MgCl2, 1 mM PMSF, 1.5 μM pepstatin, 2 μM leupeptin, 0.7 μM aprotinin, 10 μM N-benzyloxycarbonyl-Asp-Glu-Val-Asp-CHO (DEVD-CHO; En-zyme System Products, Dublin, California, USA), centrifuged at 50,000 g for 30 min, and the supernatant was kept at –80°C until used. Then, 10 μg total protein per sample was subjected to SDS-PAGE and transferred to a polyvinylidene fluoride (PVDF) membrane (Millipore Corp., Bedford, Massachusetts, USA). Blots were blocked with 5% nonfat milk in TBST (50 mM Tris, [pH 7.5], 150 mM NaCl, 0.05% Tween-20) overnight at 4°C and probed with polyclonal gelsolin antiserum at a dilution of 1:10,000 in 5% nonfat milk/TBST as described (27). Immunoblots were then processed with horseradish peroxidase–conjugated anti–rabbit IgG and detected using the enhanced chemiluminescence (ECL) Western blotting detection system kit (Amersham Life Sciences Inc., Arlington Heights, Illinois, USA).
Immunohistochemical staining for calpain-cleaved spectrin, microtubule-associated protein-2, and IgG.
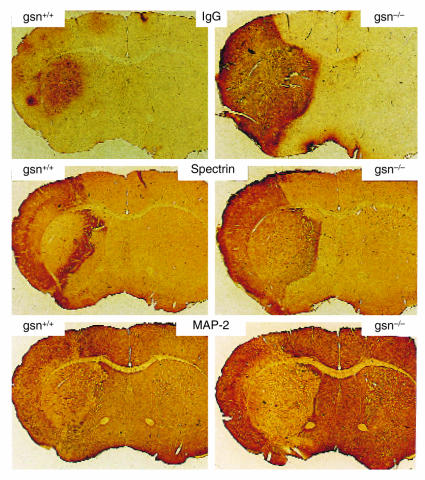
Calpain is activated by intracellular Ca2+ and, in turn, cleaves the cytoskeletal protein spectrin. Ca2+ also causes microtubule-associated protein (MAP)-2 proteolysis. Analyses of spectrin-breakdown products and loss of MAP-2 immunoreactivity therefore can be used as in vivo measures of Ca2+-mediated cell damage. To do so, we performed immunohistochemistry to stain calpain-cleaved spectrin and MAP-2. To evaluate for disruption of the blood–brain barrier, immunohistochemical staining for IgG was performed. Gsn–/– and gsn+/+ mice underwent occlusion of the middle cerebral artery for 2 h as described (four to five animals per group per time period). The rCBF was monitored in all animals. After 1 h or 4 h of reperfusion, animals were sacrificed and immediately perfused transcardially with 4% paraformaldehyde. After removal, brains were immersed in 4% paraformaldehyde. Immunohistochemistry was performed in free-floating sections using methods described previously (28). Sections were incubated for 2 h at room temperature in a solution containing Triton X-100 and 0.015% blocking serum (normal goat serum) in PBS. Primary antibody was then added to a final dilution of either 1:10,000 for the spectrin antibody or 1:5,000 for the MAP-2 antibody, and sections were then incubated overnight at 4°C. Sections were incubated in the presence of horse anti–mouse IgG to detect the presence of endogenous immunoglobulin in brain parenchyma. Sections were then incubated for 1 h in ABC reagent (Vector Laboratories, Burlingame, California, USA), washed in PBS, and incubated for 5 min in diaminobenzidine solution (Vector Laboratories). The primary antibodies were rabbit polyclonal antibodies specific for a calpain-cleavage product of spectrin (a generous gift from R. Siman, Cephalon Inc. West Chester, Pennsylvania, USA) and against MAP-2 (a generous gift from S. Halpain, The Scripps Research Institute, La Jolla, California, USA). Brain sections were photographed under bright-field optics using a 1× objective.
Data analysis.
Values are presented as mean ± SE. Statistical comparisons were performed by unpaired Student's t test or ANOVA followed by Student's t test, Scheffe's test, or Tukey's test as indicated. For comparisons of neurological deficits, a nonparametric test (Mann-Whitney rank sum test) was used. P < 0.05 was considered significant.
Results
Neuronal survival is reduced and intracellular Ca2+ levels elevated after glucose and oxygen deprivation in hippocampal neurons lacking gelsolin.
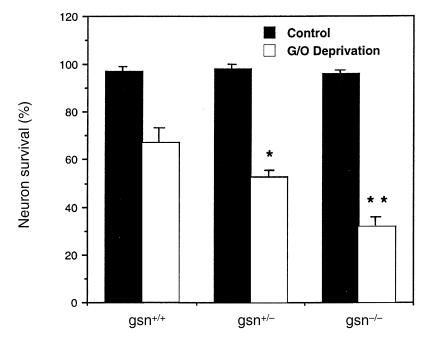
Primary cultures of hippocampal neurons were established from E18 gelsolin-null embryos. When these cells were exposed to combined glucose and oxygen (G/O) deprivation, we found that gsn–/– cells were significantly more vulnerable than gsn+/+ cells (Fig. 1). Gsn+/– neurons exhibited a level of intermediate vulnerability (Fig. 1).
Figure 1.
Neuronal vulnerability to combined glucose and oxygen deprivation is increased in hippocampal neurons lacking gelsolin (gsn). Cultures from gsn+/+, gsn+/–, and gsn–/– mice were subjected to combined G/O deprivation or medium change without G/O deprivation (control) for 30 min. Cultures were then incubated for an additional 20 h in Locke's solution and neuronal survival was quantified. Values are the mean and SE of determinations made in four separate cultures. *P < 0.05 compared with the value in gsn+/+ cultures exposed to G/O deprivation. **P < 0.01 compared with value in gsn+/+ cultures exposed to G/O deprivation, and P < 0.05 compared with the value in gsn+/– cultures exposed to G/O deprivation. ANOVA followed by Scheffe's post hoc tests. G/O, glucose/oxygen.
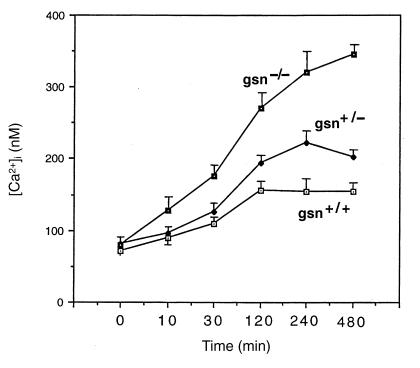
To test whether enhanced susceptibility to glucose and oxygen deprivation is correlated with increased intracellular Ca2+ levels ([Ca2+]i) in gsn–/– cells, [Ca2+]i was assessed using the indicator dye fura-2. Basal [Ca2+]i was essentially identical in neurons of all three genotypes (∼120 nM) (15). When cells were subjected to combined G/O deprivation, gsn–/– cells, and in an intermediate fashion gsn+/– cells, showed a more rapid and sustained [Ca2+]i increase compared with gsn+/+ cells (Fig. 2). Hence, the greater susceptibility to G/O deprivation in gsn–/– cells may be mediated, at least in part, by [Ca2+]i.
Figure 2.
Elevation of intracellular Ca2+ levels following combined glucose and oxygen deprivation is enhanced in hippocampal neurons lacking gelsolin (gsn). Cells from gsn+/+, gsn+/–, and gsn–/– mice were loaded with fura-2 and then subjected to combined G/O deprivation or medium change without G/O deprivation (control) for 30 min. The [Ca2+]i in individual neuronal cell bodies was then quantified at the indicated time points by fluorescence ratio imaging. Values are the mean and SE of determinations made in three separate cultures (15–25 neurons analyzed per culture). [Ca2+]i values for gsn–/– neurons were significantly greater than values for gsn+/+ and gsn+/– neurons at 30 min (P < 0.05) and 120, 240, and 480 min (P < 0.01 in each case). ANOVA followed by Scheffe's post hoc tests. [Ca2+]i, intracellular calcium.
Tissue injury following brain ischemia is increased in gsn–/– mice.
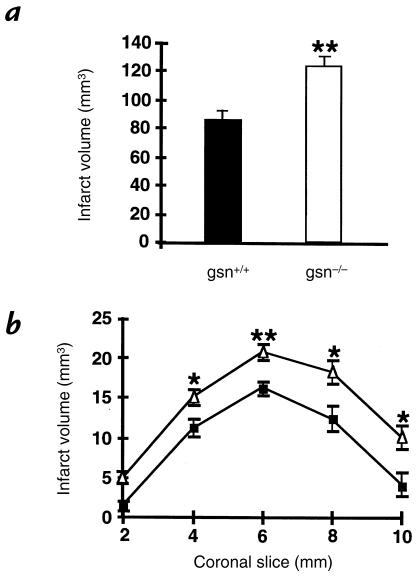
G/O deprivation and glutamate neurotoxicity are common models for studying mechanisms of vascular stroke injury in vitro. Because neurons from gsn–/– mice exhibited higher susceptibility to these insults, we tested the effects of gelsolin gene deletion in a model of reversible focal brain ischemia in vivo. Animals were subjected to two hours of MCA occlusion using a silicone-coated 8-0 monofilament, followed by 22 hours of reperfusion. Infarcts were 45% bigger in gsn–/– mice, compared with controls (Fig. 3). Brain swelling contributed partly to the larger infarcts in gsn–/– mice (40.6 ± 7.7 mm3 vs. 25.0 ± 6.1 mm3 in gsn–/– vs. gsn+/+, respectively). When infarction volume was corrected for brain swelling (calculated with the indirect method), infarcts in gsn–/– mice were still enlarged by 36% (82.9 ± 6.5 mm3 vs. 60.4 ± 4.9 mm3 in gsn–/– vs. gsn+/+, respectively; P < 0.05). Significantly larger lesions were evident in four of the five standardized coronal brain sections (Fig. 3).
Figure 3.
Infarct size in gsn+/+ and gsn–/– mice after MCA occlusion/reperfusion. Infarct size was 45% larger in gsn–/– mice compared with wild-type gsn+/+ littermate mice 22 h after 2 h of filamentous MCA occlusion. (a) Brain infarct volume and (b) brain infarct area (2-mm coronal sections) were determined as described previously (22, 24, 25) and were increased in gsn–/– mice (open triangles) compared with gsn+/+ mice (filled squares). Infarcts were also larger after correcting for brain swelling by an indirect method to measure infarct size (26). Data are presented as mean and SE. n = 10 animals per group. *P < 0.05 and **P < 0.01 compared with wild-type. Student's t test. MCA, middle cerebral artery.
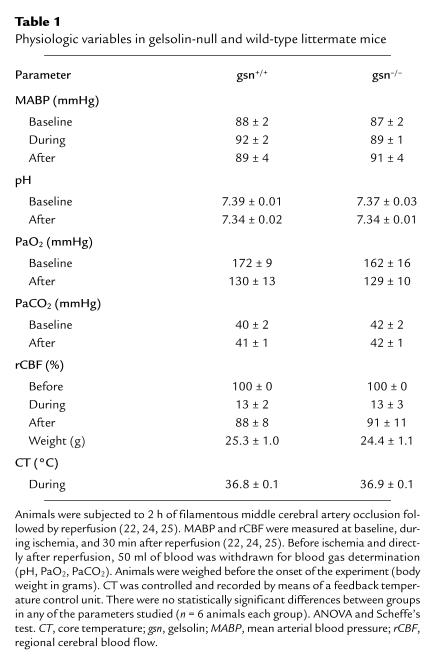
Because there is a secreted form of gelsolin (10), we looked for changes in cerebral blood flow during ischemia and after reperfusion that might modify infarct volume. To evaluate if differences in brain perfusion contributed to the higher susceptibility to injury in gsn–/– mice, rCBF was determined using Laser-Doppler monitoring. We found that rCBF fell to less than 20% of baseline during ischemia and returned to ∼90% within five minutes after reperfusion without differences between groups (Table 1). Arterial blood pressure, blood gases (pH, PaO2, and PaCO2), and core temperature during ischemia and reperfusion also were not different between groups (Table 1). Taken together, it seems unlikely that variations in brain perfusion or systemic physiologic parameters contributed to the susceptibility to injury in gsn–/– mice.
Table 1.
Physiologic variables in gelsolin-null and wild-type littermate mice
Increased cytosolic Ca2+ concentrations in cortical nerve terminals from gsn–/– mice after depolarization and after ischemia.
Because glutamate released via exocytosis from presynaptic terminals during ischemia is dependent on Ca2+ influx, we studied cytosolic Ca2+ concentration in synaptosomes isolated from ischemic and normal contralateral cortex. Basal Ca2+-concentrations in nerve terminals did not differ between gsn+/+ and gsn–/– (290 ± 60 and 299 ± 33 nM, respectively). However, depolarization (30 mM K+)-induced VDCC-mediated increases in [Ca2+]i were higher in gsn–/– compared with gsn+/+ synaptosomes (Fig. 4). After two hours ischemia followed by one hour of reperfusion, depolarization by 30 mM K+ also produced a substantially higher [Ca2+]i increase in gsn–/– compared with gsn+/+ synaptosomes (Fig. 4). Basal [Ca2+]i was reduced following ischemia in gsn+/+ and gsn–/– synaptosomes (220 ± 9 and 212 ± 18 nM, respectively), probably due to a reduced number of functionally intact terminals. Higher ischemia-induced [Ca2+]i suggest that functional alterations in VDCC may contribute to the greater susceptibility of gsn–/– mice to cerebral ischemia.
Figure 4.
Effect of ischemia on K+ (30 mM)-induced increase in [Ca2+]i in synaptosomes prepared from mice deficient for gelsolin (gsn–/–) compared with wild-type (gsn+/+). Synaptosomes were prepared from contralateral cortex (open bars) and ischemic cortex (filled bars) after 2 h ischemia and 1 h of reperfusion. Cytosolic Ca2+ concentrations were determined ratiometrically using the fluorescent calcium indicator dye fura-2/AM. Increase in [Ca2+]i is presented as percent of basal [Ca2+]i. Data are the mean ± SE of three to four experiments in duplicate. *P < 0.05 vs. gsn+/+ contralateral, #P < 0.05 vs. gsn+/+ contralateral, **P < 0.05 vs. gsn+/+ ischemic. ANOVA followed by Student's t test .
Ischemia-induced cytoskeletal alterations associated with calcium influx are exacerbated in mice lacking gelsolin.
Previous studies have shown that Ca2+-mediated proteolysis of cytoskeletal proteins such as spectrin and MAP-2 occurs during the first few hours after ischemia/reperfusion and correlates closely with subsequent neuronal degeneration and death (29, 30, 31). Because our data indicated that Ca2+ influx through N-methyl-D-aspartate NMDA receptors and VDCC is enhanced in neurons lacking gelsolin, we performed immunohistochemical analyses to assess the development of Ca2+-mediated proteolysis following MCA occlusion in gsn+/+ and gsn–/– mice. Compared with gsn+/+ mice, the extent of calpain-mediated spectrin proteolysis, as assessed with an antibody against calpain-cleaved spectrin (Ab37) (29), was greater in striatum and cortex of gsn–/– mice (Fig. 5). Increased spectrin proteolysis in gsn–/– was accompanied by decreased MAP-2 immunoreactivity, consistent with Ca2+-mediated proteolysis of this protein, as well (Fig. 5). Previous studies have shown a strong correlation between infarct volume and disruption of the blood–brain barrier following MCA occlusion/reperfusion. Moreover, NMDA receptor antagonists reduce the extent of blood–brain barrier disruption, suggesting a role for NMDA receptors in this process (32–34). Consistent with the latter findings, the extent of IgG accumulation in brain parenchyma was strikingly greater in gsn–/– mice compared with gsn+/+ mice (Fig. 5). Collectively, these data are consistent with enhanced Ca2+-influx through NMDA receptors and VDCC in cortical and striatal neurons following MCA occlusion/reperfusion in mice lacking gelsolin.
Figure 5.
Evidence for increased Ca2+-mediated proteolysis following MCA occlusion/reperfusion in gsn–/– mice. Gsn+/+ and gsn–/– mice were subjected to 2 h MCA occlusion and were sacrificed 1 h after reperfusion. Coronal brain sections were immunostained with antibodies against calpain-cleaved spectrin and MAP-2; additional sections were reacted with biotinylated horse anti–mouse IgG (upper panels). Note increased IgG immunoreactivity, increased spectrin immunoreactivity, and decreased MAP-2 immunoreactivity in the gsn–/– mice. These micrographs are representative of five gsn–/– and four gsn+/+ mice examined. MAP-2, mitogen-activated protein-2.
Gelsolin undergoes cleavage after cerebral ische-mia/reperfusion.
Because we have recently demonstrated that gelsolin is cleaved by caspase-3 during apoptosis (27) and that caspase-3 is activated following cerebral ischemia (35), we characterized the fate of gelsolin after ischemia/reperfusion in wild-type mice. Immunoblot analysis of brain lysates from 129/SV mice after two hours of ischemia and reperfusion (0–24 hours) demonstrated gelsolin fragments at 1, 3, 6, 9, 12, and 18 hours after reperfusion (Fig. 6). The gelsolin fragments measured 48 kDa and 52 kDa, respectively, as we have seen previously (35). Hence, gelsolin is cleaved, presumably by caspase-3; however, this event seems unlikely to account for the larger infarct size in the gelsolin-null mice.
Figure 6.
Time-dependent changes in gelsolin protein and cleavage product expression during reperfusion following 2 h MCA occlusion in brain lysates from normal (gsn+/+) or gelsolin knockout (gsn–/–) mice. Brain lysates (10 μg/lane) were subjected to SDS-PAGE and immunoblot analysis using a polyclonal gelsolin antibody (ref. 27). Uncleaved gelsolin (80 kDa) was present in normal brain (sham) and did not change over time when measured in five different experiments. Cleavage product (p48) was increased 1–18 h after reperfusion in the left (L, ischemic) compared with the right (R, contralateral) hemisphere. A 52-kDa cleavage product was present in all samples including sham but was increased in ischemic hemispheres. Gsn–/– mice lack gelsolin in hemispheres (L and R) and cerebellum (C). α-tubulin was used as an internal control. The experiment was repeated five times; a representative experiment is shown.
Actin depolymerization by cyto D protects wild-type mice from vascular injury.
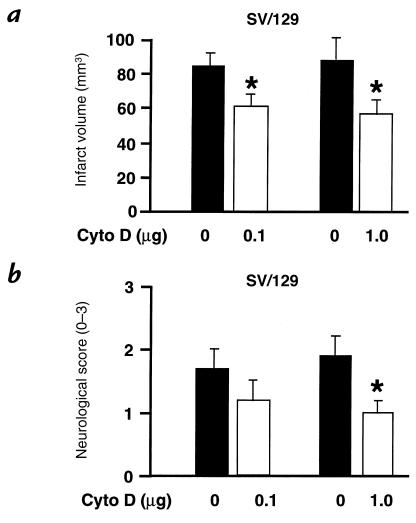
To test the theory that dynamic changes in the actin cytoskeleton are responsible for differences in ischemic outcome between gsn–/– and gsn+/+ mice, we treated wild-type 129/SV mice with the actin-depolymerizing fungal toxin cyto D. Mice were injected intracerebroventricularly with cyto D 10 minutes before two hours of MCA occlusion, followed by 22 hours of reperfusion. Intracerebroventricular injections with cyto D had no obvious effects on rectal or temporalis muscle temperatures (see Methods). Mice treated with 0.1 or 1.0 μg cyto D intracerebroventricularly exhibited significantly smaller cerebral infarcts compared with vehicle-injected controls (Fig. 7a). This effect was also significant when measured with an indirect method to obviate the impact of brain edema on outcome (77.2 ± 8.0 mm3 vs. 47.7 ± 9.1 mm3 for vehicle vs. 1.0 μg, and 79.7 ± 6.8 mm3 vs. 54.1 ± 7.5 mm3 for vehicle vs. 0.1 mg; P < 0.05 vs. vehicle for either treatment). Moreover, functional neurological deficits were significantly improved after 1.0 μg cyto D and showed a trend toward lower scores with the 0.1-mg dose, indicating that infarct sparing may be accompanied by functional improvements (Fig. 7b). The protective effect after a single dose of cyto D (1.0 μg given 10 minutes before two hours of MCA occlusion) was sustained for at least three days (135 ± 11 mm3 vs. 98 ± 9 mm3 in vehicle vs. treatment group, respectively; P < 0.05, n = 5 per group), which demonstrates that infarct development was not merely delayed by the treatment.
Figure 7.
Infarct size and neurological deficits after cytochalasin D (cyto D) treatment following MCA occlusion/reperfusion. (a) Treatment with the actin-depolymerizing compound cyto D (0.1 and 1.0 μg intracerebroventricularly 10 min before ischemia) reduced infarct size after 2 h of filamentous MCA occlusion and 22 h of reperfusion compared with vehicle in 129/SV mice. Cerebral infarction volume was determined quantitatively as described; significant differences were also obtained when infarct sizes were corrected for brain swelling. Data are presented as mean and SE (n = 8–12 animals per group). *P < 0.05 vs. vehicle. Student's t test. (b) Neurological sensory-motor deficits were significantly reduced in cyto D–treated 129/SV mice compared with controls. Deficits were evaluated blindly using an established rating system from 0 (no deficit) to 3 (severe). Data are presented as mean and SE (n = 8–12 animals per group). *P < 0.05 vs. vehicle. Mann-Whitney rank sum test.
Cyto D treatment confers greater protection in gelsolin-null mice.
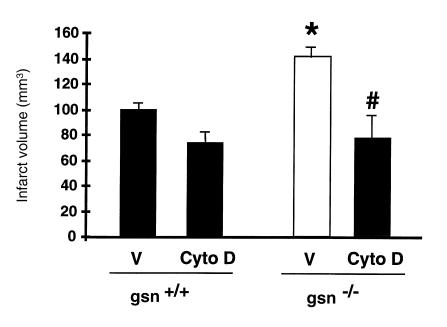
To evaluate the combined effects of cyto D administration and gelsolin gene deletion, we treated gsn–/– and gsn+/+ mice with cyto D (1.0 μg intracerebroventricularly 10 minutes before ischemia) or vehicle, respectively, and determined stroke outcome after two hours of MCA occlusion and 22 hours of reperfusion (Fig. 8). Compared with noninjected gsn–/– and gsn+/+ mice (Fig. 3), vehicle-injected animals exhibited ∼10%–15% bigger direct infarcts, probably due to the intracerebroventricular injection. Remarkably, cyto D treatment led to a greater decrease in infarct size in the gsn–/– mice compared with vehicle, such that infarcts in treated gsn–/– mice did not differ significantly from treated gsn+/+ mice. Hence, the cytoskeletal actions of gelsolin are likely to account for the differences seen in infarct size between gsn–/– and gsn+/+ mice.
Figure 8.
Combined effects of cyto D treatment and gelsolin gene deletion on infarct size after MCA occlusion. Gsn+/+ and gsn–/– mice were treated with cyto D (1 μg intracerebroventricularly 10 min before ischemia) or vehicle (V), respectively, and then subjected to 2 h of left filamentous MCA occlusion and 22 h of reperfusion. Cerebral infarct volume was determined quantitatively as described (22, 24). Results were confirmed with the indirect method to determine infarct size as follows: 72.1 ± 4.9 mm3 (V/gsn+/+) vs. 44.7 ± 8.2 mm3 (cyto D/gsn+/+) vs. 100.4 ± 13.1 mm3 (V/gsn–/–) vs. 45.4 ± 11 mm3 (cyto D/gsn–/–). Data are given as mean and SE (n = 4–7 animals per group). *P < 0.01 vs. vehicle-treated gsn+/+, #P < 0.05 vs. vehicle-treated gsn–/–. ANOVA followed by Tukey's test.
Discussion
Glutamate excitotoxicity and intracellular Ca2+ overload are thought to play a crucial role in neuronal death following cerebral ischemia (1–4). Here we demonstrated that gsn–/– mice are more susceptible to brain injury after ischemia/reperfusion than control mice, with significant differences in both infarction volume and brain swelling. This enhanced ischemic injury in the gsn–/– mice appeared to be mediated by increased neuronal [Ca2+]i, as shown by studies on cultured hippocampal gsn–/– neurons. These cells exhibited increased cell death after glucose and oxygen deprivation, as well as a more rapid and sustained increase of [Ca2+]i in comparison to wild-type neurons. In addition, depolarization-induced (and therefore VDCC-mediated) increases in cytosolic Ca2+ levels in isolated cortical nerve terminals were also higher in the gsn–/– mice, and this difference was even more pronounced after ischemia/reperfusion. The observations extend our previous studies demonstrating higher NMDA- and VDCC-mediated Ca2+ currents, as well as a lack of actin filament depolymerization in gsn–/– compared with wild-type neurons (15). Ischemia-induced cytoskeletal alterations known to be associated with increased Ca2+ influx, spectrin cleavage, and loss of MAP-2 were exacerbated in the gsn–/– mice. Together, these data suggest that differences in ischemic susceptibility in the gsn–/– mice probably relate to increased [Ca2+]i and Ca2+-mediated cellular damage, due to a lack of gelsolin-mediated actin filament depolymerization.
A second major finding was that the actin-depolymerizing compound cyto D protected 129/SV wild-type mice from brain ischemia and reduced infarct volume by 25% to 35%. Moreover, when gsn–/– mice were treated with cyto D, infarct volume was reduced by nearly 50% and did not differ significantly from cyto D–treated gsn+/+ mice. This observation confirms that it is the actin-depolymerizing activity of gelsolin that is critical in this process, accounting for the increased infarct volumes in gsn–/– mice. In addition, we have also observed that gsn–/– mice exhibit bigger lesions following striatal NMDA injections and that cyto D protects wild-type mice in this injury model (36) (Stagliano, N.E. et al., unpublished observations).
In view of these findings, we propose the following model (Fig. 9). Brain ischemia leads to brain hypoxia, acidosis, and glucose depletion, which promote neuronal depolarization, which, in turn, activates somadendritic as well as presynaptic voltage-dependent Ca2+ channels (VDCC) directly and NMDA receptors indirectly by glutamate release (1–4). This excitotoxic event leads to intracellular Ca2+ overload, a key trigger of cell injury and death (1–4). Gelsolin is activated by Ca2+ and acidosis (pH < 6.5) (37) to sever the neuronal actin filament network, leading to marked changes in the neuronal actin cytoskeleton and net actin depolymerization. These changes promote channel rundown by altering internal regulatory domains of VDCC and NMDA channels (5, 6), limiting further Ca2+-influx and stabilizing [Ca2+]i (7, 15). Thus, gelsolin activation and subsequent actin depolymerization are a response mechanism to brain ischemia that interrupts a progressive cycle of Ca2+-mediated cytotoxicity to protect against cell injury and death. The synergistic effects of acidosis and increased [Ca2+]i are particularly likely to activate gelsolin under these circumstances (37). This compensatory mechanism leads to both reduction in infarct volume and in surrounding edema, both of which are beneficial effects in stroke.
Figure 9.
A model showing how gelsolin activation leading to dynamic changes in the actin cytoskeleton may modify tissue injury in cerebral ischemia. Brain ischemia promotes neuronal depolarization, which activates VDCC directly and NMDA channels by the release of glutamate. Activation of both channels mediates intracellular Ca2+ influx, which activates various cell death–promoting intracellular enzymes. Ca2+ also activates the actin-severing protein gelsolin, which in turn mediates dynamic changes (net depolymerization) in the actin filament network. This actin remodeling event leads to channel rundown, inactivation, and stabilization of [Ca2+]i. Thus, gelsolin acts as an intracellular Ca2+ sensor, negatively regulating Ca2+ influx and thereby protecting against neuronal dysfunction and death. Cyto D, through similar effects on the actin cytoskeleton, also exhibits neuroprotective effects VDCC, voltage-dependent Ca2+ channels; NMDA, N-methyl-D-aspartate.
We recently demonstrated that gelsolin is a prominent substrate of activated caspase-3 (27), an apoptotic protease with a critical function in apoptosis in multiple cell types (38). Caspase-3 cleavage of gelsolin results in the generation of a constitutively active NH2-terminal fragment that severs actin filaments without Ca2+ regulation. Apoptosis develops during cerebral ischemia based on morphological, biochemical, pharmacological, and molecular criteria (22, 23, 39, 40), but its extent is highly dependent on the duration of the ischemic insult. Activation and cleavage of caspase-3 was previously demonstrated in the mouse ischemia model used here (35). We demonstrated that gelsolin is cleaved during ischemia, and the appearance of gelsolin cleavage products followed a time course similar to that of caspase-3 activation (35), providing the first evidence that gelsolin is cleaved by capsase-3 in vivo. However, the amount of cleavage was minimal in these whole brain extracts, consistent with limited apoptotic induction. Moreover, in contrast to our earlier study in which gelsolin cleavage accelerated apoptotic death in gsn+/+, compared with gsn–/–, neutrophils (27), here we observed that gsn–/– mice exhibited enlarged infarcts. It is possible that during brain ischemia/reperfusion, gelsolin activation by caspase-3 cleavage, as well as increased [Ca2+]i and acidosis, facilitates a beneficial response to overactivation of NMDA and VDCC channels, explaining this organ/cell difference. Alternatively, we suspect that the gelsolin cleavage fragment had no significant effects in these cells under these conditions, given the limited extent of cleavage observed. Gelsolin is also reported to inhibit apoptosis when overexpressed in Jurkat cells, a human T-cell line (41), and it is possible that its neuronal expression also inhibits apoptosis. Analysis of the role of gelsolin in a recently developed model of mild ischemia, where apoptotic cell death is more pronounced than excitotoxic cell death (23), may provide further insight.
In conclusion, gelsolin expression at normal levels in the murine brain serves as protection from ischemic injury through its ability to drive dynamic changes in the neuronal actin cytoskeleton, to stabilize [Ca2+]i, and to attenuate Ca2+-induced cytotoxicity. The observation that the partial gelsolin analogue, cytochalasin D, reduced infarct volume by 25% in gsn+/+ mice and by almost 50% in gsn–/– mice, suggests that measures that increase or mimic gelsolin expression or activity in the brain may be beneficial during human brain ischemia.
Acknowledgments
The authors thank Ulrich Laufs for advice. Studies were supported by grants from the National Institutes of Health (NS10828 to M.A. Moskowitz; NS29001 and NS30583 to M.P. Mattson; and RO1 HL54188 and PO1 HL48743 to D.J. Kwiatkowski), and from the Deutsche Forschungsgemeinschaft (En343/1-1 to M. Endres).
References
- 1.Choi DW. Calcium: still center-stage in hypoxic-ischemic neuronal death. Trends Neurosci. 1995;18:58–60. [PubMed] [Google Scholar]
- 2.Choi DW. Glutamate neurotoxicity and diseases of the nervous system. Neuron. 1988;1:623–634. doi: 10.1016/0896-6273(88)90162-6. [DOI] [PubMed] [Google Scholar]
- 3.MacDermott AB, Mayer ML, Westbrook GL, Smith SJ, Barker JL. NMDA-receptor activation increases cytoplasmic calcium concentration in cultured spinal cord neurons. Nature. 1986;321:519–522. doi: 10.1038/321519a0. [DOI] [PubMed] [Google Scholar]
- 4.Park PC, Nehls DG, Graham DI, Teasdale GM, McCulloch J. The glutamate antagonist MK-801 reduces focal ischemic brain damage in the rat. Ann Neurol. 1988;24:43–51. doi: 10.1002/ana.410240411. [DOI] [PubMed] [Google Scholar]
- 5.Rosenmund C, Westbrook GL. Calcium-induced actin depolymerization reduces NMDA channel activity. Neuron. 1993;10:805–814. doi: 10.1016/0896-6273(93)90197-y. [DOI] [PubMed] [Google Scholar]
- 6.Johnson B, Byerly L. A cytoskeletal mechanism for Ca2+ channel metabolic dependence and inactivation by intracellular Ca2+ Neuron. 1993;10:797–804. doi: 10.1016/0896-6273(93)90196-x. [DOI] [PubMed] [Google Scholar]
- 7.Furukawa K, Smith-Swintosky VL, Mattson MP. Evidence that actin depolymerization protects hippocampal neurons against excitotoxicity by stabilizing [Ca2+]i. Exp Neurol. 1993;133:153–163. doi: 10.1006/exnr.1995.1018. [DOI] [PubMed] [Google Scholar]
- 8.Schafer DA, Cooper JA. Control of actin assembly at filament ends. Ann Rev Cell Dev Biol. 1995;11:497–518. doi: 10.1146/annurev.cb.11.110195.002433. [DOI] [PubMed] [Google Scholar]
- 9.Janmey PA, Stossel TP. Modulation of gelsolin function by phosphatidylinositol 4,5-biphosphate. Nature. 1987;325:362–364. doi: 10.1038/325362a0. [DOI] [PubMed] [Google Scholar]
- 10.Kwiatkowski DJ, Mehl R, Yin HL. Genomic organization and biosynthesis of secreted and cytoplasmic forms of gelsolin. J Cell Biol. 1988;106:375–384. doi: 10.1083/jcb.106.2.375. [DOI] [PMC free article] [PubMed] [Google Scholar]
- 11.Kwiatkowski DJ, Janmey PA, Yin HL. Identification of critical functional and regulatory domains in gelsolin. J Cell Biol. 1989;108:1717–1726. doi: 10.1083/jcb.108.5.1717. [DOI] [PMC free article] [PubMed] [Google Scholar]
- 12.Azuma T, Witke W, Stossel TP, Hartwig JH, Kwiatkowski DJ. Gelsolin is a downstream effector of rac for fibroblast motility. EMBO J. 1998;17:1362–1379. doi: 10.1093/emboj/17.5.1362. [DOI] [PMC free article] [PubMed] [Google Scholar]
- 13.Witke W, et al. Hemostatic, inflammatory, and fibroblast responses are blunted in mice lacking gelsolin. Cell. 1995;81:41–51. doi: 10.1016/0092-8674(95)90369-0. [DOI] [PubMed] [Google Scholar]
- 14.Tanaka J, Kira M, Subue K. Gelsolin is localized in neuronal growth cones. Dev Brain Res. 1993;76:268–271. doi: 10.1016/0165-3806(93)90217-x. [DOI] [PubMed] [Google Scholar]
- 15.Furukawa K, et al. The actin-severing protein gelsolin modulates calcium channel and NMDA receptor activities and vulnerability to excitotoxicity in hippocampal neurons. J Neurosci. 1997;17:8178–8186. doi: 10.1523/JNEUROSCI.17-21-08178.1997. [DOI] [PMC free article] [PubMed] [Google Scholar]
- 16.Mattson MP, Dou P, Kater SB. Outgrowth-regulating actions of glutamate in isolated hippocampal pyramidal neurons. J Neurosci. 1988;8:2087–2100. doi: 10.1523/JNEUROSCI.08-06-02087.1988. [DOI] [PMC free article] [PubMed] [Google Scholar]
- 17.Mattson MP, Murrain M, Guthrie PB, Kater SB. Fibroblast growth factor and glutamate: opposing actions in the generation and degeneration of hippocampal architecture. J Neurosci. 1989;9:3728–3740. doi: 10.1523/JNEUROSCI.09-11-03728.1989. [DOI] [PMC free article] [PubMed] [Google Scholar]
- 18.Mattson MP, Barger SW, Begley JG, Mark RJ. Calcium, free radicals, and excitotoxic neuronal death in primary cell culture. Methods Cell Biol. 1995;46:187–216. doi: 10.1016/s0091-679x(08)61930-5. [DOI] [PubMed] [Google Scholar]
- 19.Grynkiewicz G, Poenie M, Tsien RY. A new generation of Ca2+ indicators with greatly improved fluorescence properties. J Biol Chem. 1985;260:3440–3450. [PubMed] [Google Scholar]
- 20.Gleitz J, Beile A, Peters T. (±)-Kavain inhibits the veratridine- and KCl-induced increase in intracellular Ca2+ and glutamate-release of rat cerebrocortical synaptosomes. Neuropharmacology. 1996;35:179–186. doi: 10.1016/0028-3908(95)00163-8. [DOI] [PubMed] [Google Scholar]
- 21.Meder W, Fink K, Göthert M. Involvement of different calcium channels in K+- and veratridine-induced increases of cytosolic calcium concentration in rat cortical synaptosomes. Naunyn-Schmiedeberg's Arch Pharmacol. 1997;356:797–805. doi: 10.1007/pl00005120. [DOI] [PubMed] [Google Scholar]
- 22.Hara H, et al. Inhibition of interleukin-1β converting enzyme family proteases reduces ischemic and excitotoxic damage. Proc Natl Acad Sci USA. 1997;94:2007–2012. doi: 10.1073/pnas.94.5.2007. [DOI] [PMC free article] [PubMed] [Google Scholar]
- 23.Endres M, et al. Attenuation of delayed neuronal death after mild focal ischemia in mice by inhibition of the caspase family. J Cereb Blood Flow Metab. 1998;18:238–247. doi: 10.1097/00004647-199803000-00002. [DOI] [PubMed] [Google Scholar]
- 24.Endres M, Wang Z-Q, Namura S, Waeber C, Moskowitz MA. Ischemic brain injury is mediated by the activation of poly(ADP-ribose)polymerase. J Cereb Blood Flow Metab. 1997;17:1143–1151. doi: 10.1097/00004647-199711000-00002. [DOI] [PubMed] [Google Scholar]
- 25.Huang Z, et al. Effects of cerebral ischemia in mice deficient in neuronal nitric oxide synthase. Science. 1994;265:1883–1885. doi: 10.1126/science.7522345. [DOI] [PubMed] [Google Scholar]
- 26.Swanson RA, et al. A semiautomated method for measuring brain infarct volume. J Cereb Blood Flow Metab. 1990;10:290–293. doi: 10.1038/jcbfm.1990.47. [DOI] [PubMed] [Google Scholar]
- 27.Kothakota S, et al. Caspase-3-generated fragment of gelsolin: effector of morphological change in apoptosis. Science. 1997;278:294–298. doi: 10.1126/science.278.5336.294. [DOI] [PubMed] [Google Scholar]
- 28.Smith-Swintosky VL, et al. Metapyrone, an inhibitor of glucocorticoid production, reduces brain injury by focal and global ischemia and seizures. J Cereb Blood Flow Metab. 1996;16:585–598. doi: 10.1097/00004647-199607000-00008. [DOI] [PubMed] [Google Scholar]
- 29.Robert-Lewis JM, et al. Immunolocalization of calpain I-mediated spectrin degradation to vulnerable neurons in the ischemic gerbil brain. J Neurosci. 1994;14:3934–3944. doi: 10.1523/JNEUROSCI.14-06-03934.1994. [DOI] [PMC free article] [PubMed] [Google Scholar]
- 30.Pettigrew LC, et al. Microtubular proteolysis in focal cerebral ischemia. J Cereb Blood Flow Metab. 1996;16:1189–1202. doi: 10.1097/00004647-199611000-00013. [DOI] [PubMed] [Google Scholar]
- 31.Yao H, et al. Local cerebral glucose utilization and cytoskeletal proteolysis as indices of evolving focal ischemic injury in core penumbra. J Cereb Blood Flow Metab. 1995;15:398–408. doi: 10.1038/jcbfm.1995.50. [DOI] [PubMed] [Google Scholar]
- 32.Belayev L, Busto R, Watson BD, Ginsberg DM. Post-ischemic administration of HU-211, a novel non-competitive NMDA antagonist, protects against blood-brain barrier disruption in photochemical cortical infarction in rats: a quantitative study. Brain Res. 1995;702:266–270. doi: 10.1016/0006-8993(95)01127-9. [DOI] [PubMed] [Google Scholar]
- 33.Du C, Hu R, Hsu CY, Choi WD. Dextrorphan reduces infarct volume, vascular injury, and brain edema after ischemic brain injury. J Neurotrauma. 1996;13:215–222. doi: 10.1089/neu.1996.13.215. [DOI] [PubMed] [Google Scholar]
- 34.Baskaya MK, et al. Protective effects of ifenprodil on ischemic injury size, blood-brain barrier breakdown, and edema formation in focal cerebral ischemia. Neurosurgery. 1997;40:364–370. doi: 10.1097/00006123-199702000-00026. [DOI] [PubMed] [Google Scholar]
- 35.Namura S, et al. Activation and cleavage of caspase-3 in experimental cerebral ischemia in mice. J Neurosci. 1998;18:3659–3668. doi: 10.1523/JNEUROSCI.18-10-03659.1998. [DOI] [PMC free article] [PubMed] [Google Scholar]
- 36.Ayata C, et al. Reduced striatal NMDA excitotoxicity in type I nitric oxide synthase knockout mice. J Neurosci. 1997;17:6908–6917. doi: 10.1523/JNEUROSCI.17-18-06908.1997. [DOI] [PMC free article] [PubMed] [Google Scholar]
- 37.Lamb JA, Allen PG, Tuan BY, Janmey PA. Modulation of gelsolin function. Activation at low pH overrides Ca2+ requirement. J Biol Chem. 1993;268:8999–9004. [PubMed] [Google Scholar]
- 38.Kuida K, et al. Decreased apoptosis in the brain and premature lethality in CPP32-deficient mice. Nature. 1996;384:368–372. doi: 10.1038/384368a0. [DOI] [PubMed] [Google Scholar]
- 39.Li Y, et al. Ultrastructural and light microscopic evidence of apoptosis after middle cerebral artery occlusion in the rat. Am J Pathol. 1995;146:1045–1051. [PMC free article] [PubMed] [Google Scholar]
- 40.Hill IE, MacManus V, Rasquinha I, Tuor UI. DNA fragmentation indicative of apoptosis following unilateral cerebral hypoxia-ischemia in the neonatal rat. Brain Res. 1995;676:398–403. doi: 10.1016/0006-8993(95)00145-g. [DOI] [PubMed] [Google Scholar]
- 41.Ohtsu M, et al. Inhibition of apoptosis by the actin-regulatory protein gelsolin. EMBO J. 1997;16:4650–4656. doi: 10.1093/emboj/16.15.4650. [DOI] [PMC free article] [PubMed] [Google Scholar]


