Abstract
We have quantitatively determined gluconeogenesis (GNG) from all precursors, using a novel method employing 2H20 to address the question of whether changes in plasma free fatty acids (FFA) affect GNG in healthy, nonobese subjects. In the first study (n = 6), plasma FFA were lowered at 16 to 20 hours with nicotinic acid (NA) and were then allowed to rise at 20 to 24 hours (FFA rebound after administration of NA). FFA decreased from 387 μM at 16 hours to 43 μM at 20 hours, and then rebounded to 1,823 μM at 24 hours. GNG decreased from 58.1% at 16 hours to 38.6% of endogenous glucose production at 20 hours (P < 0.005) and then rebounded to 78.9% at 24 hours (P < 0.05). Conversely, glycogenolysis (GL) increased from 41.9% at 16 hours to 61.4% at 20 hours (P < 0.05), and then decreased to 21.1% at 24 hours (P < 0.05). In the second study (controls; n = 6), volunteers were analyzed between 16 and 24 hours after the last meal. FFA rose from 423 to 681 μM (P < 0.05), and GNG from 50.3% to 61.7% (P < 0.02), whereas GL decreased from 49.7% to 38.3% (P < 0.05). Endogenous glucose production decreased at the same rate in both studies, from 10.7 to 8.6 μmol/kg/min (P < 0.05). In study 3 (n = 6), in which the NA-mediated decrease of plasma FFA was prevented by infusion of lipid and heparin, neither FFA nor GNG changed significantly. In summary, our data suggest that (a) acute changes in plasma FFA produce acute changes in GNG and reciprocal changes in GL; (b) the decrease in EGP between 16 and 24 hours of fasting is due to a fall in GL; and (c) NA has no direct effect on GNG.
Introduction
During fasting, free fatty acids (FFA) become the dominant oxidative fuel for all major tissues except the brain (1). The fasting brain, on the other hand, depends largely on glucose, most or all of which is derived from gluconeogenesis (GNG) (1). FFA, which rise during fasting, promote GNG in rat liver (2–4). Whether they also stimulate GNG in humans remains controversial. The uncertainty exists because effects of FFA on GNG are species specific: stimulatory in the rat but inhibitory in dogs, cats, and guinea pigs (5–7); and because discrepant results have been obtained in humans. In two studies, FFA have been reported to enhance gluconeogenesis from alanine and lactate in overnight-fasted normal subjects and patients with type 2 diabetes, respectively (8, 9), whereas in another study, FFA were found to suppress GNG from alanine in four day–fasted normal volunteers (10). Moreover, in none of these studies could GNG be determined quantitatively because of two problems. First, usually only one (or at most two) GNG precursors were used. To determine total GNG would have required extrapolation from the conversion to GNG from one to all precursors. This is difficult, however, because it has been shown that infusion of some precursors (for instance, glycerol) decreased the fractional conversion of other precursors (for instance, amino acids) (11, 12). A second problem arising from the methods used was the systematic underestimation of GNG to an extent that was difficult to assess (13). The reason for this was that the hepatic GNG precursor specific activity was unknown because the label was diluted in the oxaloacetate pool, which is shared by GNG and the tricarboxylic acid cycle (13).
Endogenous glucose production (EGP) consists of glucose produced by GNG and glycogenolysis (GL). It was surprising, therefore, that in some studies changes in GNG in response to FFA did not affect EGP (8–10). The mechanism for this so-called hepatic autoregulation remained unknown, but several putative explanations have been proposed, including glucose or glycogen cycling (8), an increase in GNG from one precursor matched by a similar decrease in GNG from other precursors (11, 12), and a decrease in the rate of GL (8). So far, none of these mechanisms have been confirmed. Recently, a new method to measure GNG that avoids the problem of precursor dilution has become available. This method uses 2H20 and determines GNG from all precursors, including lactate, pyruvate, glucogenic amino acids, and glycerol (14–17). It was the objective of this study to use this 2H20 technique to examine the effects of acute changes in plasma concentrations of endogenously derived FFA (compared with FFA derived from infused lipid) on GNG and GL and to investigate the mechanism responsible for the hepatic autoregulation phenomenon. To this end, plasma FFA concentrations were first lowered with nicotinic acid (NA) and subsequently raised (as result of the FFA rebound that occurred after discontinuation of NA) in normal subjects who were fasting for 24 hours.
Methods
Subjects.
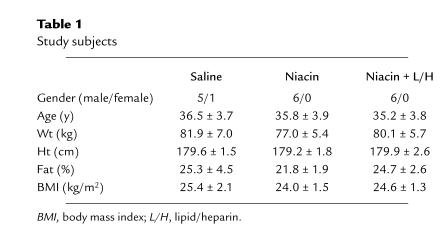
Twelve normal volunteers participated in 18 studies. Some of their characteristics are given in Table 1. None of the subjects had diabetes or a family history of diabetes, and none were taking any medication. Their weights were stable for at least 2 months, and their diets contained a minimum of 250 g carbohydrate for at least 2 days before the studies. The purpose, nature, and potential risks of the study were explained to the subjects, and their informed consent was obtained before enrollment. The protocol was reviewed and approved by the Institutional Review Board of Temple University Hospital.
Table 1.
Study subjects
Experimental design.
All subjects were admitted to the Temple University Hospital General Clinical Research Center on the day before the studies. At 6 pm, the subjects ingested a meal containing 14 kcal/kg of body weight; the meal was composed of 53% carbohydrate, 15% protein, and 32% fat. They then fasted for 24 h but were allowed water ad libitum. At 11 pm, a baseline blood sample was obtained. The subjects drank 2.5 g of 2H20 (99.9% hydrogen-2; Isotec Inc., Miamisburg, Ohio, USA) per kilogram of body water at 11 pm and again 4 h later, at 3 am. Body water was assumed to be 50% of body weight in women and 60% of body weight in men. Additional water ingested during the fast was enriched to 0.5% with 2H20 to prevent dilution of the isotopic steady state. The studies began at 8 am the following day with the subjects reclining in bed. A short polyethylene catheter was inserted into an antecubital vein for infusion of isotopes. Another catheter was placed into a contralateral forearm vein for blood sampling. This arm was wrapped with a heating blanket (∼70°C) to arterialize venous blood. The following studies were performed.
Study 1 (nicotinic acid).
The objective of this study was to determine rates of GNG, GL, and EGP in response to acutely falling and acutely rising plasma levels of FFA. Six subjects were studied in this protocol. Sixteen hours after the last meal, NA was given orally every 30 min for 4 h (100 mg at 0, 30, 180, 210, and 240 min; 150 mg at 60, 90, 120, and 150 min). Blood samples were drawn at 16, 20, and 24 h of fasting for determination of rates of GNG, glucose, and glycerol turnovers, and at 14.5, 15.5, and 16 h, and at hourly intervals, after that for determination of substrates and hormones, except for epinephrine and glucagon, which were determined at 14.5, 20, 22, and 24 h.
Study 2 (controls).
This study served as a control to study 1. Six subjects were studied in this protocol, which was identical to study 1 except that NA was not given.
Study 3 (NA plus lipid/heparin).
This study was performed to determine whether NA had effects on GNG independent of its FFA-lowering effects. Six subjects were studied. From 16 h until 20 h after the last meal, NA was given as in study 1. Plasma FFA concentrations, however, were prevented from decreasing by a variable rate infusion of lipid/heparin. Liposyn II (Abbott Laboratories, North Chicago, Illinois, USA), a 20% triglyceride emulsion, was infused at rates ranging from 30–50 ml/h. Heparin was infused at 0.2 U/kg/min.
Analytical procedures
Determination of GNG from all precursors.
This method depends on the incorporation of hydrogen-2 from 2H20 into glucose. After 2H20 administration, hydrogen-2 enrichment at the glucose carbon-5 (C5) divided by hydrogen-2 enrichment at the glucose carbon-2 (C2) equals the fractional contribution of GNG to EGP. This is because the conversion of every molecule of pyruvate to glucose involves addition of one molecule of hydrogen from body water to C2 of the intermediate phosphoenolpyruvate. This carbon becomes C5 of glucose.
During conversion of glycerol to glucose, one molecule of hydrogen from body water is added to C2 of glyceraldehyde-3-phosphate during isomerization with dihydroxyacetone-3-phosphate. That carbon also becomes C5 of glucose. Thus, enrichment in C5 of glucose reflects glucose production from pyruvate and glycerol, i.e., from all GNG precursors.
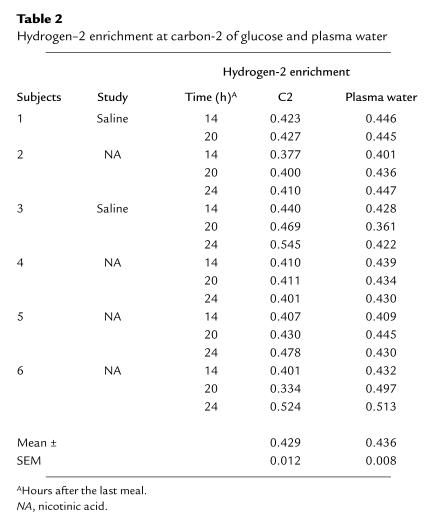
Hydrogen-2 enrichment on C2 reflects glucose production from GNG and from GL. This is because one molecule of hydrogen from body water is added to C2 of glucose-6-phosphate when fructose-6-phosphate is converted to glucose-6-phosphate during GNG. Furthermore, glucose-6-phosphate, which is also formed as an intermediate during GL, equilibrates extensively with fructose-6-phosphate, resulting in the exchange of the H bound to C2 of the glucose-6-phosphate with that in body water. In this study, hydrogen-2 enrichment at C2 was the same as that in body water (Table 2). There is, however, no labeling at C5 during GL. Therefore, the ratio of labeling at C5 to C2 of glucose is a measure of GNG relative to total glucose production (15, 16).
Table 2.
Hydrogen–2 enrichment at carbon-2 of glucose and plasma water
To determine hydrogen-2 enrichment of C5, glucose was converted to xylose by removal of C6. Xylose was then oxidized with periodic acid to formaldehyde, which was condensed with ammonia to hexamethylenetetramine (HMT), resulting in a sixfold enrichment of the trace. To obtain enrichment of C2, glucose was converted to polyphosphates (ribitol-5-P and arabitol-5-P), which were then oxidized with periodic acid to formaldehyde and condensed with ammonia to HMT (15, 16).
Enrichment in HMTs from C2 and C5 of blood glucose was determined by gas chromatography–mass spectrometry (GC-MS) (Hewlett-Packard 5989 MS, HP 5890 GC; Hewlett Packard, Palo Alto, California, USA) of m + 1 (mass 141). Background enrichment was measured from blood samples obtained before 2H20 ingestion. HMTs of 0.125%, 0.25%, 0.5%, 0.75%, 1.0%, and 2.0% hydrogen-2 enrichment from 1-[2H1]sorbitol served as standards to calculate the fraction of blood glucose produced from GNG. GNG (μmol/kg/min) was calculated by multiplying C5/C2 with EGP. GL was calculated as the difference between EGP and GNG.
Enrichment of hydrogen-2 in plasma water was determined in six subjects (two participating in study 1, four in study 2) 14, 20, and 24 h after the last meal by Metabolic Solutions Inc. (Merrimack, New Hampshire, USA) with an isotope ratio mass spectrometer.
Glucose turnover.
Glucose turnover was determined with 3-[3H]glucose, which was infused intravenously for 9.5 h (14.5–24 h of fast), starting with a bolus of 40 μCi over 1 min followed by continuous infusion of 0.4 μCi/min. Glucose was isolated from blood for determination of 3-[3H]glucose specific activity as described (18). Rates of total body glucose appearance (GRa) and disappearance (GRd) were calculated using Steele's equation for non–steady-state conditions (19). The rates of endogenous glucose production (EGP) was equal to GRa, because no glucose was infused during these studies.
Glycerol turnover.
Glycerol turnover was determined with 2H5-glycerol (99.9% hydrogen-2; Mass Trace Inc., Woburn, Massachusetts, USA), which was infused from 14.5 to 24 h, starting with a bolus of 1.6 μmol followed by a continuous infusion of 0.1 μmol/min for 9.5 h. Enrichment of hydrogen-2 was determined by GC-MS as described previously (20). Rates of glycerol appearance (GlyRa) were calculated using Steele's equation for non–steady-state, corrected for the amount of exogenously infused isotope (21). Lipolysis was defined as GlyRa × 1, because lipolysis of 1 mol of triglyceride produces 1 mol of glycerol.
Fat oxidation.
Fat oxidation (FOX) was determined by indirect calorimetry (22) with a metabolic measurement cart (Sensor Medics, Yorba Linda, California, USA). Rates of protein oxidation were estimated from the urinary nitrogen excretion after correction for changes in urea nitrogen pool size (23). Rates of protein oxidation were used to determine the nonprotein respiratory quotient (npRQ). Rates of FOX were determined with the npRQ tables of Lusk, which are based on an npRQ of 0.707 for 100% fat oxidation and 1.00 for 100% carbohydrate oxidation.
Substrate and hormone analyses.
Plasma glucose was measured with a glucose analyzer (Beckman Instruments Inc., Fullerton, CA). Insulin was determined by RIA using an antiserum with minimal (<0.2%) cross-reactivity with proinsulin (Linco, St. Charles, Missouri, USA). Human growth hormone and glucagon were determined by RIA. Cortisol and epinephrine were measured with kits (cortisol kit provided by Diagnostic Products, Los Angeles, California, USA; epinephrine kit provided by Amersham Life Sciences Inc., Arlington Heights, Illinois, USA). Plasma FFA concentration was determined with a kit from Wako Pure Chemical Industries (Richmond, Virginia, USA).
Plasma glycerol, lactate, alanine, glutamine, glutamate, β-hydroxybutyrate (β-OHB), and acetoacetate (AcAc) were determined enzymatically.
Statistical analysis.
All data are expressed as the mean ± SEM. Statistical analysis was performed using the SAS program (SAS Institute Inc., Cary, North Carolina, USA). ANOVA with repeated measures was used to determine the differences in GNG, EGP, FFA, and GL across time points. Pairwise comparison to each time point was then performed if overall comparison was statistically significant. Correlations between GNG and FFA or FOX were determined by least-squares regression analysis.
Results
Plasma glucose, FFA, ketone bodies, and GNG precursors.
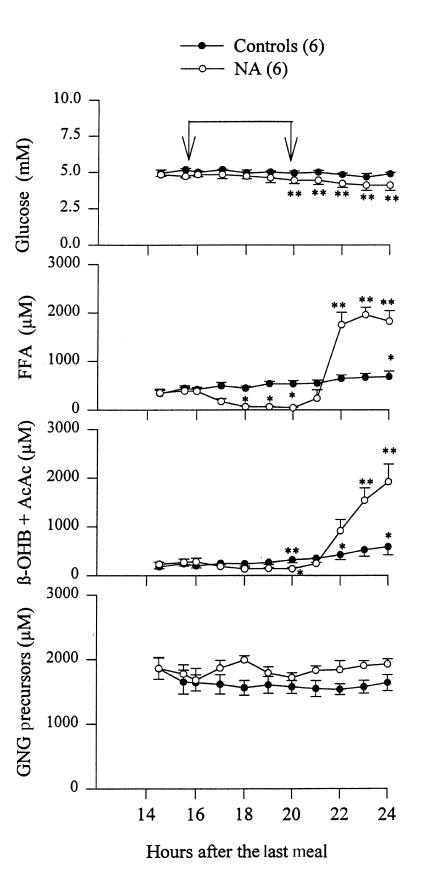
Plasma glucose concentrations in the control group (no NA; Fig. 1) were 5.0 ± 0.1 and 4.7 ± 0.1 mM, respectively, 16 and 24 hours after the last meal (not significant [ns]). In the NA-treated group, plasma glucose decreased from 4.8 ± 0.1 mM at 16 hours to 4.1 ± 0.1 mM at 24 hours (P < 0.01). Plasma FFA increased in the control group from 423 ± 45 μM at 16 hours to 681 ± 113 μM at 24 hours (P < 0.05). During administration of NA, plasma FFA first decreased from 387 ± 73 μM (at 16 hours) to 43 ± 10 μM (at 20 hours) (P < 0.05) and then rebounded (after discontinuation of NA at 20 hours) to 1823 ± 221 μM at 24 h (P < 0.01).
Figure 1.
Plasma concentrations of glucose, free fatty acids (FFA), ketone bodies (β-OHB + AcAc), and gluconeogenesis (GNG) precursors (lactate, alanine, glutamine, glutamate, and glycerol) between 14.5 and 24 h of fasting with (open circles) and without (closed circles) oral administration of NA (100–150 mg every 30 min from 16 to 20 h) in normal subjects. The time of NA administration is indicated by the arrows. Shown are mean ± SEM. *P < 0.05 compared with basal values (14.5 h), **P < 0.01 compared with basal values (14.5 h). AcAc, acetoacetate; β-OHB, β-hydroxybutyrate; NA, nicotinic acid.
Plasma ketone bodies (β-OHB plus AcAc) increased in controls from 198 ± 41 (at 16 hours) to 586 ± 167 μM (at 24 hours) (P < 0.05). During administration of NA, plasma ketone bodies first decreased from 281 ± 75 μM (at 16 hours) to 133 ± 28 μM (at 20 hours) (P < 0.05) and then rebounded after discontinuation of NA to 1918 ± 346 μM at 24 hours (P < 0.01).
Plasma GNG precursors (sum of plasma concentrations of the GNG precursors lactate, glycerol, alanine, glutamate, and glutamine) did not change in controls (1636 ± 125 μM at 16 hours vs. 1634 ± 125 μM at 24 hours) or during administration of NA (1677 ± 183 μM at 16 hours vs. 1714 ± 97 μM at 20 hours) or after discontinuation of NA (1925 ± 81 μM at 24 hours). Pyruvate was not measured in time to obtain reliable values (it is rather unstable). Pyruvate is usually ∼10% of lactate and would have added ∼80 μmol/l (4%–5%) to the sum of GNG precursors.
Insulin, glucagon, epinephrine, and cortisol.
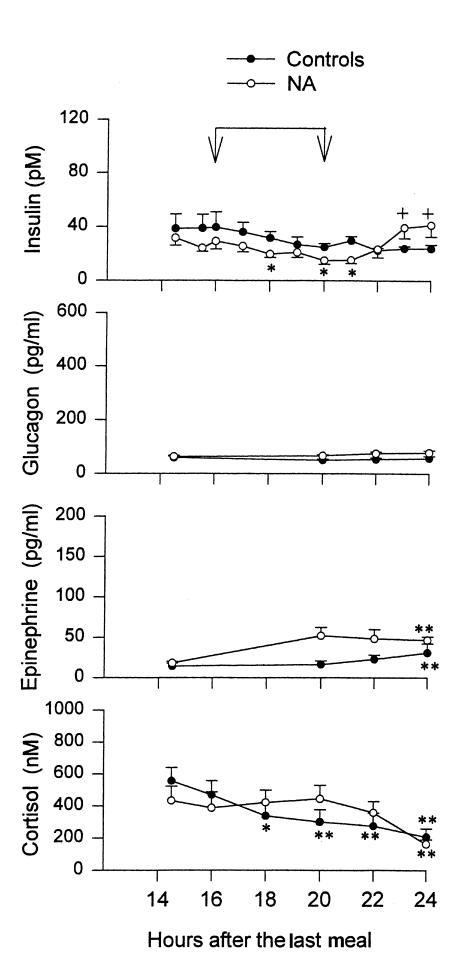
Serum insulin concentrations in the control group were 40 ± 11 pM (at 16 hours) and 24 ± 3 pM (at 24 hours) (ns; Fig. 2). During administration of NA, serum insulin decreased from 29 ± 6 pM (at 16 hours) to 16 ± 3 pM (at 20 hours) (P < 0.05) and then rebounded to 42 ± 9 pM at 24 hours (P < 0.05).
Figure 2.
Plasma concentrations of insulin, glucagon, epinephrine, and cortisol between 14.5 and 24 h of fasting with (open circles) and without (closed circles) oral administration of NA in normal subjects. Shown are mean ± SEM. Blood samples for glucagon and epinephrine measurements were collected at 14.5, 20, 22, and 24 h only. *P < 0.05 compared with basal values, **P < 0.01 compared with basal values, +P < 0.05 compared with 20 h values.
Plasma glucagon concentrations were 59 ± 6 and 64 ± 4 pg/ml, respectively, in the NA group and controls at 16 hours, and they did not change significantly during the next 8 hours in either group. Plasma epinephrine concentrations rose from 14 ± 4 pg/ml (at 16 hours) to 31 ± 11 pg/ml (at 24 hours) in controls, and from 18 ± 2 pg/ml (at 16 hours) to 47 ± 4 pg/ml (at 24 hours) during NA administration (both P < 0.01). Plasma cortisol decreased in controls, from 469 ± 89 nM at 16 hours to 208 ± 51 nM at 24 hours (P < 0.01). During administration of NA, plasma cortisol was 388 ± 100 nM at 16 hours, 443 ± 86 nM at 20 hours, and then decreased to 163 ± 28 nM at 24 hours (P < 0.01). There were no statistically significant differences between the NA-treated group and controls at any time. Human growth hormone was 0.37 ± 0.04 and 0.28 ± 0.04 ng/ml at 16 hours in the control and NA groups, respectively, and did not change significantly thereafter in either group (0.30 ± 0.04 and 0.34 ± 0.06 ng/ml, respectively, at 24 hours).
Lipolysis.
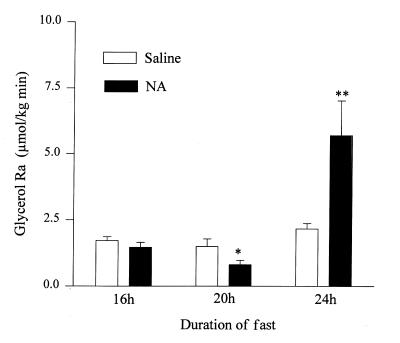
In controls, lipolysis rates (glycerol Ra) increased from 1.7 ± 0.2 at 16 hours to 2.2 ± 0.2 μmol/kg/min after 24 hours of fasting (ns; Fig. 3). During administration of NA, lipolysis rates first decreased from 1.5 ± 0.2 to 0.8 ± 0.2 μmol/kg/min (P < 0.05) between 16 hours and 20 hours and then increased sharply to 5.7 ± 1.3 μmol/kg/min at 24 hours (P < 0.02).
Figure 3.
Rates of lipolysis (Glycerol Ra) 16, 20, and 24 h after the last meal in controls (open bars) and before NA (16 h), after 4 h of NA (20 h), and 4 h after discontinuation of NA (24 h) (shaded bars). *P < 0.05 compared with basal (16 h) values, **P < 0.02 compared with basal (16 h) values.
GNG, GL, and EGP in controls.
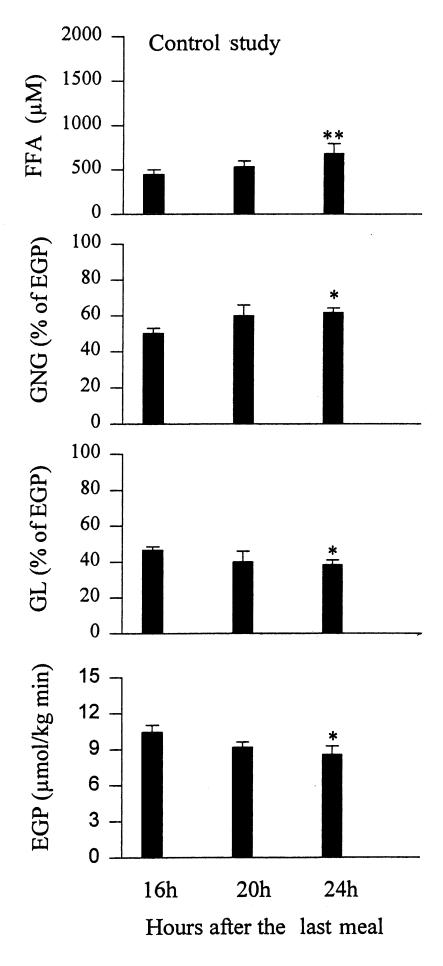
Rates of GNG increased from 50.3 ± 2.8% (at 16 hours) to 61.7 ± 2.7% of EGP (at 24 hours) (P < 0.05; Fig. 4).GNG (in absolute values) was 5.3 ± 0.5 μmol/kg/min (at 16 hours) and remained unchanged 8 hours later (5.3 ± 0.6 μmol/kg/min at 24 hours; Table 3). Rates of GL decreased from 49.7 ± 2.8% (at 16 hours) to 38.3 ± 2.7% of EGP (at 24 hours) (P < 0.05). GL (in absolute values) decreased from 5.2 ± 0.3 (at 16 hours) to 3.2 ± 0.2 μmol/kg/min (at 24 hours) (P < 0.05). Rates of EGP decreased from 10.7 ± 0.5 (at 16 hours) to 8.6 ± 0.7 μmol/kg/min (at 24 hours) (P < 0.05).
Figure 4.
Plasma free fatty acids (FFA) and rates of gluconeogenesis (GNG), glycogenolysis (GL) (both measured in percent of EGP), and endogenous glucose production (EGP) in controls 16, 20, and 24 h after the last meal. *P < 0.05 compared with basal (16 h) values, **P < 0.02 compared with basal (16 h) values.
Table 3.
Effect of NA on GNG and GL
GNG, GL, and EGP during and after administration of NA.
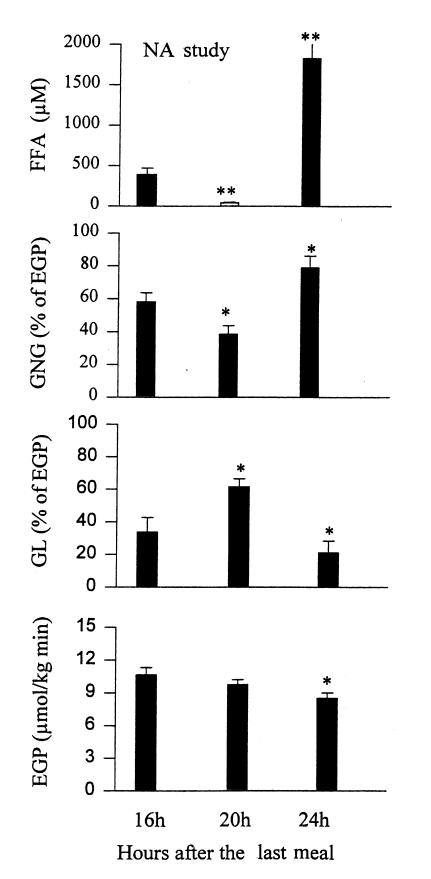
Rates of GNG first decreased from 58.1 ± 5.6 (at 16 hours) to 38.6 ± 5.2% of EGP (at 20 hours) (P < 0.05) and then rebounded to 78.9 ± 7.2% of EGP (at 24 hours) (P < 0.05; Fig. 5). GNG (in absolute values) decreased from 6.1 ± 0.7 (at 16 hours) to 3.8 ± 0.6 μmol/kg min (at 20 hours) (P < 0.02) and then rebounded to 6.8 ± 0.9 μmol/kg/min (at 24 hours) (P < 0.02; Table 3). GNG (absolute values) at 24 hours was not significantly different from GNG at 16 hours.
Figure 5.
Plasma free fatty acids (FFA) and rates of gluconeogenesis (GNG), glycogenolysis (GL) (both measured in percent of EGP), and endogenous glucose production (EGP) in controls before (16 h), after 4 h of NA (20 h), and 4 h after discontinuation of NA (24 h). *P < 0.05 compared with basal (16 h) values, **P < 0.001 compared with basal (16 h) values.
Rates of GL increased first from 41.9 ± 5.6% (at 16 hours) to 61.4 ± 5.2% of EGP (at 20 hours) (P < 0.05) and then decreased to 21.1 ± 7.2% of EGP (at 24 hours) (P < 0.05). GL (in absolute values) increased between 16 and 20 hours (from 4.5 ± 0.7 to 6.0 ± 0.6 μmol/kg min) (P < 0.02) and then decreased to 1.7 ± 0.6 μmol/kg/min at 24 h (P < 0.001). The decline in EGP during and after administration of NA was virtually identical to that in the controls decreasing from 10.6 ± 0.6 (at 16 hours) to 8.5 ± 0.5 μmol/kg/min (at 24 hours) (P < 0.05).
GNG during administration of NA plus lipid/heparin.
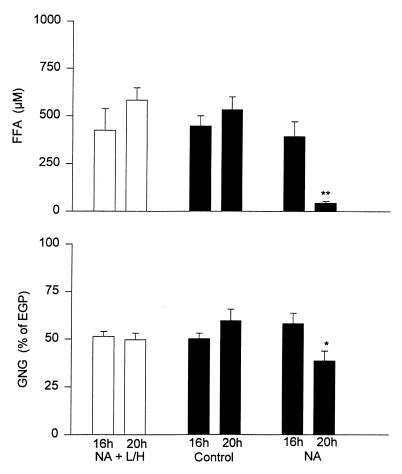
To test whether NA had direct effects on GNG, NA was given between 16 and 20 hours, and FFA was prevented from decreasing by intravenous infusion of lipid/heparin (L/H). Under these conditions, there was no significant increase either in plasma FFA (424 ± 113 vs. 582 ± 65 μM; ns) or in GNG (48.6 ± 2.6 vs. 50.3 ± 3.4%; ns). This was similar to the control studies (no NA, no L/H) but different from the NA studies, when both plasma FFA and GNG decreased significantly (Fig. 6).
Figure 6.
Plasma free fatty acid (FFA) concentrations and gluconeogenesis (GNG) (measured in percent of EGP) before (16 h) and after (20 h) 4 h of NA plus lipid/heparin (NA + L/H), NA, and controls (no NA, no L/H). n = 6 for all three groups. *P < 0.05 comparing 16 h and 20 h values, **P < 0.01 comparing 16 h and 20 h values.
FOX and GNG.
In controls, FOX rose from 5.9 ± 0.9 to 6.2 ± 1.2 μmol/kg/min between 16 hours and 24 hours (ns). During administration of NA, FOX declined from 6.0 ± 0.8 to 5.2 ± 1.3 μmol/kg/min between 16 and 20 hours (ns) and then increased to 9.6 ± 1.2 μmol/kg/min at 24 hours (P < 0.01). There was a highly significant positive correlation between FOX and GNG (r = 0.59, P < 0.001).
Discussion
The main goal of this study was to examine the effects of FFA on GNG. To determine in vivo rates of GNG, we have used the 2H20 method developed and validated recently by Landau et al. (14–16). Major advantages of this method compared with older methods are that it determines GNG from all precursors (including glycerol) and that it circumvents the problems related to the unknown concentration in the liver of GNG precursors that have plagued previous isotopic methods (8–10, 12, 13). Our experimental design consisted of a 24-hour fast, during which plasma FFA were first lowered (from 16 to 20 hours) with NA and then elevated (from 20–24 hours) as a result of the FFA rebound that predictably follows discontinuation of NA. Because NA inhibits the action of hormone sensitive lipase (24, 25), the observed changes in plasma FFA levels resulted from changes in adipose tissue lipolysis (Fig. 3). This approach avoided potential problems associated with the conventional way to elevate FFA (by infusion of triglyceride/heparin solutions), namely unphysiologically high concentrations of polyunsaturated fatty acids (particularly linoleic acid) and possible effects of heparin and hypertriglyceridemia (26).
FFA and GNG.
Our results demonstrated a close relationship between changes in FFA and GNG. When plasma FFA levels were lowered with NA (from 387 ± 73 to 43 ± 10 μM), GNG decreased from 58.1 ± 5.6 to 38.6 ± 5.2% of EGP (or in absolute values, from 6.1 ± 0.7 to 3.8 ± 0.6 μmol/kg/min) (P < 0.02). On the other hand, when plasma FFA levels increased during the FFA rebound (from 43 ± 10 to 1823 ± 221 μM), GNG increased (from 38.6 ± 5.2 to 78.9 ± 7.2% of EGP, or in absolute values, from 3.8 ± 0.6 to 6.8 ± 0.9 μmol/kg min; P < 0.02). In controls (no NA), in whom plasma FFA rose much more slowly (from 423 ± 45 to 681 ± 113 μM) between 16 and 24 hours of fasting, GNG increased (from 50.3 ± 1.8 to 61.7 ± 2.7% of EGP) (P < 0.05). In absolute values, however, GNG did not change. This suggested that modest elevation of basal plasma FFA levels may not be a major reason for the elevated EGP often seen in overnight-fasted obese patients with type 2 diabetes. Rather, changes in the hormonal milieu, particularly in insulin and glucagon levels, appear to be a more likely cause.
Several lines of evidence indicated that these changes in GNG were not caused by direct effects of NA on GNG. First, when NA was given together with a L/H infusion (to prevent plasma FFA from falling), GNG did not decrease as it did when NA was given alone. Second, the sharp increase in GNG during the FFA rebound occurred because of the disappearance of NA, which has a plasma half-life of 30–60 minutes (27). Third, Exton et al. (28) have reported that NA had no direct effect on GNG in isolated perfused rat livers.
During these studies, some factors known to affect GNG, including plasma glucagon and growth hormone, remained stable. In view of the short plasma half-life of glucagon (approximately five minutes), it is possible, however, that we may have missed increases in plasma glucagon levels occurring between the two-hourly blood samplings. Epinephrine rose, but the increase was too small to have biologic effects (29). Insulin and cortisol concentrations, however, changed. It was, therefore, necessary to consider whether and in what way these changes may have influenced the results. The changes in serum insulin concentrations were small (Fig. 2). Because insulin is a strong inhibitor of GNG (30), its decrease during administration of NA, if anything, would have reduced the observed decrease in GNG, and its increase would have reduced the observed increase during the FFA rebound. Thus, it is possible that the changes in insulin may have resulted in an underestimation of the effect of FFA on GNG. Cortisol remained unchanged during administration of NA (433 ± 89 vs. 443 ± 86 nM) but decreased during the FFA rebound (from 443 ± 86 to 163 ± 28 nM) (P < 0.01) and in controls (from 469 ± 89 to 208 ± 51 nM) (P < 0.01). Because cortisol is known to stimulate GNG (31), the fall in plasma cortisol may have diminished the observed increase in GNG during the FFA rebound and in controls, again resulting in underestimation of GNG. Hence, the changes in insulin and cortisol levels may have resulted in underestimation of FFA-induced GNG changes, but they did not affect the conclusion that FFA strongly and acutely influenced GNG.
The results of the control study were in good agreement with previous reports by others. For instance, Landau et al. (15) found that GNG contributed 67 ± 4% of total EGP in eight healthy males and females after 22 hours of fasting; Kalhan et al. (32), who also used the 2H20 method, reported that GNG contributed between 51% and 77% of EGP after 19 hours of fasting in nonpregnant women. Our estimates for GNG also agreed with those reported by Petersen et al. (33), who used [13C]NMR to determine hepatic glycogen concentration and magnetic resonance imaging to assess changes in liver volume to calculate rates of GL. These investigators reported that GNG in normal subjects contributed an average of 55 ± 6% of EGP between 5 and 12 hours after a large evening meal. The minor differences between these values and ours may have been due to differences in the dietary intake preceding the studies. On the other hand, estimations of GNG based on net splanchnic uptake of glucogenic precursors have generally resulted in values ranging from 25% to 35% (34–36). These lower values can be explained, at least in part, by the fact that the splanchnic balance technique does not measure renal GNG, estimated to account for 5%–25% of EGP after an overnight fast (37), and in addition, that it does not detect GNG from precursors released from the splanchnic bed (including lactate and glutamine).
The mechanism by which FFA regulate GNG was not specifically investigated. It has been proposed that FFA promote GNG by increasing the production of ATP and NADH and by increasing pyruvate carboxylase activity via acetyl-CoA or long-chain fatty acyl-CoA, which are generated during FFA oxidation (7, 38). The positive correlation between fatty acid oxidation and GNG in this study was compatible with this mechanism. On the other hand, the ATP/NADH hypothesis has been challenged by Jungas et al. (39), who reported that GNG is driven mainly by amino acid oxidation without the need for ATP generation from other fuels.
FFA and GL.
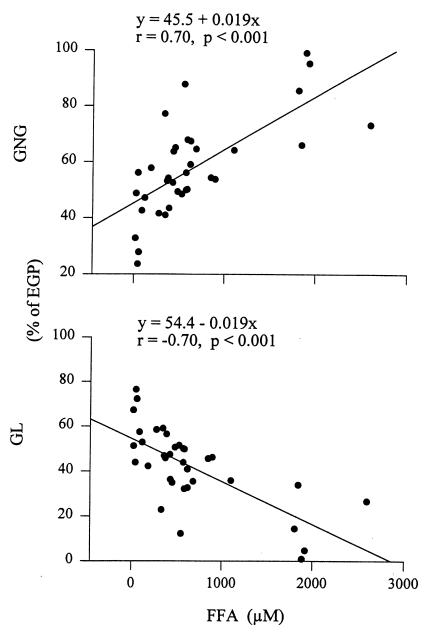
EGP is the sum of glucose produced by GNG and GL. Therefore, knowing rates of EGP and GNG enabled us to calculate rates of GL. As was the case with GNG, there was also a close relationship between FFA and GL: whenever plasma FFA rose during fasting or during the FFA rebound, GL decreased, and vice versa. Moreover, all changes in GL were accompanied by changes in GNG in the opposite direction (Fig. 7). Whereas these changes in GNG and GL were reciprocal, they were not of equal size. During the FFA rebound, the increase in GNG (3.0 ± 1.0 μmol/kg/min) was less than the decrease in GL (4.3 ± 0.5 μmol/kg/min (P < 0.03), resulting in a decrease in EGP of 1.3 μmol/kg/min. Similarly, in controls, the increase in GNG (0.3 ± 0.2 μmol/kg/min) was less than the decrease in GL and EGP (2.1 ± 0.2 μmol/kg min (P < 0.05). Thus, EGP decreased slowly (from ∼10.7 to 8.6 μmol/kg/min) between 16 and 24 hours after the last meal, regardless of whether plasma FFA and GNG increased, decreased, or remained unchanged. It appears, therefore, that this decrease in EGP was related to the fact that all study subjects were fasting, rather than to changes in their plasma FFA levels. Fasting reduces glycogen stores, which makes it increasingly difficult to raise GL. Hence, one would expect that FFA-induced changes in GL during a fast will depend to a large degree on the state of glycogen stores; i.e., it is likely that changes in plasma FFA would have produced reciprocal matching changes in GNG and GL had the glycogen stores been intact. On the other hand, the longer the fast and the lower the glycogen stores, the more difficult it will probably be to compensate for changes in GNG with reciprocal matching changes in GL.
Figure 7.
Correlation between plasma free fatty acids (FFA) and gluconeogenesis (GNG) and glycogenolysis (GL). Data from control and NA studies are included.
It has been observed by others previously (8, 9, 40–42) that changes in GNG did not result in similar changes in EGP. To explain this hepatic autoregulation, several mechanisms have been proposed, including glucose cycling (8), reciprocal matching changes in GNG (11, 12), and changes in GL (42). Several of these mechanisms can be excluded. FFA have been shown not to increase glucose cycling (from glucose-glucose-6-P to glucose, and back) (40). Glucose released from glycogen cycling has been reported to be undetectably low (0 ± 0.002 mmol/l of liver/min) (43). But even if there was glycogen cycling, it should not change the C5/C2 ratio (15). Reciprocal matching changes in GNG (i.e., rising GNG from some precursors matched by decreasing GNG from other precursors) was ruled out by the demonstration in this study that absolute values of GNG changed in response to changing FFA levels. Our data thus supported the notion that reciprocal changes in GL and GNG are the most likely reason for the FFA-mediated hepatic autoregulation of EGP.
The biochemical mechanism by which FFA stimulated GNG and inhibited GL, or vice versa, remains to be explored. We hypothesize that a possible mechanism may be FFA generation of ATP. An increase in the ATP/AMP ratio has been shown to increase GNG and to be a potent allosteric inhibitor of glycogen phosphorylase, the enzyme that controls glycogenolysis (44).
We have shown in normal healthy controls that (a) acute changes in plasma FFA produced acute changes in GNG, which were accompanied by reciprocal changes in GL, and that, therefore, changes in plasma FFA had little or no effect on EGP; (b) the slow and continuous decrease in EGP that occurred between 16 and 24 hours of fasting was essentially due to a fall in GL; and (c) NA had no direct effect on GNG.
Acknowledgments
We are greatly indebted to B. Landau, V. Chandramouli, and W. Schuman for helping us with the 2H20 method to measure GNG. We thank the nurses of the General Clinical Research Center for help with the studies and for excellent patient care, Karen Kresge and Maria Mozzoli for outstanding technical assistance, and Constance Harris-Crews for typing the manuscript. This work was supported by National Institutes of Health grants R01-AG-07988, R01-AA-10221 (to G. Boden), and RR-349 (to General Clinical Research Center).
References
- 1.Cahill GF., Jr Starvation in man. N Engl J Med. 1970;282:668–675. doi: 10.1056/NEJM197003192821209. [DOI] [PubMed] [Google Scholar]
- 2.Williamsson JF, Kreisberg RA, Felts PW. Mechanisms for the stimulation of gluconeogenesis by fatty acids in perfused rat liver. Proc Natl Acad Sci USA. 1966;6:247–254. doi: 10.1073/pnas.56.1.247. [DOI] [PMC free article] [PubMed] [Google Scholar]
- 3.Gonzalez-Manchon C, Ayuso M, Parrilla R. Control of hepatic gluconeo-genesis: role of fatty acid oxidation. Arch Biochem Biophys. 1989;271:1–9. doi: 10.1016/0003-9861(89)90249-x. [DOI] [PubMed] [Google Scholar]
- 4.Morand C, Remesy C, Demigne C. Fatty acids are potent modulators of lactate utilization in isolated hepatocytes from fed rats. Am J Physiol. 1993;264:E816–E823. doi: 10.1152/ajpendo.1993.264.5.E816. [DOI] [PubMed] [Google Scholar]
- 5.Arinze I, Hanson R. Mitochondrial redox state and the regulation of gluconeo-genesis in the isolated, perfused cat liver. FEBS Lett. 1973;31:280–282. doi: 10.1016/0014-5793(73)80122-x. [DOI] [PubMed] [Google Scholar]
- 6.Corredor C, Brendel K, Bressler R. Effects of 4-pentenoic acid on carbohydrate metabolism in pigeon liver homogenate. J Biol Chem. 1969;244:1212–1219. [PubMed] [Google Scholar]
- 7.Jomain-Baum M, Hanson R. Regulation of hepatic gluconeogenesis in the guinea pig by fatty acids and ammonia. J Biol Chem. 1975;250:8978–8985. [PubMed] [Google Scholar]
- 8.Clore JN, Glickman PS, Helm ST, Nestler JE, Blackard WG. Evidence for dual control mechanism regulating hepatic glucose output in nondiabetic men. Diabetes. 1991;40:1033–1040. doi: 10.2337/diab.40.8.1033. [DOI] [PubMed] [Google Scholar]
- 9.Puhakainen I, Yki-Jarvinen H. Inhibition of lipolysis decreases lipid oxidation and gluconeogenesis from lactate but not fasting hyperglycemia or total hepatic glucose production in NIDDM. Diabetes. 1993;42:1694–1699. doi: 10.2337/diab.42.12.1694. [DOI] [PubMed] [Google Scholar]
- 10.Fery F, Plat L, Melot C, Balasse EO. Role of fat derived substrates in the regulation of gluconeogenesis during fasting. Am J Physiol. 1996;270:E822–E830. doi: 10.1152/ajpendo.1996.270.5.E822. [DOI] [PubMed] [Google Scholar]
- 11.Steele R, Winkler B, Altszuler N. Inhibition by infused glycerol on gluconeo-genesis from other precursors. Am J Physiol. 1971;221:883–888. doi: 10.1152/ajplegacy.1971.221.3.883. [DOI] [PubMed] [Google Scholar]
- 12.Jahoor F, Peters EJ, Wolfe RR. The relationship between gluconeogenic substrate supply and glucose production in humans. Am J Physiol. 1990;258:E288–E296. doi: 10.1152/ajpendo.1990.258.2.E288. [DOI] [PubMed] [Google Scholar]
- 13.Katz J. Determination of gluconeogenesis in vivo with 14C-labeled substrates. Am J Physiol. 1985;248:R391–R399. doi: 10.1152/ajpregu.1985.248.4.R391. [DOI] [PubMed] [Google Scholar]
- 14.Landau BR, et al. Use of 2H20 for estimating rates of gluconeogenesis. Application to the fasted state. J Clin Invest. 1995;95:172–178. doi: 10.1172/JCI117635. [DOI] [PMC free article] [PubMed] [Google Scholar]
- 15.Landau BR, et al. Contributions of gluconeogenesis to glucose production in the fasted state. J Clin Invest. 1996;98:378–385. doi: 10.1172/JCI118803. [DOI] [PMC free article] [PubMed] [Google Scholar]
- 16.Landau BR. Stable isotope techniques for the study of gluconeogenesis in man. Horm Metab Res. 1997;29:334–336. doi: 10.1055/s-2007-979047. [DOI] [PubMed] [Google Scholar]
- 17.Rognstad R. Estimation of gluconeogenesis and glycogenolysis in vivo using tritiated water. Biochem J. 1991;279:911. doi: 10.1042/bj2790911. [DOI] [PMC free article] [PubMed] [Google Scholar]
- 18.Shimoyama R, et al. In vivo and in vitro effects of antiinsulin receptor antibodies. J Clin Endocrinol Metab. 1984;59:916–923. doi: 10.1210/jcem-59-5-916. [DOI] [PubMed] [Google Scholar]
- 19.Steele R, Wall JS, DeBodo RC, Altszuler N. Measurement of size and turnover rate of body glucose pool by the isotope dilution method. Am J Physiol. 1956;187:15–24. doi: 10.1152/ajplegacy.1956.187.1.15. [DOI] [PubMed] [Google Scholar]
- 20.Chen X, Ruiz J, Boden G. Release, oxidation, and reesterification of fatty acids from infused triglycerides: effect of heparin. Metabolism. 1995;44:1590–1595. doi: 10.1016/0026-0495(95)90080-2. [DOI] [PubMed] [Google Scholar]
- 21.Rosenblatt JI, Wolfe RR. Calculation of substrate flux using stable isotopes. Am J Physiol. 1988;254:E526–E531. doi: 10.1152/ajpendo.1988.254.4.E526. [DOI] [PubMed] [Google Scholar]
- 22.Owen OE, et al. Effects of therapy on the nature and quantity of fuels oxidized during diabetic ketoacidosis. Diabetes. 1980;29:365–372. doi: 10.2337/diab.29.5.365. [DOI] [PubMed] [Google Scholar]
- 23.Tappy L, Owen OE, Boden G. Effect of hyperinsulinemia on urea pool size and substrate oxidation rates. Diabetes. 1988;37:1212–1216. doi: 10.2337/diab.37.9.1212. [DOI] [PubMed] [Google Scholar]
- 24.Carlson, L.A. 1971. Nicotinic acid, its metabolism and its effects on plasma free fatty acids. In Metabolic effects of nicotinic acid and its derivatives. K.F. Gey and L.A. Carlson, editors. Verlag Hans Huber. Bern, Switzerland. 157–165.
- 25.Fuccella LM, et al. Inhibition of lipolysis by nicotinic acid and by acipimox. Clin Pharmacol Ther. 1980;28:790–795. doi: 10.1038/clpt.1980.236. [DOI] [PubMed] [Google Scholar]
- 26.Piatti PM, et al. Effects of an acute increase in plasma triglyceride levels on glucose metabolism in man. Metabolism. 1995;44:883–889. doi: 10.1016/0026-0495(95)90241-4. [DOI] [PubMed] [Google Scholar]
- 27.Hotz W. Nicotinic acid and its derivatives: a short survey. Adv Lipid Res. 1983;20:195–217. [PubMed] [Google Scholar]
- 28.Exton, J.H., Lewis, S.B., and Park, C.R. 1971. Examination of in vitro effects of nicotinic acid on basal and hormone-stimulated glycogenolysis, gluconeogenesis, ureogenesis and ketogenesis in the isolated perfused rat liver. In Metabolic effects of nicotinic acid and its derivatives. K.F. Gey and L.A. Carlson, editors. Verlag Hans Huber. Bern, Switzerland. 851–859.
- 29.Clutter WE, Bier DM, Shah SD, Cryer PE. Epinephrine plasma metabolic clearance rates and physiologic thresholds for metabolic and hemodynamic actions in man. J Clin Invest. 1980;66:94–101. doi: 10.1172/JCI109840. [DOI] [PMC free article] [PubMed] [Google Scholar]
- 30.Pilkis SJ, El-Marghrabi MR, Claus TH. Hormonal regulation of hepatic gluconeogenesis and glycolysis. Annu Rev Biochem. 1988;57:755–783. doi: 10.1146/annurev.bi.57.070188.003543. [DOI] [PubMed] [Google Scholar]
- 31.McMahon M, Gerich J, Rizza R. Effects of glucocorticoids on carbohydrate metabolism. Diabetes Metab Rev. 1988;4:17–30. doi: 10.1002/dmr.5610040105. [DOI] [PubMed] [Google Scholar]
- 32.Kalhan S, Rossi K, Gruca L, Burkett E, O’Brien A. Glucose turnover and gluconeogenesis in human pregnancy. J Clin Invest. 1997;100:1775–1781. doi: 10.1172/JCI119704. [DOI] [PMC free article] [PubMed] [Google Scholar]
- 33.Petersen KF, Price T, Cline GW, Rothman DL, Shulman GI. Contribution of net hepatic glycogenolysis to glucose production during the early postprandial period. Am J Physiol. 1996;33:E186–E191. doi: 10.1152/ajpendo.1996.270.1.E186. [DOI] [PubMed] [Google Scholar]
- 34.Bratusch-Marrain P, Bjorkman O, Hagenfeldt L, Waldhausl W, Wahren J. Influence of arginine on splanchnic glucose metabolism in man. Diabetes. 1979;28:126–131. doi: 10.2337/diab.28.2.126. [DOI] [PubMed] [Google Scholar]
- 35.Bjorkman O, Gunnarsson R, Hagstrom E, Felig P, Wahren J. Splanchnic and renal exchange of infused fructose in insulin-deficient type I diabetic patients and healthy controls. J Clin Invest. 1989;83:52–59. doi: 10.1172/JCI113884. [DOI] [PMC free article] [PubMed] [Google Scholar]
- 36.Wahren J, Wennlund A, Nilsson LH, Felig P. Influence of hyperthyroidism on splanchnic exchange of glucose and gluconeogenic precursors. J Clin Invest. 1981;67:1056–1063. doi: 10.1172/JCI110117. [DOI] [PMC free article] [PubMed] [Google Scholar]
- 37.Stumvoll M, et al. Uptake and release of glucose by the human kidney: postabsorptive rates and responses to epinephrine. J Clin Invest. 1995;96:2528–2533. doi: 10.1172/JCI118314. [DOI] [PMC free article] [PubMed] [Google Scholar]
- 38.Williamson J, Browing E, Scholz R. Control mechanisms of gluconeogenesis and ketogenesis. J Biol Chem. 1969;224:4607–4616. [PubMed] [Google Scholar]
- 39.Jungas RL, Halperin ML, Brosnan JT. Quantitative analysis of amino acid oxidation and related gluconeogenesis in humans. Physiol Rev. 1992;72:419–448. doi: 10.1152/physrev.1992.72.2.419. [DOI] [PubMed] [Google Scholar]
- 40.Clore JN, Glickman PS, Nestler JE, Blackard WG. In vivo evidence for hepatic autoregulation during FFA-stimulated gluconeogenesis in normal humans. Am J Physiol. 1991;261:E425–E429. doi: 10.1152/ajpendo.1991.261.4.E425. [DOI] [PubMed] [Google Scholar]
- 41.Fanelli C, et al. Demonstration of a critical role for free fatty acids in mediating counterregulatory stimulation of gluconeogenesis and suppression of glucose utilization in humans. J Clin Invest. 1993;92:1617–1622. doi: 10.1172/JCI116746. [DOI] [PMC free article] [PubMed] [Google Scholar]
- 42.Jenssen T, Nurjhan N, Consoli A, Gerich JA. Failure of substrate-induced gluconeogenesis to increase overall glucose appearance in normal humans. Demonstration of hepatic autoregulation without a change in plasma glucose concentration. J Clin Invest. 1990;86:489–497. doi: 10.1172/JCI114735. [DOI] [PMC free article] [PubMed] [Google Scholar]
- 43.Petersen KF, Laurent D, Rothman DL, Cline GW, Shulman GI. Mechanism by which glucose and insulin net hepatic glycogenolysis in humans. J Clin Invest. 1998;101:1203–1209. doi: 10.1172/JCI579. [DOI] [PMC free article] [PubMed] [Google Scholar]
- 44.Hers HG. The control of glycogen metabolism in the liver. Annu Rev Biochem. 1976;45:167–190. doi: 10.1146/annurev.bi.45.070176.001123. [DOI] [PubMed] [Google Scholar]


