Abstract
Background
Prediction of functional modules is indispensable for detecting protein deregulation in human complex diseases such as cancer. Bayesian network (BN) is one of the most commonly used models to integrate heterogeneous data from multiple sources such as protein domain, interactome, functional annotation, genome-wide gene expression, and the literature.
Methods and Results
In this paper, we present a BN classifier that is customized to: 1) increase the ability to integrate diverse information from different sources, 2) effectively predict protein-protein interactions, 3) infer aberrant networks with scale-free and small world properties, and 4) group molecules into functional modules or pathways based on the primary function and biological features. Application of this model on discovering protein biomarkers of hepatocelluar carcinoma (HCC) leads to the identification of functional modules that provide insights into the mechanism of the development and progression of HCC. These functional modules include cell cycle deregulation, increased angiogenesis (e.g., vascular endothelial growth factor, blood vessel morphogenesis), oxidative metabolic alterations, and aberrant activation of signaling pathways involved in cellular proliferation, survival, and differentiation.
Conclusion
The discoveries and conclusions derived from our customized BN classifier are consistent with previously published results. The proposed approach for determining BN structure facilitates the integration of heterogeneous data from multiple sources to elucidate the mechanisms of complex diseases.
Keywords: systems biology, statistical model, genomics, genetics, bioinformatics, bioinformatics, functional genomics, gene expression, statistical model, computational biology, protein-protein interaction
Introduction
Complex biological networks underlying cell and organ functions cannot be explained by considering merely individual genes, proteins or pathways.1 The increased collection and accumulation of high-throughput omic data from a large number of studies in genomics, transcriptomics, proteomics, metabolomics, and interactomics provide an opportunity to model useful biological networks for biomarker discovery.2 The integration of omic data from multiple sources can help understand normal cellular responses and potential dysfunctions in cancers.3 This may subsequently lead to a better understanding of the mechanisms of the genesis, development, and metastasis of various cancers. However, modeling biological networks and extracting useful information from a wealth of data sources are challenging. The main difficulties include: 1) selecting a reliable and efficient framework to build a computational model, 2) reducing the intrinsic high noise and bias in the data, 3) integrating heterogeneous and incomplete data, and 4) dealing with the inconsistency of results from various omic studies reported by different groups.
A variety of approaches have been applied to model biological networks by integrating data from multiple sources. These methods include graph theory,4 fuzzy logic model,5 text mining,6 decision tree,7 support vector machine (SVM),8 relevance vector machine (RVM),9 and Bayesian network (BN) classifier.10 SVM is a theoretically well motivated algorithm that searches for a decision boundary maximizing the margin of separation between pre-specified classes. It enjoys important properties such as convexity and nonlinearity using kernels and has been applied successfully in classification problems. Compared with SVM, the BN classifier offers an attractive alternative for inferring biological networks by integrating multiple data sets. BN is a probabilistic model based on directed acyclic graphs (DAGs) that allow efficient and effective representation of the joint probability distribution over a set of random variables.11 It learns from the training data the conditional independent relationships among features (f1, f2, …, fn) given the class label y. Then classification is done by computing the probability of each state of y given a particular instance of f1, f2, …, fn by Bayes rule and selecting the class with the highest posterior probability. The core task is to determine the network structure.12 If all the features are conditionally dependent given the class, the BN classifier reduces to a full Bayesian network (FBN) classifier, which substantially increases the computational complexity and potentially leads to an overfitting problem. On the other hand, if all features are conditionally independent given y, the BN classifier reduces to a Naïve Bayes (NB) classifier, which may bias the likelihood function estimation because that it fails to account for the conditional dependence among the features given y. This paper proposes a method that integrates data from multiple sources to construct a BN classifier that reflects the conditional dependence among features given the class and applies the model to predict aberrant functional modules in hepatocellular carcinoma (HCC).13
Methods
Framework
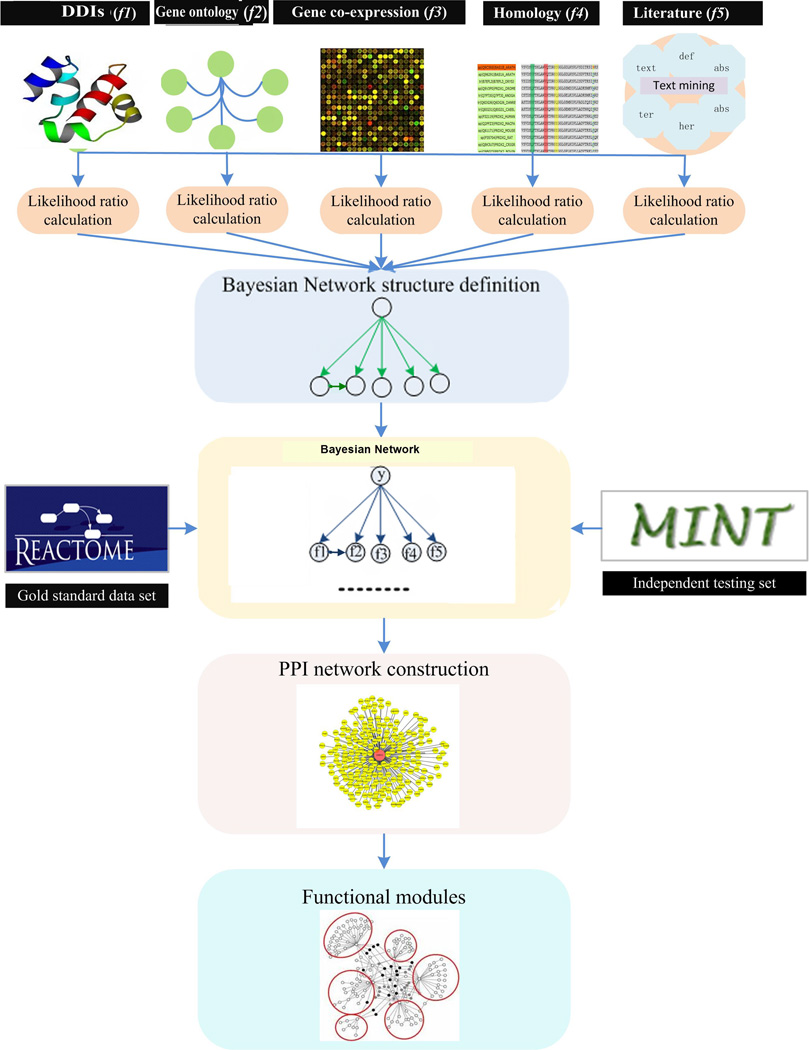
The proposed framework is shown in Figure 1. It starts with the collection of biological features from different databases. We selected five features relevant for predicting protein-protein interactions based on domain-domain interactions, biological process, gene expression, homology, and from the literature as shown in Table 1. We then built a BN classifier integrating different features to predict the class (i.e., whether a protein pair is interacting or not). There are two essential steps in constructing a BN classifier: 1) infer the structure of the BN which encodes the conditional independence relationship among the features given the class, and 2) predict the class by calculating and comparing the posterior probability of each class given all the features. Once the BN classifier is learned from the training data, we collected potential HCC protein biomarkers using text mining strategy and constructed an HCC PPI network. Finally, the Girvan and Newman (GN) algorithm14 was applied to detect functional modules. Below is a detailed description of each step.
Figure 1.
Proposed data integration framework to predict protein-protein interactions, construct HCC PPI network and detect functional modules.
Table 1.
The data sources integrated for the prediction of human protein-protein interactions
Data sources
The data sources for the features considered in this study are summarized in Table 1. They are:
Domain-Domain interactions (DDIs, f1). Proteins consist of one or multiple domains, which are structural or functional units of protein. In many cases, DDIs are crucial clues of protein interactions. Therefore, DDIs can be key supporting evidence for protein interaction mechanisms.15,16 Protein domain and protein family assignments were downloaded from the UniDomInt database. It contains 15,625 DDIs of 4,470 distinct protein family (Pfam) domains and combines nine different domain interaction prediction methods to provide a score that captures the reliability of the DDI.17 This reliability score was used as the DDI feature, f1.
Gene Ontology (GO, f2). GO characterizes biological annotation of gene products using terms from hierarchical ontologies.18 It aims to provide consistent descriptions of gene products in different databases. Various methods have sought to infer PPIs using their associated GO terms.19 There are about 2,000 biological processes and about 2 million protein pairs in the database. We denoted f2 the number of co-occurrence of protein pairs in the same biological process or functional class, which was used as a measure of their interactions.
Gene co-expression (CO, f3). Gene expression level is a good complement to investigate protein-protein interactions. It has been shown that interacting proteins have similar expression patterns (i.e., are co-expressed).20 Therefore, gene co-expression is one of the key supporting evidence for protein-protein interactions. For example, Qi et al.21 used 16 gene expression data from GEO to predict protein-protein interactions. We downloaded from Coxpressdb14 (http://coxpressdb.jp/) the expression patterns of 19,777 human genes in 123 experiments deposited in ArrayExpress. The Pearson correlation coefficients calculated for each of the 195,554,976 gene pairs by Coxpressdb were used as the gene co-expression feature, f3.
Homology (HOM, f4). Various protein-protein interactions are conserved across species.22 It is well established that many of the protein-protein interactions are confirmed via homology.23 Homology information was obtained from Hitdb (Homologous Interactions Database), which provides high confidence homologous interactions that are experimentally determined from IntAct, BioGRID, and HPRD by PSI-Blast18 (http://hintdb.hgc.jp/hint/). We considered 92,734 human homologous protein pairs. The Hintdb homology pair scores were used as the homology feature, f4.
Literature (LIT, f5). Protein-protein interaction database resources capture only a portion of the experimental interactions. Information on other experimentally detected interactions can be extracted from the literature by searching PubMed and other online resources using text mining tools. The higher the co-citation frequency of two proteins, the more likely they are functionally related. Using a Java package developed in-house, 60,888 protein pairs that had been cited together at least once were selected and the co-citation for each pair was used as a measure of the strength of their interaction. As a result, 60,888 protein pairs were selected and the co-citation frequencies were used as f5.
Training data
To train the BN classifier, we need gold standard positive (GSP) and gold standard negative (GSN) sets. Two proteins can be considered to constitute a positive pair if they are known to interact in the same pathway. The selection of an appropriate GSP set is essential to build an accurate BN classifier and to obtain reliable PPI prediction. We queried the Reactome database,24 which consists of structured information on 1,371 biological pathways involving 6,571proteins and 5,763 complexes. We used the resulting 68,285 distinct PPIs to construct a GSP set. The selection of a GSN set is based on identifying protein pairs that are not involved in the same pathway. There are three different ways to generate a GSN set:10 (i) two non-interacting genes can be obtained by considering pairs that have no interaction in any biological pathway; (ii) pairs from different cellular localizations are considered unlikely to interact; and (iii) a random set of protein pairs can be selected after filtering the positive pairs. We used the last method to select 98,589 protein pairs from the Reactome database to construct the GSN set.
Bayesian network classifier
Bayesian network is a type of graphical model that consists of a directed acyclic graph G and a set of probability distributions P, where nodes represent random variables, edges represent direct dependence between two nodes, and P is the set of local probability distributions for each node. More precisely, the network encodes the following conditional independence statements: each variable is independent of its non-descendants in the graph given the state of its parents. Given a set of features f1, f2, …, fn, BN classifiers can return the state of the outcome y that maximizes the posterior probability p(y| f1, f2, …, fn) based on the BN structure. They have been widely used in the integration of data from multiple sources and the prediction of biological networks and pathways.10, 25
Following Bayes rule, the posterior odds (Opost) for a protein pair is defined as the ratio of the probability that the class is one, y=1 (i.e., this pair of proteins is interacting) given all features f1, f2, …, fn to the probability that the class is zero, y=0 (i.e., this pair of proteins is not interacting) given all features. It equals to the product of the likelihood ratio (LR) and the prior odds (Oprior) as shown in Eq. (1).
| (1) |
where p(y=1) and p(y=0) are the prior probabilities specified as the proportion of interacting and non-interacting protein pairs in the gold standard sets, which are calculated empirically. In the special case of some features (fM+1, … fn) being conditionally independent given y, the LR for the combined features (f1, f2, …, fn) is:
| (2) |
According to Eq. (1), we compute Opost for a pair of proteins and classify the two proteins as interacting pair if Opost > 1, i.e.,
| (3) |
The larger the Opost, the more likely that this interaction is true.
BN structure determination
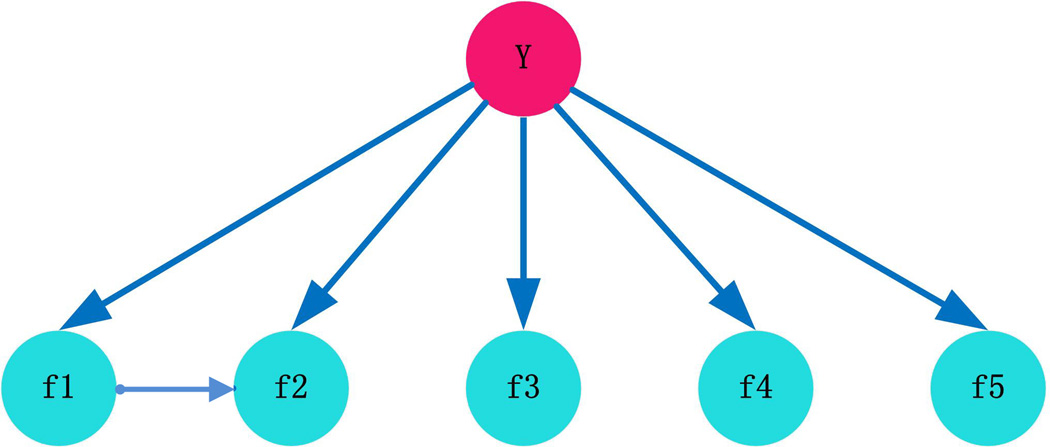
The BN structure should capture the predominant dependencies and be as parsimonious as possible. Among the five features we used, Rhodes et al. showed the dependence between DDI and GO and suggested proteins should be assigned to biological process based on their domains.3 Browne et al. used correlation to measure the dependence between DDI and GO.26 To measure quantitatively the conditional dependence among features f1, f2, …, fn given the state of y, we computed the Pearson correlation coefficient between each pair of f1, f2, …, fn under different states of y. We tested whether the correlation between each pair is significantly different from zero and corrected for multiple testing using the Benjamini-Hochberg (BH) false discovery rate (FDR) procedure. We found statistically significant correlation between f1 and f2 (cor (f1,f2|y=1)=0.26; cor(f1,f2|y=0)=0.21; both with adjusted p-values < 0.001). This suggests conditional dependence between f1 and f2 while f3, f4 and f5 were deemed to be conditional independent features given the state of y. In addition, we discretized the feature value into four bins based on their respective quartiles and adjusted the size to make sure that sufficient protein pairs are contained in each bin. Spearman’s correlation coefficients were calculated for each pair of f1, f2, …, fn given the state of y. All the correlations had BH-FDR adjusted p-values greater than 0.001, except for the correlation between f1 and f2 (cor(f1,f2| y=1)=0.418, cor(f1,f2| y=0)=0.3978 both with adjusted p-values<0.001). This indicates that the conditional dependence between f1 and f2 given y is maintained after discretizing the features into bins. In view of this, we proposed the BN structure shown in Figure 2; the arrow from DDI to GO depicts the conditional dependence between f1 and f2 given y and agrees with the suggestions of previously published paper.3 In this case, for the likelihood ratio in Eq. (2), it can be rewritten as follows:
| (4) |
Figure 2.
The network structure of the customized BN classifier. f1, f2, f3 f4 and f5 correspond to the five features listed in Table 1. Y represents the class (i.e., whether two proteins are interacting or not).
Predicting PPIs
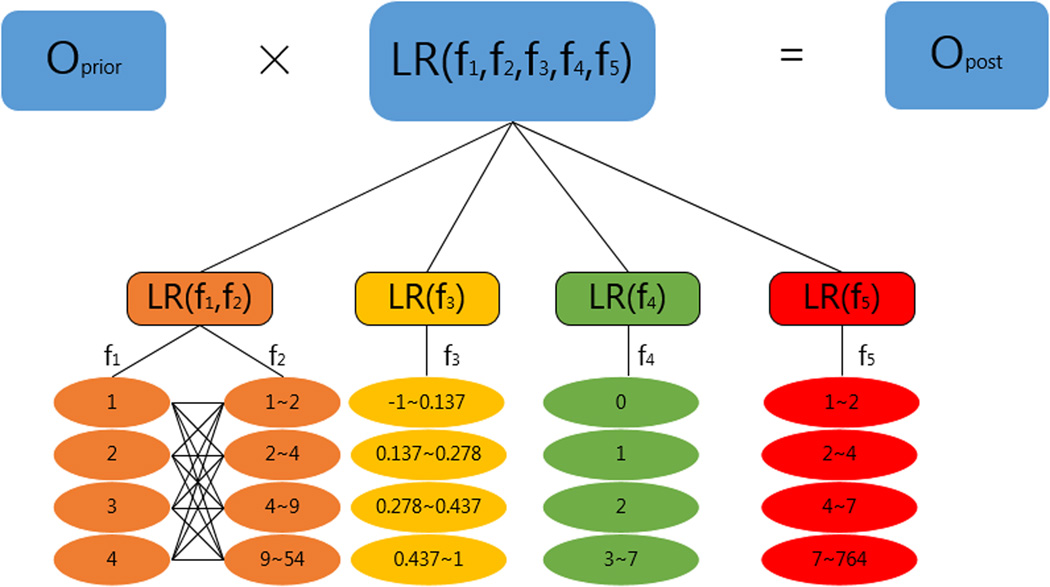
Prediction of protein-protein interactions starts from training the classifier with the GSP and GSN sets. We put all protein pairs which are known to interact or not into associated bins. The range of each bin for each feature is presented in Figure 3. For example, a protein pair in the GSP set with f1=2, f2=5, f3=0.5, f4=2 and f5=8 is assigned into the following bins: f1=2, f2 ∈ (4,9), f3 ∈ (0.437, 0.962), f4=2, and f5 ∈ (7, 764) with each bin indicating a value or a range for the corresponding feature. Then we calculated in each bin the conditional probability of observing fi given y:
| (5-1) |
| (5-2) |
where # represents the number of protein pairs satisfying the specified condition; xi denotes the bin in which fi falls, i = {1,3,4,5}, k={1,0}.
Figure 3.
Illustration of the calculation of the posterior odds and the range of values proposed for each bin in each feature.
Consider for example the bin f5 ∈ (7,764).The likelihood ratio is calculated as follows:
| (6-1) |
| (6-2) |
| (6-3) |
where x5 represents the interval (7,764); p(f5 ∈ x5|y = 1) denotes the ratio of the number of GSP protein pairs falling into this bin over the number of total GSP protein pairs; p(f5 ∈ x5|y = 0) is the ratio of the number of GSN protein pairs falling into this bin over the number of the total GSN protein pairs.
For f3, f4 and f5, we can calculate the likelihood ratio according to Eq. (6). However, since f1 and f2 are correlated given the state of y, we need to make a slight modification to Eq. (6) to calculateas outlined below:
| (7-1) |
| (7-2) |
| (7-3) |
| (7-4) |
| (7-5) |
where p(f2 ∈ x2|f1 ∈ x1, y = 1)represents the ratio of the number of GSP protein pairs falling into both x1 bin and x2 bin to that of GSP protein pairs falling into x1 bin; p(f2 ∈ x2|f1 ∈ x1, y = 0) denotes the ratio of the number of GSN protein pairs falling into both x1 bin and x2 bin to that of GSN protein pairs falling into x1 bin.
The trained BN model was applied to predict interacting protein pairs by computing individual likelihood for each feature, and the LR for the five combined features is as follows:
| (8) |
We then computed Opost according to Eq. (1). If Opost > 1, we considered the protein pair to be interacting.
Results
Calculating predictive strength of each feature
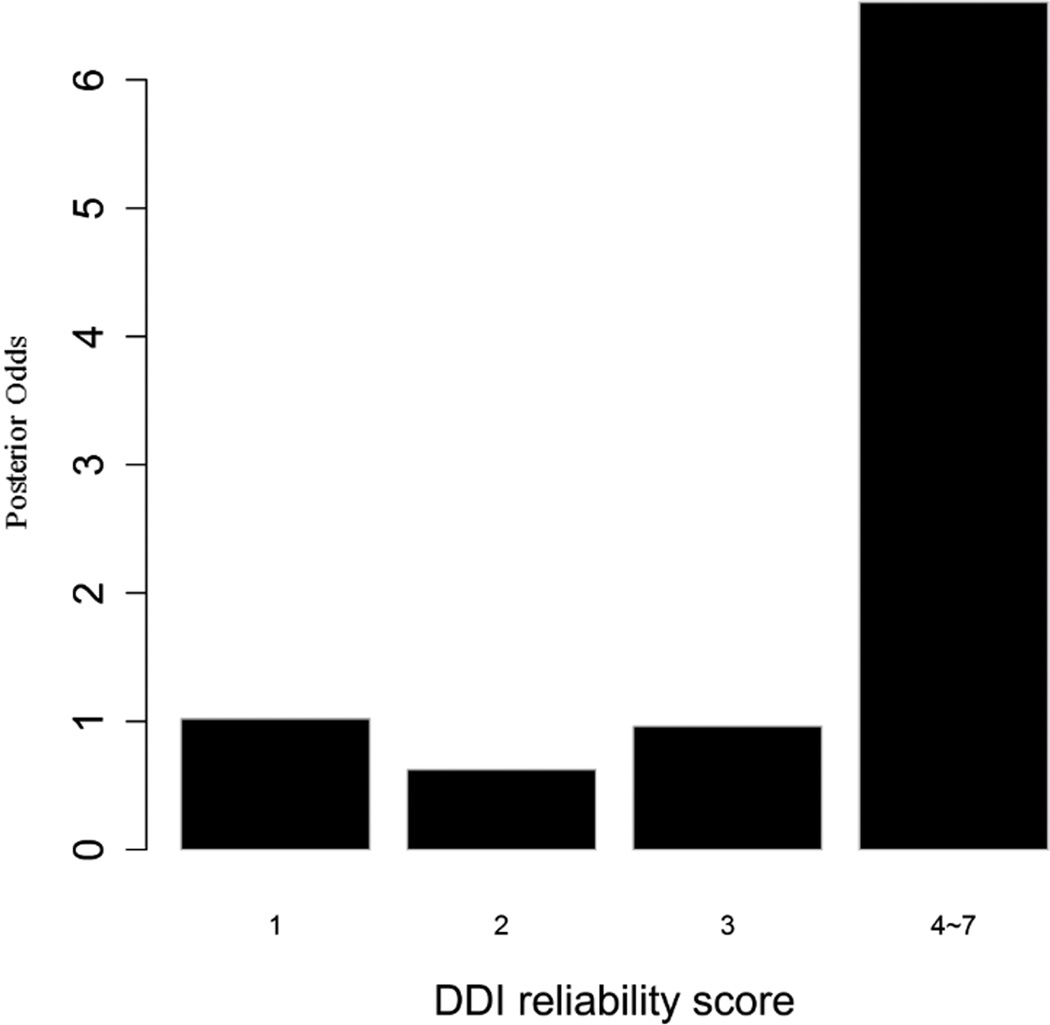
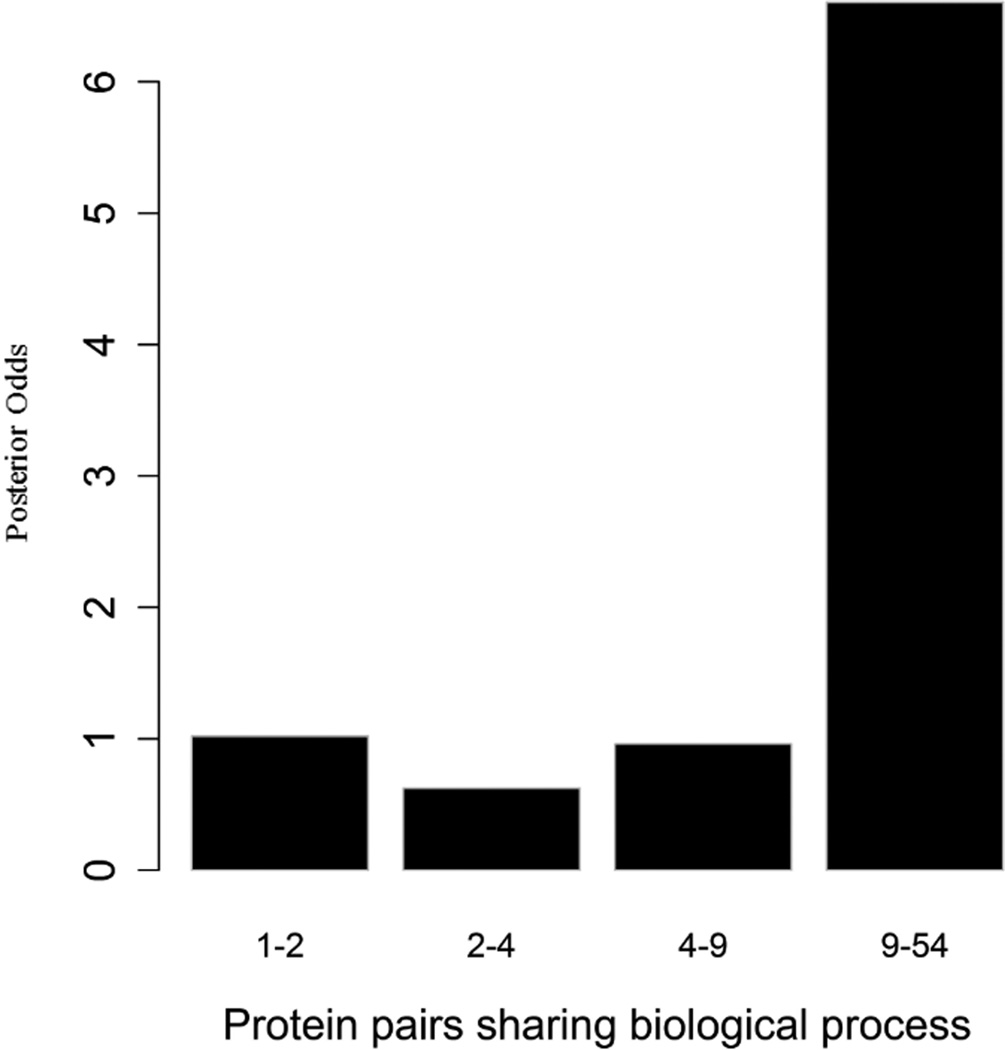
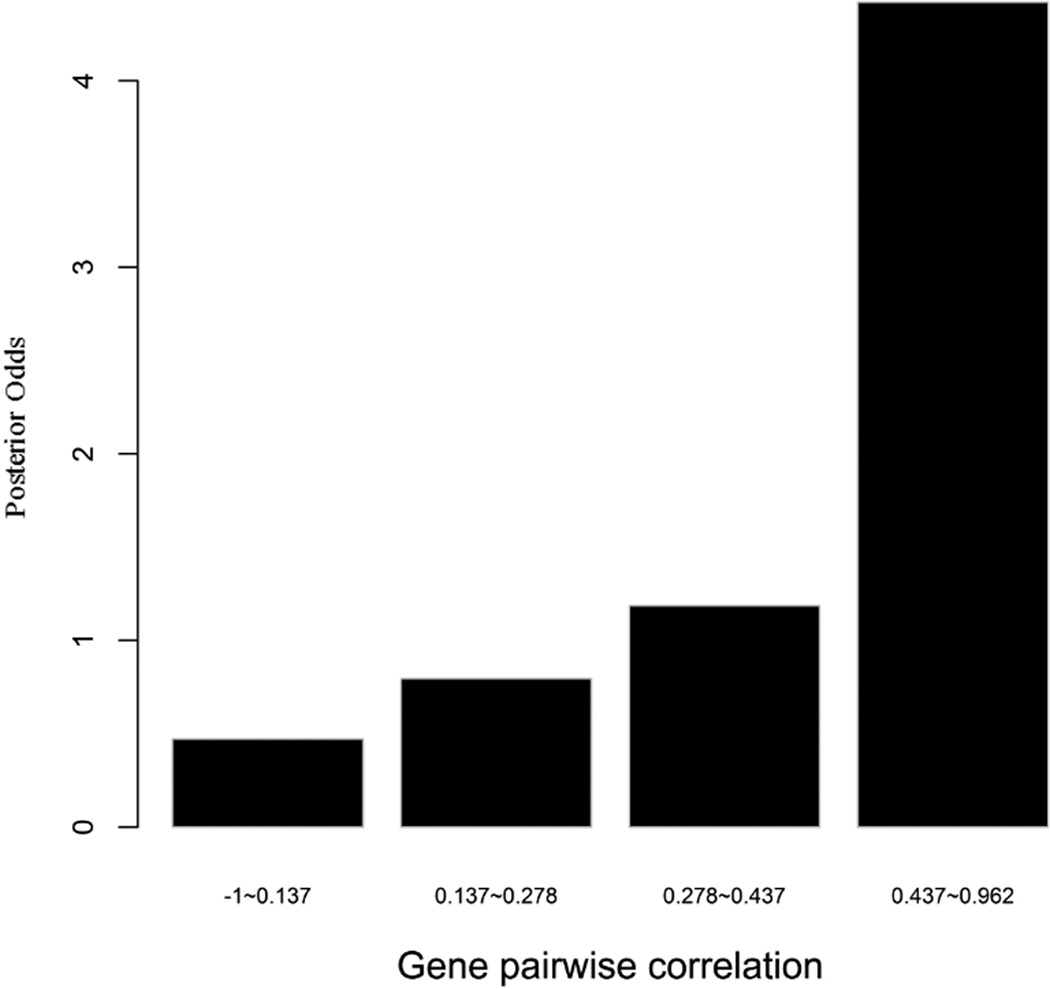
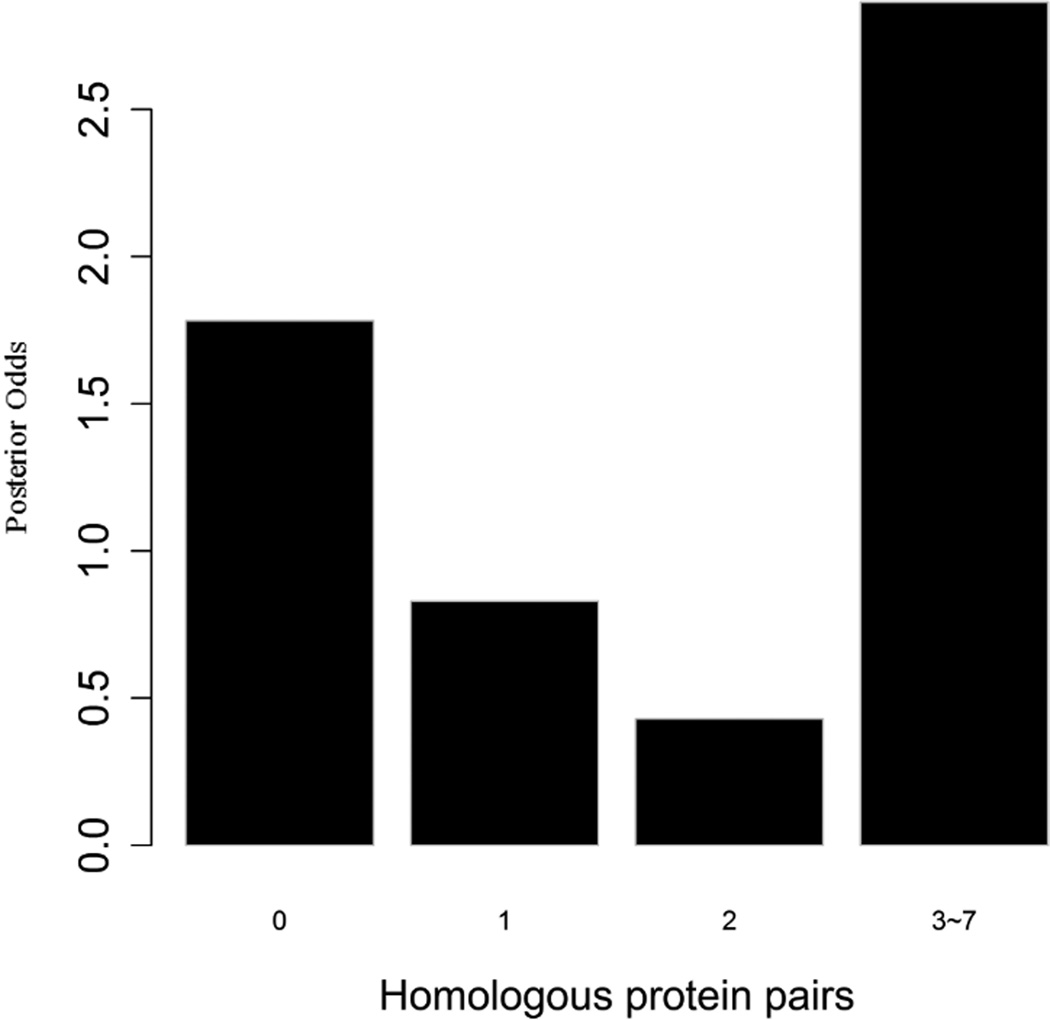
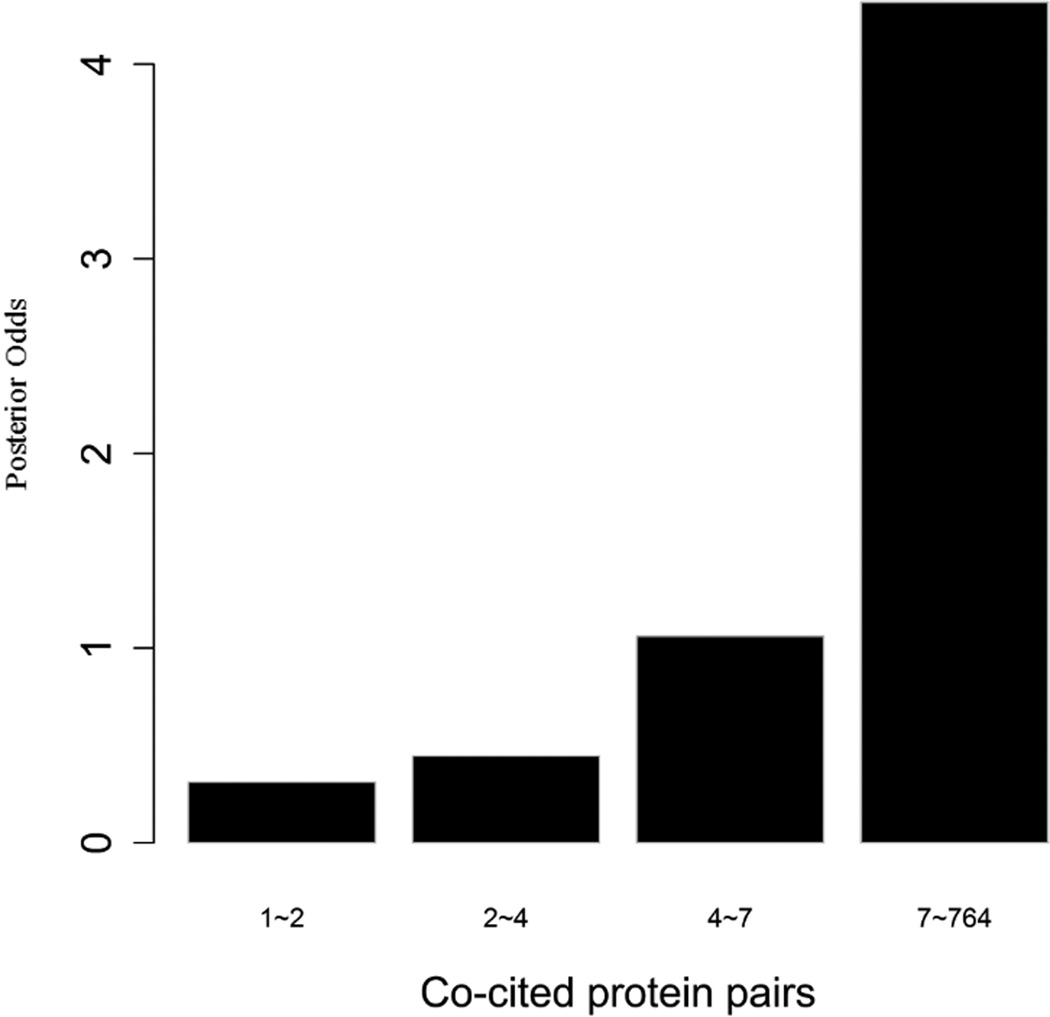
To evaluate the predictive strength of each individual feature in identifying protein pairs, we computed Opost of y=1 using the five features (f1,f2, …, f5) listed in Table 1. This was done for each protein pair in the GSP and GSN sets. Figure 4 shows Opost for the four levels of each feature. Except for homology, nearly all four other features have a weak positive association between the posterior odds and the feature values. For gene co-expression and co-citation, we observe their posterior odds monotonically increasing as the corresponding feature values increase, indicating the potential power of these two features in predicting reliable PPIs.
Figure 4.
Multiple data sources contribute to the BN classifier. Bar plots of posterior odds for domain-domain interactions (A), Gene Ontology (B), gene co-expression (C), homology (D), and literature (E).
Performance evaluation
We trained BN, NB, FBN and SVM classifiers using the above five features and the GSP and GSN sets described in Section II. For BN classifier, all features (f1, f2, …, f5) are assumed conditionally independent given the class label (y). Eq. (4) can be rewritten as follows:
| (9) |
All the other configurations are the same as our proposed BN classifier. In contrast, FBN classifier assumes all features are conditionally dependent given class label. As a result, the likelihood ratio can be rewritten as:
| (10) |
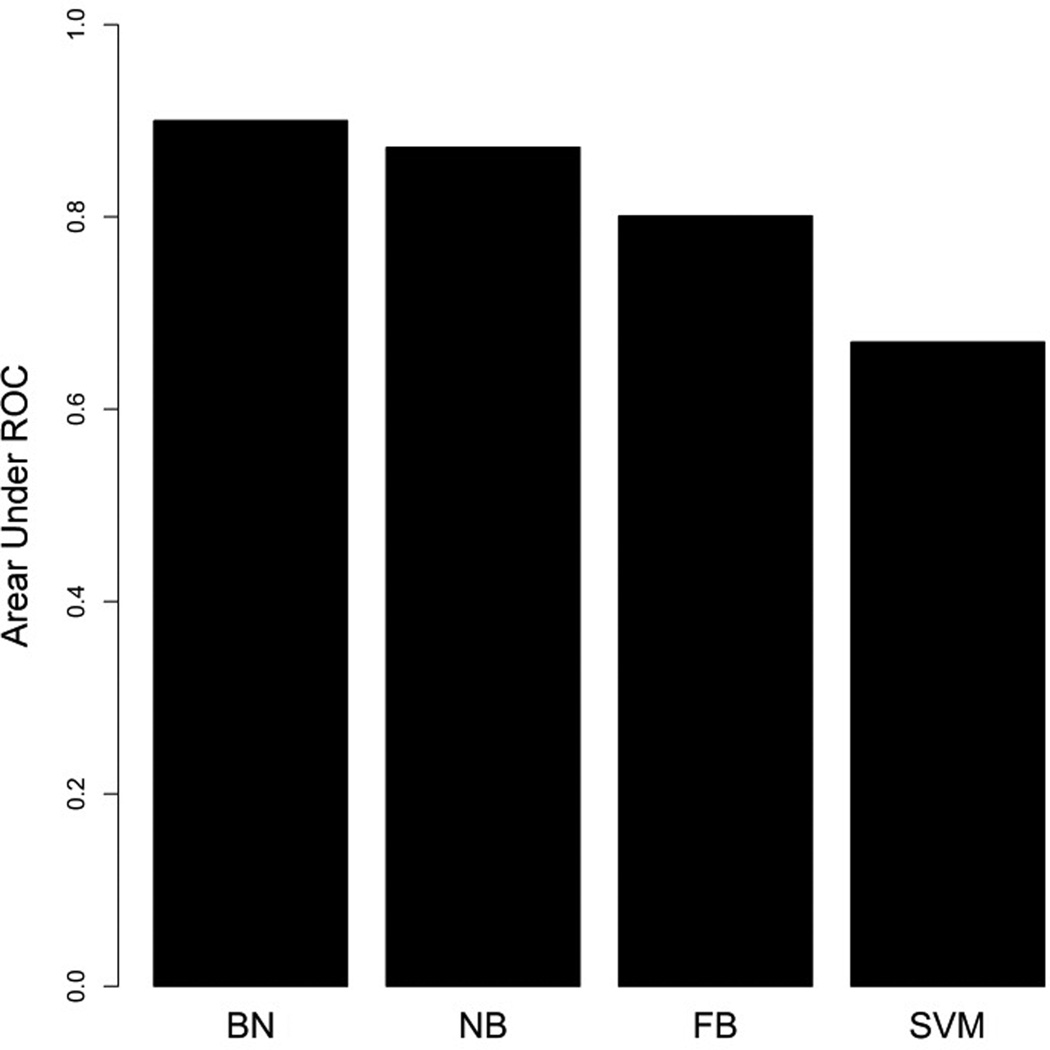
We applied the strategy introduced by Su and Zhang to build the FBN classifier.41 For the SVM classifier, we used Weka, an open source machine learning software (http://www.cs.waikato.ac.nz/ml/weka/), with a Gaussian kernel while other configurations were set as default. We then compared the predictive performance of the proposed BN classifier to that of NB, FBN and SVM classifiers based on a 10-fold cross-validation. Briefly speaking, we split the positive and negative training sets into ten approximately equal sets. Nine of these were used for training and the remaining one was used for testing. True positives (TP) and false positives (FP) were calculated. This process was repeated 10 times (choosing a different test set each time). We then calculated the area under the receiver operating characteristic (AUC) for each model with the proposed BN classifier showing the largest AUC as displayed in Figure 5.
Figure 5.
Comparisons of prediction performance of the BN, NB, FBN and SVM classifiers by 10-fold cross-validation on the training set. The Y-axis represents the area under ROC curve score. AUC for BN=0.9001, NB=0.8723, FBN=0.8010, SVM=0.67
In addition to cross-validation, we also used an independent test set to evaluate the predictive performance of our proposed BN classifier. The independent set was derived from the MINT database, a public PPI database built from results published in peer-reviewed journals. We downloaded 187,456 binary interactions for 8,707 human proteins from (http://mint.bio.uniroma2.it/mint/)27 to evaluate the BN, NB, FBN and SVM classifiers previously built using the training set. After removing the known 187,456 binary interactions from the 8,707 proteins, a random set of 187,456 protein pairs was selected. Figure 6 depicts the receiver operating characteristic (ROC) curves for each classifier. As shown in Figures 5 and 6, the proposed BN classifier provides the best performance. For naïve Bayes classifier, our proposed BN classifier outperforms it since ours can capture the conditional dependence structure among features given the class. For SVM, our proposed classifier can handle missing values without imputation, whereas SVM requires missing values be estimated before using it as an input. For FBN classifier, our proposed classifier significantly reduces the computational complexity and avoids the risk of overfitting caused by the assumption of FBN classifier that all features are conditionally dependent given the class.
Figure 6.
ROC curves of the proposed BN, NB, FB and SVM classifiers based on independent testing set. AUC for the BN=0.9072, NB=0.82025, FBN=0.77001, and SVM=0.687
HCC PPI network
We applied the trained BN classifier to construct an HCC PPI network using 256 candidate protein biomarkers for HCC that have been reported as differentially expressed between HCC cases and healthy controls or patients with liver cirrhosis (adjusted p-value<0.0001) using high-throughput technologies including microarray and mass spectrometry.
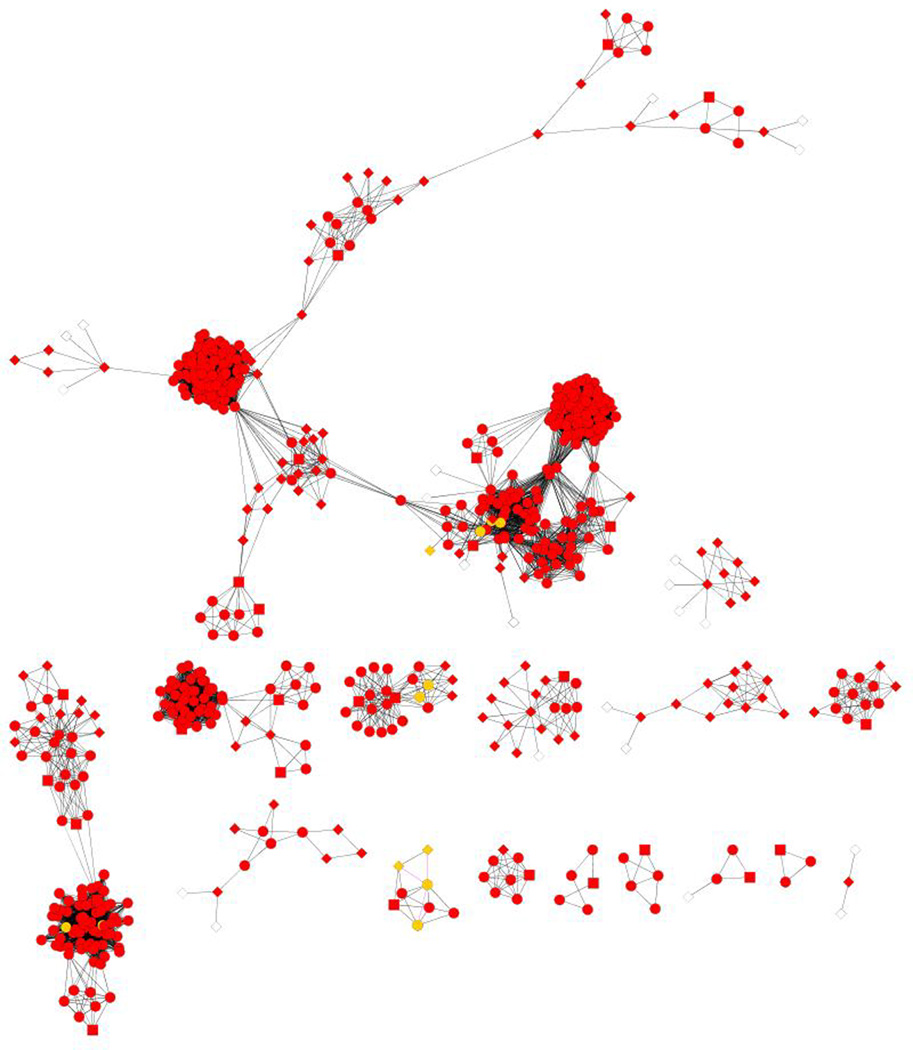
Before we applied the BN classifier to construct the HCC PPI network, we used a Java-based tool developed in-house to collect the interaction information of the 256 biomarkers from protein-protein interaction databases such as BioGrid, HPRD, STRING and KEGG. We obtained 11,513 distinct protein pairs and their corresponding five feature values. Using the trained BN classifier 1,291 protein-protein interactions were predicted as true positives (Opost >1). They were used to construct the HCC PPI network shown in Figure 7A. The nodes represent proteins and the edges correspond to the interactions between two proteins.
Figure 7.
Global and focused views of the predicted HCC PPI network. A: Global view of the HCC PPI network. B: Zoomed view of the predicted interactions generated by the 18 true positive interactions among 23 unique proteins (Opost >200). Known interactions in IntAct are shown in green edge and predicted ones are shown in red. Known interactors in IntAct are shown in light purple and predicted ones are shown in yellow. The network is drawn by Cytoscape.
To identify previously unknown interactions, we mapped to IntAct (http://www.ebi.ac.uk/intact/) 18 predicted interacting pairs between 23 unique proteins with high confidence (Opost >200). In addition to known pathways involved in HCC or liver disease, such as Wnt and Hepatitis C pathways, we found some novel predicted interactions that are not included in the IntAct database (see edges marked in red in Figure 7B). For example, the SOS1 interactors are involved in T-cell receptor signaling pathway and regulate protein complex assembly (GO0043254). PLAK1 and its interactors are related to mitotic spindle checkpoint and cell cycle (GO00278) pathways which are important for HCC progression. Also, we observed interactions between TP53, AR1H2 and PPP2R1A correlated with cell growth (GO0016049). The largest posterior odds (Opost =7329.19) was for CDC20 and PLK1 (red nodes in Figure 7B).
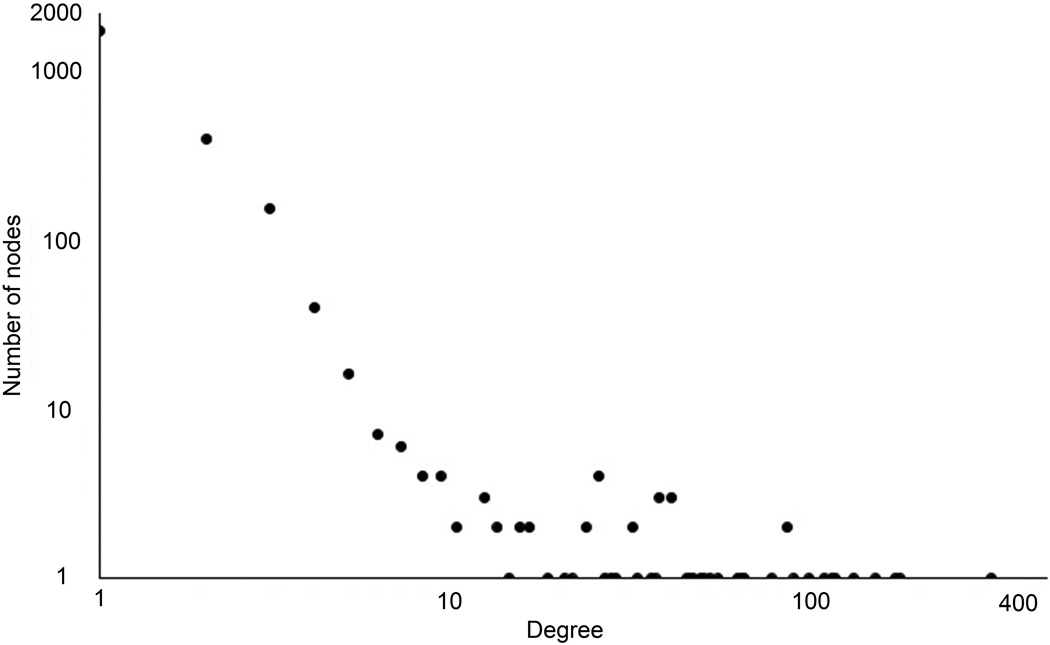
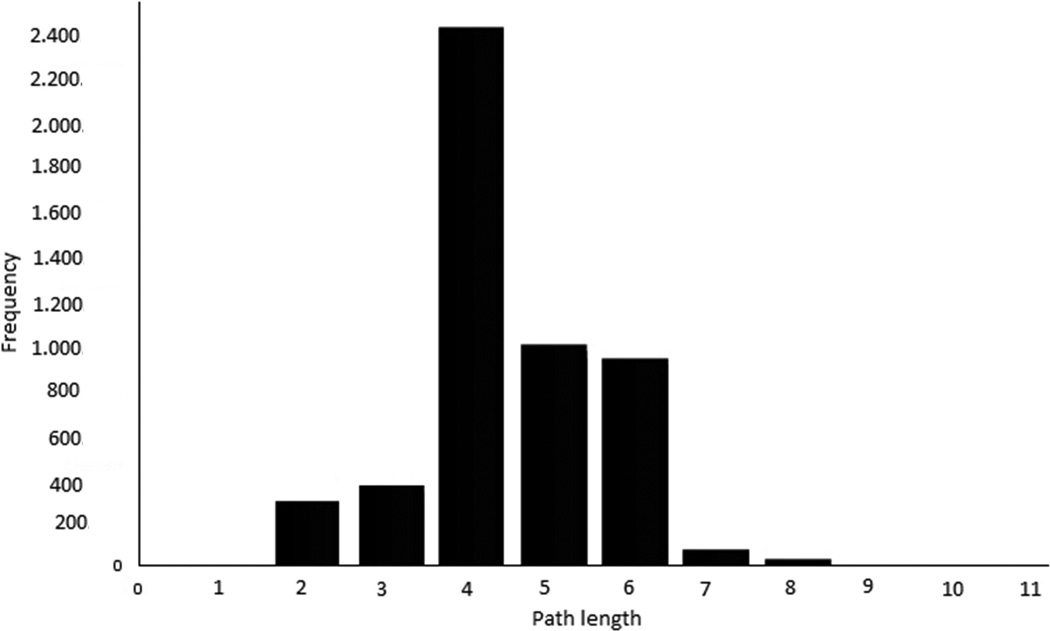
To understand better the inferred HCC PPI network, we analyzed its topological properties such as degree of distribution and the length of the shortest paths. The degree of distribution is the number of connections per node. In the HCC PPI network, the degree of distribution exhibits approximately a power law property (Figure 8A). The length of the shortest paths between pairs of nodes in the HCC network is around 4 (Figure 8B). Both of these indicate that the HCC PPI network satisfies the property of scale-free and small world networks. The topological analysis reveals that the predicted HCC network is in concordance with previously reported cancer biological network characteristics.28
Figure 8.
The topology properties of the identified HCC PPI network. (A), node degree distribution (B), path length
Functional modules
We performed a network module analysis using the GN14 algorithm on the HCC PPI network shown in Figure 7A. To explore the biological function that these modules may imply, we annotated these modules with GO terms using BiNGO.29 The significance of these modules was evaluated using the hypergeometric test and Bonferroni family-wise error rate correction (adjusted p-value<0.005) provided by BiNGO. The GO biological process and cellular component enrichment analysis found 24 functional modules; seven of the top rankings are listed in Tables 2 and 3 along with their enrichment p-values and the number of nodes and edges for each module. Modules 1 and 2 are mainly related to the chemical reactions and pathways resulting in the breakdown of a protein or peptide by hydrolysis, and mediated by APC (anaphase-promoting complex)-dependent proteasomal ubiquitin-dependent protein degradation, and cell cycle (adjusted p-value=1.26E-24). The gene products present in Module 3 are in the mitochondrial inner membrane (adjusted p-value=3.18E-23). Pathways in this module are significantly related to energy metabolism pathways (adjusted p-value=2.3E-06). We queried the OMIM database and found that genes in this module are associated with: 1) abnormality of carbohydrate metabolism/homeostasis (OMIM: 107741, 117550), 2) reduced ability of liver functions and 3) hepatic failure and abnormality of body fluids regulation. Pathways assigned to Modules 4 and 5 are mainly related to angiogenesis and Wnt signaling. HCC is a hypervascular tumor; angiogenic factors such as VEGF can stimulate proliferation and migration of endothelial cells leading to elevated vascular density. Aberrant activation of Wnt signaling plays an important role in hepatocarcinogenesis.30 Cumulating evidence suggests that Wnt signaling is required for angiogenesis.31,32, 33 Module 6 shows that proteins are mainly involved in cholesterol metabolism and sterol homeostasis. Enriched pathways of chylomicron-mediated lipid transport (adjusted p-value=5.29 E -30) and fat digestion and absorption (adjusted p-value=4.89 E -05) in this module could be correlated with the mechanism of cellular control of lipid and lipoprotein metabolism. Thus, associated proteins suggest the role of lipid metabolism in the pathogenesis of HCC. Bile acids are the end products of cholesterol catabolism, they are produced in the liver34 to facilitate hepatobiliary secretion of endogenous metabolites and xenobiotics and intestine absorption of lipophilic nutrients, and to control the metabolism of glucose and lipids in the enterohepatic system.35 Proteins in Module 7 are significantly related to glucagon stimulus, energy derivation by oxidation of organic compounds and bile acid transport, suggesting bile acid signaling regulation of glucose and lipid metabolism. Also, Module 7 indicates that bile acid signaling pathway could be the master of metabolic disorders in liver disease and HCC. Table 3 lists the sub-cellular locations of the functional modules. For example, the top ranked proteins in Module 1 are primarily located at the cytoplasmic and intracellular parts, suggesting changes in proteins expressed in cytoplasmic tumor progression.36 In Model 7, all proteins appear to be associated with protein synthesis-related organelles or complexes. Aberrant protein synthesis has been consistently linked to liver cancer development and progression.37, 38 In summary, functional module analysis yields biologically relevant contexts for identifying the ‘driver’ and ‘passenger’ proteins in cancer development, generating hypothesis for subsequent experimental validation, indicating systematic integration of multiple level -omic data provides insights into the mechanism of cancer.
Table 3.
Top seven highly significant modules with corresponding top five GO cellular compartments
| Module | Nodes/Edges | GO ID | Cellular compartments | Adjusted P-value |
|---|---|---|---|---|
| 1 | 34/33 | GO:0005829 | cytosol | 2.96E-38 |
| GO:0044444 | cytoplasmic part. | 2.44E-24 | ||
| GO:0071944 | cell periphery | 2.52E-16 | ||
| GO:005886 | plasma membrane | 5.40E-16 | ||
| GO:0005737 | intracellular part | 6.09E-15 | ||
| 2 | 140/226 | GO:0005579 | membrane attach complex | 1.52E-18 |
| GO:005576 | extracellular region | 1.10E-12 | ||
| GO:0046930 | pore complex | 7.10E-09 | ||
| GO:0044421 | extracellular region part | 3.53E-08 | ||
| GO:0005615 | extracellular space | 4.02E-06 | ||
| 3 | 103/103 | GO:0005834 | heterotrimeric G-protein kinase complex | 8.09E-23 |
| GO:0031234 | Extrinsic to internal side of plasma membrane | 9.16E-21 | ||
| GO:0019897 | extrinsic to plasma membrane | 1.99E-18 | ||
| GO:0009898 | internal side of plasma membrane | 7.45E-17 | ||
| GO:0019898 | extrinsic to membrane | 1.24E-16 | ||
| 4 | 39/39 | GO:0005829 | cytosol | 1.31E-13 |
| GO:0005945 | 6-phosphofructokinase complex | 8.78E-07 | ||
| GO:0044444 | cytoplasmic part | 3.01E-13 | ||
| GO:0005737 | cytoplasma | 6.24E-03 | ||
| 5 | 39/38 | GO:0005782 | peroxisomal matrix | 3.83E-06 |
| GO:0031907 | microbody lumen | 2.83E-06 | ||
| GO:0042579 | microbody | 8.81E-04 | ||
| GO:0005777 | Peroxisome | 8.81E-04 | ||
| GO:0044438 | microbody part | 1.46E-04 | ||
| 6 | 13/55 | GO:0034358 | plasma lipoprotein particles | 1.69E-16 |
| GO:0032994 | Protein-lipid complex | 2.06E-16 | ||
| GO:0034361 | very-low density lipoprotein particles | 3.42E-15 | ||
| GO:0034385 | triglyceride-rich lipoprotein particles | 7.48e-15 | ||
| GO:0042627 | chylomicron | 2.23E-14 | ||
| 7 | 14/30 | GO:0005789 | endoplasmic reticulum membrane | 2.15E-04 |
| GO:0042175 | nuclear outer membrane-endoplasmic reticulum membrane network | 2.42E-04 | ||
| GO:0044432 | endoplasmic reticulum part | 6.05E-04 | ||
| GO:0005783 | endoplasmic reticulum | 4.82E-03 | ||
| GO:0044444 | cytoplasma part | 2.64E-02 |
Discussion
Integration of protein-protein interaction information from multiple data sets contributes to a better understanding of aberrant pathways and network activities within the cell. However, it is difficult to manually and comprehensively integrate all available information for the following reasons: 1) too many data sources, 2) too many levels of interactions, 3) too many different fields, 4) too many contradictory reports, and 5) too rapidly increasing scientific terms, definitions, experimental methods and methodologies. In this paper, we propose a customized BN classifier to infer protein-protein interactions by integrating heterogeneous data from multiple sources. The proposed BN classifer can capture the relationships between diverse biological features. A simulation result shows that our BN classifier outperforms other classifiers including NB, FBN and SVM. We applied the BN classifier to construct HCC networks by integrating information from biological databases and literature. We then discovered functional modules, ‘hub’ proteins, and relevant interactions between candidate protein biomarkers for HCC. Enrichment analysis was applied to infer the mechanism of HCC based on these functional modules.
Our future work will focus on 1) seeking better approaches to determine the structure of the BN classifier, and 2) extending the proposed BN classifier to predict metabolic pathways and networks by incorporating data from metabolite profiling studies into current framework.
Table 2.
Top seven highly significant modules with corresponding top five GO biological processes
| Module | Nodes/Edges | GO ID | Biological process | Adjusted P-value |
|---|---|---|---|---|
| 1 | 34/33 | GO:0031145 | anaphase-promoting complex-pendent proteasomal | 1.51E-35 |
| GO:0007088 | any process that modulates the frequency, rate or extent of mitosis. | 7.69E-28 | ||
| GO:0010498 | proteasome-mediated protein catabolic process | 3.84E-29 | ||
| GO:0051444 | anaphase promoting complex inhibition | 5.46E-31 | ||
| GO:0005680 | blood vessel morphogenesis | 5.46E-27 | ||
| 2 | 140/226 | GO:0000216 | progression from M phase to G1 phase of the mitotic cell cycle. | 7.08E-21 |
| GO:0000084 | S-phase of mitotic cell cycle | 1.26E-24 | ||
| GO:004578 | down regulation of progression through cell cycle | 2.18E-02 | ||
| GO:0006521 | regulation of amino acid metabolism | 1.99E-37 | ||
| GO:0051437 | activation of ubiquitin ligase activity during mitotic cell cycle | 3.23E-34 | ||
| 3 | 103/103 | GO:0015980 | chemoorganotrophy | 3.18E-23 |
| GO:0006091 | generation of precursor metabolites | 9.32E-27 | ||
| GO:0055114 | oxidation-reduction process | 1.02E-18 | ||
| GO:0042773 | ATP synthesis coupled electron transport | 7.81E-10 | ||
| 4 | 39/39 | GO:0016055 | Wnt receptor signaling pathway | 4.99E-20 |
| GO:0007166 | cell surface receptor signaling pathway | 9.38E-16 | ||
| GO:0032268 | regulation of cellular protein metabolic process | 4.4E-17 | ||
| GO:0031399 | regulation of protein modification process | 3.24E-13 | ||
| GO:0030111 | regulation of Wnt receptor signaling pathway | 1.35E-09 | ||
| 5 | 39/38 | GO:0008284 | positive regulation of cell proliferation | 1.47E-20 |
| GO:0048010 | vascular endothelial growth factor receptor signaling pathway | 3.4E-15 | ||
| GO:0040012 | regulation of locomotion | 1.15E-12 | ||
| GO:0070848 | response to growth factor stimulus | 9.58E-18 | ||
| GO:0048514 | blood vessel morphogenesis | 2.34E-14 | ||
| 6 | 13/55 | GO:0042157 | Lipoprotein metabolic process | 8.6E-25 |
| GO:0055088 | Lipid homeostasis | 2.44E-16 | ||
| GO:0034358 | Plasma lipoprotein particle | 1.69E-16 | ||
| GO:0034368 | Protein-lipid complex remodeling | 7.48E-15 | ||
| GO:0055092 | Sterol homeostasis | 7.02E-15 | ||
| 7 | 14/30 | GO:0033762 | Response to glucagon stimulus | 4.91E-54 |
| GO:0071377 | Cellular response to peptide hormone stimulus | 5.21E-53 | ||
| GO:006112 | Energy derivation by oxidation of organic compounds | 3.12E-39 | ||
| GO:006091 | Generation of precursor metabolites and energy | 4.04E-30 | ||
| GO:0015721 | bile acid and bile salt transport | 4.79E-20 |
Acknowledgments
Funding Sources: This work was supported by NIH grants R01CA143420 and R01GM086746 awarded to HWR.
Footnotes
Conflict of Interest Disclosures: None.
References
- 1.Barabasi AL, Gulbahce N, Loscalzo J. Network medicine: a network-based approach to human disease. Nat Rev Genet. 2011;12:56–68. doi: 10.1038/nrg2918. [DOI] [PMC free article] [PubMed] [Google Scholar]
- 2.Wang J, Zhang Y, Marian C, Ressom HW. Identification of aberrant pathways and network activities from high-throughput data. Brief Bioinform. 2012;4:406–419. doi: 10.1093/bib/bbs001. [DOI] [PMC free article] [PubMed] [Google Scholar]
- 3.Rhodes DR, Tomlins SA, Varambally S, Mahavisno V, Barrette T, Kalyana-Sundaram S, et al. Probabilistic model of the human protein-protein interaction network. Nat Biotechnol. 2005;23:951–959. doi: 10.1038/nbt1103. [DOI] [PubMed] [Google Scholar]
- 4.Vaske CJ, Benz SC, Sanborn JZ, Earl D, Szeto C, Zhu J, et al. Inference of patient-specific pathway activities from multi-dimensional cancer genomics data using PARADIGM. Bioinformatics. 2010;26:i237–i245. doi: 10.1093/bioinformatics/btq182. [DOI] [PMC free article] [PubMed] [Google Scholar]
- 5.Morris MK, Saez-Rodriguez J, Clarke DC, Sorger PK, Lauffenburger DA. Training signaling pathway maps to biochemical data with constrained fuzzy logic: quantitative analysis of liver cell responses to inflammatory stimuli. PLoS Comput Biol. 2011;7:e1001099. doi: 10.1371/journal.pcbi.1001099. [DOI] [PMC free article] [PubMed] [Google Scholar]
- 6.Yang X, Zhou Y, Jin R, Chan C. Reconstruct modular phenotype-specific gene networks by knowledge-driven matrix factorization. Bioinformatics. 2009;25:2236–2243. doi: 10.1093/bioinformatics/btp376. [DOI] [PMC free article] [PubMed] [Google Scholar]
- 7.Barnholtz-Sloan JS, Guan X, Zeigler-Johnson C, Meropol NJ, Rebbeck TR. Decision tree-based modeling of androgen pathway genes and prostate cancer risk. Cancer Epidemiol Biomarkers Prev. 2011;20:1146–1155. doi: 10.1158/1055-9965.EPI-10-0996. [DOI] [PMC free article] [PubMed] [Google Scholar]
- 8.Buchwald F, Richter L, Kramer S. Predicting a small molecule-kinase interaction map: A machine learning approach. J Cheminform. 2011;3:22. doi: 10.1186/1758-2946-3-22. [DOI] [PMC free article] [PubMed] [Google Scholar]
- 9.Wu CC, Asgharzadeh S, Triche TJ, D'Argenio DZ. Prediction of human functional genetic networks from heterogeneous data using RVM-based ensemble learning. Bioinformatics. 2010;26:807–813. doi: 10.1093/bioinformatics/btq044. [DOI] [PMC free article] [PubMed] [Google Scholar]
- 10.Wu G, Feng X, Stein L. A human functional protein interaction network and its application to cancer data analysis. Genome Biol. 2010;11:R53. doi: 10.1186/gb-2010-11-5-r53. [DOI] [PMC free article] [PubMed] [Google Scholar]
- 11.Russel JPaS. Handbook of Brain Theory and Neural Networks. Vol 2003. Cambridge: Cambridge, MA: MIT Press; 2000. [Google Scholar]
- 12.Heckerman D. A tutorial on learning with Bayesian networks. Microsoft Research; 1995. [Google Scholar]
- 13.Wang J, Yuan H, Tadesse MG, Ressom HW. Integration of multiple data sources for identifying functional modules using Bayesian network. Genomic Signal Processing and Statistics,(GENSIPS), 2012 IEEE International Workshop on. IEEE. 2012 [Google Scholar]
- 14.Newman MEJ, Girvan M. Finding and evaluating community structure in networks. Physical Review E. 2004;69:026113. doi: 10.1103/PhysRevE.69.026113. [DOI] [PubMed] [Google Scholar]
- 15.Stein A, Panjkovich A, Aloy P. 3did Update: domain-domain and peptide-mediated interactions of known 3D structure. Nucleic Acids Res. 2009;37:D300–3D04. doi: 10.1093/nar/gkn690. [DOI] [PMC free article] [PubMed] [Google Scholar]
- 16.Finn RD, Tate J, Mistry J, Coggill PC, Sammut SJ, Hotz HR, et al. The Pfam protein families database. Nucleic Acids Res. 2008;36:D281–D288. doi: 10.1093/nar/gkm960. [DOI] [PMC free article] [PubMed] [Google Scholar]
- 17.Bjorkholm P, Sonnhammer EL. Comparative analysis and unification of domain-domain interaction networks. Bioinformatics. 2009;25:3020–3025. doi: 10.1093/bioinformatics/btp522. [DOI] [PubMed] [Google Scholar]
- 18.Consortium GO. The Gene Ontology: enhancements for 2011. Nucleic Acids Res. 2011;40:D559–D564. doi: 10.1093/nar/gkr1028. [DOI] [PMC free article] [PubMed] [Google Scholar]
- 19.Mukhopadhyay A, Ray S, De M. Detecting protein complexes in a PPI network: a gene ontology based multi-objective evolutionary approach. Mol Biosyst. 2012;8:3036–3048. doi: 10.1039/c2mb25302j. [DOI] [PubMed] [Google Scholar]
- 20.Von C, Krause R, Snel B, Cornell M, Oliver SG, Fields S, et al. Comparative assessment of large-scale data sets of protein-protein interactions. Nature. 2002;417:399–403. doi: 10.1038/nature750. [DOI] [PubMed] [Google Scholar]
- 21.Qi Y, Klein-Seetharaman J, Bar-Joseph Z. A mixture of feature experts approach for protein-protein interaction prediction. BMC Bioinformatics. 2007;8(Suppl 10):S6. doi: 10.1186/1471-2105-8-S10-S6. [DOI] [PMC free article] [PubMed] [Google Scholar]
- 22.Matthews LR, Vaglio P, Reboul J, Ge H, Davis BP, Garrels J, et al. Identification of potential interaction networks using sequence-based searches for conserved protein-protein interactions or interologs. Genome Res. 2001;11:2120–2126. doi: 10.1101/gr.205301. [DOI] [PMC free article] [PubMed] [Google Scholar]
- 23.Kemmer D, Huang Y, Shah SP, Lim J, Brumm J, Yuen MM, et al. Ulysses - an application for the projection of molecular interactions across species. Genome Biol. 2005;6:R106. doi: 10.1186/gb-2005-6-12-r106. [DOI] [PMC free article] [PubMed] [Google Scholar]
- 24.Croft D, O’Kelly G, Wu G, Haw R, Gillespie M, Matthews L, et al. Reactome: a database of reactions, pathways and biological processes. Nucleic Acids Res. 2011;39:D691–D697. doi: 10.1093/nar/gkq1018. [DOI] [PMC free article] [PubMed] [Google Scholar]
- 25.Franklin S, Vondriska TM. Genomes, proteomes, and the central dogma. Circ Cardiovasc Genet. 2012;4:576. doi: 10.1161/CIRCGENETICS.110.957795. [DOI] [PMC free article] [PubMed] [Google Scholar]
- 26.Browne F, Wang H, Zheng H, Azuaje F. A knowledge-driven probabilistic framework for the prediction of protein-protein interaction networks. Comput Biol Med. 2012;40:306–317. doi: 10.1016/j.compbiomed.2010.01.002. [DOI] [PubMed] [Google Scholar]
- 27.Ceol A, Aryamontri AC, Licata L, Peluso D, Briganti L, Perfetto L, et al. MINT, the molecular interaction database: 2009 update. Nucleic Acids Res. 2010;38:D532–D539. doi: 10.1093/nar/gkp983. [DOI] [PMC free article] [PubMed] [Google Scholar]
- 28.Wang E, Lenferink A, O'Connor-McCourt M. Cancer systems biology: exploring cancer-associated genes on cellular networks. Cell Mol Life Sci. 2007;64:1752–1762. doi: 10.1007/s00018-007-7054-6. [DOI] [PMC free article] [PubMed] [Google Scholar]
- 29.Maere S, Heymans K, Kuiper M. BiNGO: a Cytoscape plugin to assess overrepresentation of gene ontology categories in biological networks. Bioinformatics. 2005;21:3448–3449. doi: 10.1093/bioinformatics/bti551. [DOI] [PubMed] [Google Scholar]
- 30.Zerlin M, Julius MA, Kitajewski J. Wnt/Frizzled signaling in angiogenesis. Angiogenesis. 2008;11:63–69. doi: 10.1007/s10456-008-9095-3. [DOI] [PubMed] [Google Scholar]
- 31.Branda M, Wands JR. Signal transduction cascades and hepatitis B and C related hepatocellular carcinoma. Hepatology. 2006;43:891–902. doi: 10.1002/hep.21196. [DOI] [PubMed] [Google Scholar]
- 32.Majumdar A, Curley SA, Wu X, Brown P, Hwang JP, Shetty K, et al. Hepatic stem cells and transforming growth factor beta in hepatocellular carcinoma. Nat Rev Gastroenterol Hepatol. 2012;9:530–538. doi: 10.1038/nrgastro.2012.114. [DOI] [PMC free article] [PubMed] [Google Scholar]
- 33.Whittaker S, Marais R, Zhu AX. The role of signaling pathways in the development and treatment of hepatocellular carcinoma. Oncogene. 2010;29:4989–5005. doi: 10.1038/onc.2010.236. [DOI] [PubMed] [Google Scholar]
- 34.Chiang JY. Bile acid regulation of gene expression: roles of nuclear hormone receptors. Endocr Rev. 2002;23:443–463. doi: 10.1210/er.2000-0035. [DOI] [PubMed] [Google Scholar]
- 35.Nguyen A, Bouscarel B. Bile acids and signal transduction: role in glucose homeostasis. Cell Signal. 2008;20:2180–2197. doi: 10.1016/j.cellsig.2008.06.014. [DOI] [PubMed] [Google Scholar]
- 36.Hongsrichan N, Rucksaken R, Chamgramol Y, Pinlaor P, Techasen A, Yongvanit P, et al. Annexin A1: A new immunohistological marker of cholangiocarcinoma. World J Gastroenterol. 2013;19:2456–2465. doi: 10.3748/wjg.v19.i16.2456. [DOI] [PMC free article] [PubMed] [Google Scholar]
- 37.Iguchi T, Aishima S, Taketomi A, Nishihara Y, Fujita N, Sanefuji K, et al. Fascin overexpression is involved in carcinogenesis and prognosis of human intrahepatic cholangiocarcinoma: immunohistochemical and molecular analysis. Hum Pathol. 2009;40:174–180. doi: 10.1016/j.humpath.2008.06.029. [DOI] [PubMed] [Google Scholar]
- 38.Mak GWY, Chan MML, Leong VYL, Lee JMF, Yau TO, Ng IOL, et al. Overexpression of a novel activator of PAK4, the CDK5 kinase-associated protein CDK5RAP3, promotes hepatocellular carcinoma metastasis. Cancer Res. 2011;71:2949–2958. doi: 10.1158/0008-5472.CAN-10-4046. [DOI] [PubMed] [Google Scholar]
- 39.Obayashi T, Hayashi S, Shibaoka M, Saeki M, Ohta H, Kinoshita K. COXPRESdb: a database of coexpressed gene networks in mammals. Nucleic Acids Res. 2008;36:D77–D82. doi: 10.1093/nar/gkm840. [DOI] [PMC free article] [PubMed] [Google Scholar]
- 40.Patil A, Nakai K, Nakamura H. HitPredict: a database of quality assessed protein-protein interactions in nine species. Nucleic Acids Res. 2012;39:D744–D749. doi: 10.1093/nar/gkq897. [DOI] [PMC free article] [PubMed] [Google Scholar]
- 41.Su J, Zhang H. Full Bayesian network classifiers. Proceedings of the 23rd international conference on Machine learning. ACM. 2006:897–904. [Google Scholar]


