

Abstract
Exposure to cadmium, a heavy metal present in cigarettes, can be assessed in both urine and blood. Few studies have compared the properties of concurrent measurements of urine cadmium (uCd) and blood cadmium (bCd) in relation to the duration and timing of a known exposure. In this study, bCd and uCd were modeled with data from the National Health and Nutrition Examination Survey (1999–2010). Adjusted geometric mean bCd and uCd were estimated from regression results. Each 1% higher geometric mean uCd was associated with 0.50% (95% CI: 0.47%–0.54%; R2=0.30) higher bCd. In male never-smokers, bCd was 69% (59%–81%) and uCd was 200%(166%–234%) higher at age ≥70y versus 20–29y. Ten pack-years (py) of smoking were associated with 13.7%(10.0%–17.4%) higher bCd and 16.8% (12.6%–21.1%) higher uCd in male smokers. The first year after smoking cessation was associated with 53% (48%–58%) lower bCd and 23%(14%–33%) lower uCd in representative males age 55y with 20py smoking. Smoking in the previous 5 days was associated with 55%(40%–71%) higher bCd and 7%(−3%–18%) higher uCd. Results were similar for women. uCd mainly measures long-term exposure and bCd recent exposure, but with noticeable overlap. Epidemiological studies should base the choice of uCd or bCd on the timing of cadmium exposure relevant to the disease under study.
Keywords: cadmium, heavy metals, National Health and Nutrition Examination Survey, NHANES, tobacco, blood, urine, biomarkers
INTRODUCTION
Cadmium is a toxic and carcinogenic heavy metal dispersed in the environment largely due to human activity (1). Where it contaminates agricultural soil and water, cadmium is taken up by plants. Tobacco, in particular, accumulates cadmium to concentrations much higher than soil concentrations (2); edible crops including soybean, rice, and leafy greens also extract cadmium from soil (3). The general population can therefore be exposed through food and tobacco use. Contamination of drinking water and direct airborne exposure typically contribute only a small fraction of exposure(4, 5).
Bio-monitoring of cadmium exposure in occupational settings first led to the understanding that cadmium accumulates in the kidneys and other tissues, and that urine cadmium reflects this body burden(6–10). In contrast, blood cadmium has been recognized to primarily reflect recent exposure but may also include a contribution from long-term body burden(9–13). Studies in environmentally exposed populations have corroborated these findings(14–18). However, these studies were of modest size, often restricted to a narrow demographic group or convenience sample; few studies have directly compared blood and urine cadmium levels within a large, representative population.
We therefore accessed the US National Health and Nutrition Examination Survey (NHANES) data to assess the properties of cadmium concentrations in blood and urine as measures of cadmium exposure, in a diverse and representative population sample. Cigarettes present a prevalent cadmium exposure and, thus, an opportunity to observe the accumulation and excretion of cadmium during exposure and following cessation of exposure.
MATERIALS AND METHODS
NHANES
Data from the National Health and Nutrition Examination Survey (NHANES) for 1999–2010 were accessed from publicly available sources(19). NHANES is a continuously conducted, complex cross-sectional survey designed to produce a sample representative of the non-institutionalized, civilian US population. NHANES includes a range of questionnaires, a physical exam by medical professionals, and laboratory analyses that have been described in detail (19).
Analytical sample
Between 1999 and 2010, a total of 32,464 adults age 20 years or older participated in NHANES. Urine and blood cadmium were measured for 10,266 and 29,142 of these participants, respectively. For the analyses described in this report, participants 20 years of age or older, with complete urine, blood, examination, and questionnaire data including weight and height for calculation of body mass index (BMI), smoking habits, education, and race/ethnicity were included.
Smoking assessment
Respondents answering affirmatively to “Have you smoked 100 or more cigarettes in your life?” were considered ever-smokers (19). Ever-smokers indicating smoking cigarettes “every day” or “some days” were categorized as current smokers. NHANES questions on tobacco use among ever-smokers included current and former use, ages of initiation of regular smoking, age of smoking cessation, average number of cigarettes smoked, and smoking within the past 5 days. Former smokers were ever-smokers who self-reported currently smoking “not at all.” Years of smoking were calculated for ever-smokers from age of initiation and age of cessation or age at interview, for former and current smokers respectively. Smoking rate was ascertained by NHANES as cigarettes per day and converted to packs by assuming 20 cigarettes per pack. Smoking dose was quantified in pack-years (py) with 1 py defined as smoking one pack per day for one year. Former and never smokers who reporting living with one or more current smokers in the household were classified as exposed to secondhand smoke. Self-reported tobacco use in NHANES has been validated, with less than 2% of adults under-reporting use(20).
Urine and blood cadmium measurement
NHANES blood and urine sample collection and processing have been described (19, 21). Concentrations of cadmium were measured in urine using inductively coupled plasma mass spectrometry (ICP-MS). From 1999–2002, urine cadmium results were manually corrected for molybdenum oxide interference after initial collection; in subsequent years results were corrected at the collection laboratory (19). Measurements below the limit of detection (LOD) were assigned a value of the LOD divided by square root of 2. For 1999 to 2004, the LOD was 0.060 μg/L following molybdenum oxide correction (assigned value 0.042 μg/L); from 2005 to 2010, the LOD was 0.042 μg/L following molybdenum oxide correction (assigned value 0.030 μg/L)(22). A total of 510 (5.6%) of all participants in these analyses were at or below the uCd LOD. Spot urine samples collected from participants were assayed for creatinine as described(19, 23, 24).
Blood cadmium was measured with either electrothermal atomic-absorption spectrophotometry (1999–2002) or ICP-MS techniques (2003–2010) (19). Values at or below LOD (1999–2002: 0.3 μg/L; 2003–2004: 0.14 μg/L; 2005–2010: 0.2 μg/L)(22) were assigned a value of LOD divided by the square root of 2. A total of 1,799 (20%) of participants in these analyses were at or below the bCd LOD.
Statistical Analysis
uCd and bCd were graphically examined to detect potential outliers and to determine whether logarithmic transformation of uCd or bCd was necessary. Three outliers (uCd= 8.2, 10.9, and 36.8 μg/L) were noted; removal of these data from analyses did not materially change results and they were retained in all analyses. Histograms of uCd and bCd showed positive skew, and scatter plots of uCd and bCd with age of smoking demonstrated heteroscedasticity, which were both reduced by logarithmic transformation of uCd and bCd. To directly examine the relationship between bCd and uCd, uCd was corrected for urine creatinine (cr) for each participant, by dividing uCd by creatinine. uCd-cr (μg-Cd / g-cr) was then log-transformed and used as the independent variable in linear regression of log-transformed bCd.
For analysis of the relationships between uCd or bCd and participant characteristics, separate multivariable linear regression models were constructed with either log-transformed bCd or log-transformed uCd as the dependent variable. The models included smoking status (never, former, or current), smoking dose (py; linear and quadratic terms), and years since smoking cessation (among former smokers only; linear and quadratic terms), age (years; linear and quadratic terms), sex, body mass index (BMI, kg/m2; linear), race/ethnicity (non-Hispanic white, Mexican-American, other Hispanic, non-Hispanic black, or other), education (secondary or less; some college/university; college/university degree or more) and NHANES cycle. To adjust urine cadmium measurements for variation in spot samples, urine creatinine (log-transformed) was included as a separate term in multivariable linear regression models of uCd (25, 26).
In separate models for bCd and uCd, an additional term was added categorizing reported smoking within the last 5 days (yes/no). The ratio of geometric means and corresponding 95% CI comparing recent smokers to individuals reporting no smoking the last 5 days was obtained by exponentiating the linear regression coefficients and 95% CI endpoints(27).
In addition, multiplicative interaction terms of age and age squared with sex and smoking status; smoking dose (py; linear and quadratic terms) with sex; and smoking status with sex were included in each regression model. Therefore, this approach was similar to modeling each of uCd and bCd in six separate strata defined by sex and smoking status, except that the coefficient of smoking dose was constrained to be equal for current and former smokers of the same sex, and coefficients of nuisance variables (BMI, race/ethnicity, education, and NHANES cycle) were constrained to be equal across all participants. Statistical significance of regression parameters was assessed with adjusted Wald tests appropriate to complex survey analysis (28). Additional variables examined but not included in the final model were annual household income, secondhand smoke exposure, quadratic terms in BMI, interactions of BMI with sex and smoking status, and cubic terms in age and pack-years of smoking; these additional terms were not significantly different from zero (adjusted Wald test P>0.05 (28)) and did not substantially change other results.
To facilitate comparison of bCd and uCd models, following linear regression, adjusted geometric means at representative values were calculated (also known as margins of responses, predictive margins, or in some circumstances least-square adjusted means(29)). Using the fitted linear regression parameters, adjustment covariates were set to a fixed common value for each participant: urine creatinine of 100 mg/dL, BMI of 27 kg/m2, attained education “some college,” non-Hispanic white ethnicity/race, and NHANES cycle of 2005–2006. When age or smoking variables were adjusted we selected an age of 55 years, 20 pack-years of smoking, and, among former smokers, 20 years since smoking cessation. These were close to sample mean values and avoid selecting unlikely or impossible values (e.g., age 20 years with 30 years since cessation). To calculate geometric means, the predicted log-transformed bCd and uCd were averaged over the subpopulation of interest (e.g., female never-smokers) and back-transformed. Adjusted geometric means were always calculated separately for men and women.
To estimate the fraction of uCd or bCd attributable to long-term accumulation, a counterfactual approach was taken. For example, we assumed the entire difference between adjusted uCd at age 20–29 and age 60–69 was due to accumulation and calculated the attributable fraction as AF = (uCd65 − uCd25)/uCd65 where uCd65 and uCd25 are adjusted geometric mean uCd at age 60–69 and 20–29, respectively. Similarly, to estimate the uCd or bCd attributable to smoking, we assumed the difference in adjusted uCd or bCd between smokers and never-smokers was due to smoking and applied an analgous formula.
All analyses used Stata 12 (StataCorp, College Station, TX) survey data analysis features to account for the sampling structure of NHANES(28), following NCHS analytic guidelines for combining data from multiple cycles of NHANES (19).
RESULTS
After exclusions, the study sample included 9,191 adults age 20 to 85 years with both bCd and uCd measurements available (Table 1), representing approximately 190 million US adults. Never-smokers were more likely female and college-educated than ever-smokers. Current smokers were typically younger, less educated, and had slightly lower BMI than former or never-smokers. Among smokers, average reported years smoked, smoking rate (cigarettes / d) and smoking dose (py) were similar for former and current smokers.
Table 1.
Characteristics of NHANES 1999–2010 sample participants, according to self-reported smoking status at time of interview.
| Never Smokers | Former Smokers | Current Smokers | ||||
|---|---|---|---|---|---|---|
| N= 4,810 |
N= 2,376 |
N= 2,005 |
||||
| N | % | N | % | N | % | |
| Female | 2944 | 61 | 946 | 40 | 858 | 43 |
| Age (y) | ||||||
| 20–29 | 977 | 20 | 175 | 7 | 470 | 23 |
| 30–39 | 931 | 19 | 227 | 10 | 406 | 20 |
| 40–49 | 832 | 17 | 316 | 13 | 475 | 24 |
| 50–59 | 568 | 12 | 390 | 16 | 290 | 14 |
| 60–69 | 678 | 14 | 549 | 23 | 244 | 12 |
| 70+ | 824 | 17 | 719 | 30 | 120 | 6 |
| BMI (kg/m2) | ||||||
| <25 | 1382 | 29 | 581 | 24 | 798 | 40 |
| 25–29.9 | 1676 | 35 | 968 | 41 | 632 | 32 |
| 30+ | 1752 | 36 | 827 | 35 | 575 | 29 |
| Race/ethnicity | ||||||
| NH-white | 2068 | 43 | 1426 | 60 | 1028 | 51 |
| Mexican-American. | 1141 | 24 | 432 | 18 | 328 | 16 |
| Other Hispanic | 372 | 8 | 125 | 5 | 119 | 6 |
| NH-black | 1003 | 21 | 333 | 14 | 454 | 23 |
| Other | 226 | 5 | 60 | 3 | 76 | 4 |
| Education | ||||||
| Secondary or less | 2448 | 51 | 1270 | 53 | 1310 | 65 |
| Some college | 1269 | 26 | 669 | 28 | 520 | 26 |
| College graduate | 1093 | 23 | 437 | 18 | 175 | 9 |
| NHANES Cycle | ||||||
| 1999–2000 | 629 | 13 | 320 | 13 | 265 | 13 |
| 2001–2002 | 728 | 15 | 367 | 15 | 331 | 17 |
| 2003–2004 | 759 | 16 | 398 | 17 | 305 | 15 |
| 2005–2006 | 750 | 16 | 376 | 16 | 305 | 15 |
| 2007–2008 | 910 | 19 | 436 | 18 | 386 | 19 |
| 2009–2010 | 1034 | 21 | 479 | 20 | 413 | 21 |
| Smoking Habits | Mean | SD | Mean | SD | Mean | SD |
| Duration (y) | 21.6 | 14.8 | 25.2 | 15.6 | ||
| Rate (Cig./ d) | 17.0 | 15.3 | 14.3 | 9.2 | ||
| Pack-yrs smoking | 20.5 | 25.9 | 19.3 | 21.8 | ||
| Years since cessation | 17.8 | 14.3 | ||||
| N | % | N | % | N | % | |
| Smoked in prior 5 daysa | ||||||
| No | 4377 | 91 | 2194 | 92 | 91 | 5 |
| Yes | 81 | 2 | 77 | 3 | 1768 | 88 |
Numbers do not sum to total due to missing data.
In the US population represented by NHANES, unadjusted geometric mean (95% CI) bCd was 0.37 μg/L (0.36–0.39 μg/L) and 0.41 μg/L (0.40–0.42 μg/L) in men and women, respectively; uCd was 0.25 μg/L (0.24–0.26 μg/L) in each sex. . Among never-smokers, unadjusted uCd was 0.18 μg/L (0.17–0.19 μg/L) in men and 0.21 μg/L (0.20 – 0.22 μg/L) in women; unadjusted bCd was 0.23 μg/L (0.22 – 0.24 μg/L) in men and 0.31 (0.30 – 0.32 Jg/L) in women.
Results of regression of bCd as a function of uCd (Figure 1 and Table 2) indicated that, in the entire population, each 1% increase in geometric mean uCd was associated with 0.50% (95% CI: 0.47%–0.54%) higher geometric mean bCd; the association was somewhat stronger in men (0.55% (95% CI: 0.57% – 0.58%)) than in women (0.49% (95% CI: 0.44% – 0.54%)). Across all participants and separately within never-, former- and current smokers, variation in uCd explained approximately 30% of the variation in bCd (all participants, R2=0.31; men: R2 = 0.23, 0.41, 0.22 and women R2= 0.31, 0.32, 0.21 among never, former, and current smokers respectively).
Figure 1.

Blood cadmium and urine cadmium (creatinine corrected) by smoking status and sex (circles: men; triangles: women) with weighted linear regression fit (solid: men; dashed: women). A single outlier, a female never-smoker with uCd 282.9 μg/g-cr. was omitted from plot for clarity and to maximize use of space.
Table 2.
Linear regression of blood cadmium with urine cadmium (divided by urine creatinine). Regression coefficients report percentage change in blood cadmium associated with each one percent change in urine cadmium (divided by urine creatinine).
| Both sexes |
Men |
Women |
||||
|---|---|---|---|---|---|---|
| R2 | % bCd / 1% uCd (95% CI) | R2 | % bCd / 1% uCd (95% CI) | R2 | % bCd/1 % uCd 95% CI | |
| Entire population | 0.31 | 0.50 (0.47–0.54) | 0.32 | 0.55 (0.51–0.58)a | 0.30 | 0.49 (0.44–0.54)a |
| Never smokers | 0.32 | 0.39 (0.36–0.43) | 0.23 | 0.36 (0.32–0.39) | 0.31 | 0.39 (0.34–0.45) |
| Former smokers | 0.38 | 0.47 (0.43–0.51) | 0.41 | 0.51 (0.45–0.56) | 0.32 | 0.42 (0.37–0.48) |
| Current smokers | 0.22 | 0.37 (0.32–0.41) | 0.22 | 0.37 (0.31–0.42) | 0.21 | 0.35 (0.30–0.41) |
| P-interaction: <0.0001b | P-interaction: 0.032b | |||||
P for difference in association of bCd with uCd (i.e., slope) between subpopulations defined by sex: 0.035.
P for difference in association of bCd with uCd between subpopulations defined by smoking status, within sexes.
Results from separate regression models of uCd and bCd indicated that these measures were differently associated with age, depending on smoking status (adjusted Wald test of interaction terms, P<0.002 in each sex). Coefficients of the quadratic age terms were significantly less than zero for male never-smokers for both bCd and uCd (P<0.001 for each, adjusted Wald test); thus, bCd and uCd appreciably leveled off after approximately age 55, but less so in former or never-smokers than in current smokers (Table 3 and Figure 2). In general, adjusted geometric mean bCd and uCd were higher in women than in men, in older participants, and within each sex, in smokers than in never-smokers (Table 3 and Figure 2). For example, among male never-smokers, predicted geometric mean bCd and uCd were 69% (95% CI: 59%–81%) and 200% (166%–234%) higher, respectively, in individuals age ≥70 years than in individuals age 20–30 years (Figure 2). Results in women were similar.
Table 3.
Adjusted geometric mean urine cadmium (uCd) and blood cadmium (bCd) concentrations by sex and age in the US population represented by NHANES (1999–2010).
| Men |
Women |
||||||||
|---|---|---|---|---|---|---|---|---|---|
| uCda (μg/L) | (95% CI) | bCda (μg/L) | (95% CI) | uCda (μg/L) | (95% CI) | bCda (μg/L) | (95% CI) | ||
| Never Smokers | |||||||||
| Age (y) | |||||||||
| 20–29 | 0.08 | (0.07–0.09) | 0.19 | (0.18–0.20) | 0.13 | (0.11–0.14) | 0.22 | (0.21–0.24) | |
| 30–39 | 0.11 | (0.10–0.12) | 0.20 | (0.19–0.21) | 0.18 | (0.16–0.20) | 0.25 | (0.24–0.26) | |
| 40–49 | 0.15 | (0.13–0.16) | 0.21 | (0.20–0.22) | 0.24 | (0.22–0.26) | 0.28 | (0.27–0.30) | |
| 50–59 | 0.18 | (0.16–0.20) | 0.23 | (0.22–0.24) | 0.30 | (0.27–0.32) | 0.31 | (0.30–0.33) | |
| 60–69 | 0.21 | (0.19–0.23) | 0.26 | (0.25–0.28) | 0.34 | (0.31–0.37) | 0.34 | (0.33–0.36) | |
| ≥70 | 0.24 | (0.22–0.27) | 0.32 | (0.30–0.35) | 0.37 | (0.33–0.40) | 0.39 | (0.37–0.41) | |
| Former Smokersb | |||||||||
| Age (y) | |||||||||
| 20–29 | 0.09 | (0.07–0.10) | 0.22 | (0.20–0.25) | 0.12 | (0.10–0.14) | 0.25 | (0.22–0.29) | |
| 30–39 | 0.14 | (0.12–0.15) | 0.25 | (0.23–0.27) | 0.20 | (0.18–0.23) | 0.29 | (0.27–0.31) | |
| 40–49 | 0.20 | (0.18–0.23) | 0.28 | (0.26–0.30) | 0.31 | (0.27–0.35) | 0.34 | (0.31–0.37) | |
| 50–59 | 0.30 | (0.26–0.33) | 0.33 | (0.31–0.36) | 0.42 | (0.36–0.47) | 0.40 | (0.36–0.43) | |
| 60–69 | 0.36 | (0.32–0.40) | 0.38 | (0.35–0.40) | 0.51 | (0.45–0.57) | 0.46 | (0.42–0.50) | |
| ≥70 | 0.40 | (0.36–0.45) | 0.45 | (0.42–0.48) | 0.56 | (0.50–0.62) | 0.55 | (0.51–0.60) | |
| Current Smokersc | |||||||||
| Age (y) | |||||||||
| 20–29 | 0.10 | (0.09–0.11) | 0.58 | (0.52–0.64) | 0.17 | (0.15–0.19) | 0.69 | (0.63–0.76) | |
| 30–39 | 0.21 | (0.19–0.23) | 0.72 | (0.66–0.78) | 0.30 | (0.27–0.33) | 0.85 | (0.78–0.91) | |
| 40–49 | 0.36 | (0.32–0.41) | 0.87 | (0.80–0.95) | 0.46 | (0.41–0.51) | 0.99 | (0.90–1.08) | |
| 50–59 | 0.52 | (0.46–0.57) | 0.96 | (0.88–1.05) | 0.66 | (0.58–0.73) | 1.11 | (1.00–1.21) | |
| 60–69 | 0.64 | (0.57–0.70) | 1.00 | (0.91–1.09) | 0.84 | (0.75–0.93) | 1.20 | (1.08–1.33) | |
| ≥70 | 0.65 | (0.55–0.75) | 0.94 | (0.78–1.11) | 0.91 | (0.81–1.02) | 1.17 | (0.94–1.39) | |
Predicted values are adjusted to BMI 27 kg/m2, some college education, non-Hispanic white ethnicity, NHANES cycle 2005–2006, and urine creatinine 100 mg/dL (urine cadmium only).
Smoking dose (py) and time since cessation adjusted to the mean for each age group.
Smoking dose (py) adjusted to the mean for each age group.
Figure 2.
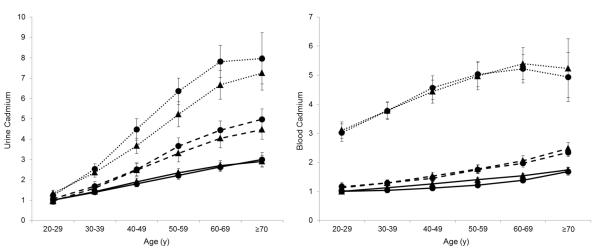
Predicted representative geometric mean urine cadmium (left) and blood cadmium (right), normalized to never-smokers age 20–29 for each sex, within age groups in men (circles) and women (triangles) and smoking status as of NHANES interview date (solid lines: never smokers; dashed lines: former smokers; dotted lines: current smokers). Displayed means illustrate predictions for individuals with BMI 27 kg/m2, some college education, non-Hispanic white ethnicity, and urine creatinine 100 mg/dL (urine cadmium only). Age, smoking duration, rate, and time since cessation are set to the mean for each age and smoking group. Error bars represent 95% confidence intervals.
Figure 3 illustrates the relationships of uCd and bCd with smoking dose for former and current smokers by sex, adjusted to age 55 y. By assumption in our regression model, within each sex, the association of smoking dose with log transformed bCd or uCd was the same for current and former smokers. Among both former and current smokers, higher smoking dose was associated with elevated mean uCd and bCd (Table 4 and Figure 3). The first 10 pack-years (py) of smoking was associated with 13.7% (10.0%–17.4%) higher bCd and 16.8% (12.6%–21.1%) higher uCd in men. The relationship between smoking dose and uCd or bCd did not differ significantly between sexes (uCd: P=0.26; bCd: P=0.90 for interaction terms, adjusted Wald test); nonetheless, adjusted geometric mean bCd and uCd concentrations were higher in female than male smokers (Figures 2 and 3). Although terms in the regression model quadratic in smoking dose were significantly different than zero (P<0.001 in each bCd and uCd, adjusted Wald test), little appreciable deflection was observed in geometric mean cadmium concentrations (Figure 3).
Figure 3.

Predicted representative geometric mean urine and blood cadmium among current (dotted lines) and former (dashed lines) smokers, by sex (men: circles, women: triangles). Values are normalized to never-smokers (smoking dose plots) or current smokers (cessation plots) for each sex. uCd and bCd adjusted to BMI of 27 kg/m2, non-Hispanic white participants, age 55 years, some college education; and urine creatinine 100 mg/dl (uCd only). Smoking dose was fixed at 20 py in plot of cessation time. Solid horizontal lines show mean values in never smokers (women: upper lines, men: lower lines). Error bars represent 95% confidence intervals.
Table 4.
Adjusted geometric mean urine cadmium (uCd) and blood cadmium (bCd) concentrations by sex, smoking status, dose, and time since cessation in the US population represented by NHANES (1999–2010).
| Men |
Women |
|||||||
|---|---|---|---|---|---|---|---|---|
| uCda (μg/L) | (95% CI) | bCda (μg/L) | (95% CI) | uCda (μg/L) | (95% CI) | bCda (μg/L) | (95% CI) | |
| Never Smokers | 0.18 | (0.17–0.20) | 0.24 | (0.22–0.25) | 0.30 | (0.27–0.33) | 0.31 | (0.30–0.33) |
| Former Smokers | ||||||||
| Smoking dose (py)b | ||||||||
| 0 | 0.22 | (0.19–0.25) | 0.26 | (0.24–0.28) | 0.36 | (0.30–0.41) | 0.34 | (0.31–0.37) |
| 5 | 0.24 | (0.21–0.26) | 0.28 | (0.26–0.30) | 0.38 | (0.33–0.43) | 0.36 | (0.34–0.39) |
| 10 | 0.25 | (0.23–0.28) | 0.30 | (0.28–0.31) | 0.41 | (0.35–0.46) | 0.39 | (0.36–0.41) |
| 15 | 0.27 | (0.24–0.30) | 0.31 | (0.29–0.33) | 0.43 | (0.38–0.48) | 0.41 | (0.38–0.44) |
| 20 | 0.29 | (0.26–0.32) | 0.33 | (0.31–0.35) | 0.46 | (0.40–0.51) | 0.43 | (0.40–0.46) |
| 25 | 0.31 | (0.28–0.34) | 0.35 | (0.32–0.37) | 0.48 | (0.42–0.54) | 0.45 | (0.41–0.49) |
| 30 | 0.33 | (0.29–0.36) | 0.37 | (0.34–0.39) | 0.50 | (0.44–0.56) | 0.47 | (0.43–0.52) |
| 35 | 0.35 | (0.31–0.38) | 0.38 | (0.35–0.41) | 0.53 | (0.46–0.59) | 0.49 | (0.44–0.54) |
| 40 | 0.36 | (0.32–0.40) | 0.40 | (0.36–0.43) | 0.55 | (0.48–0.61) | 0.51 | (0.46–0.57) |
| Years since smoking cessationc | ||||||||
| 0 | 0.36 | (0.31–0.40) | 0.41 | (0.36–0.46) | 0.53 | (0.45–0.61) | 0.50 | (0.44–0.55) |
| 1 | 0.35 | (0.30–0.39) | 0.40 | (0.36–0.45) | 0.52 | (0.45–0.60) | 0.49 | (0.44–0.54) |
| 2 | 0.34 | (0.30–0.39) | 0.39 | (0.35–0.43) | 0.52 | (0.44–0.59) | 0.48 | (0.43–0.53) |
| 5 | 0.33 | (0.29–0.36) | 0.37 | (0.34–0.40) | 0.50 | (0.43–0.56) | 0.46 | (0.42–0.50) |
| 10 | 0.30 | (0.27–0.34) | 0.34 | (0.32–0.36) | 0.47 | (0.41–0.52) | 0.44 | (0.40–0.47) |
| 20 | 0.27 | (0.24–0.30) | 0.30 | (0.28–0.32) | 0.42 | (0.37–0.47) | 0.40 | (0.36–0.44) |
| 30 | 0.25 | (0.22–0.28) | 0.28 | (0.26–0.30) | 0.40 | (0.34–0.45) | 0.38 | (0.34–0.42) |
| Current Smokers | ||||||||
| Smoking dose (py) | ||||||||
| 0 | 0.34 | (0.30–0.39) | 0.68 | (0.60–0.76) | 0.49 | (0.42–0.56) | 0.83 | (0.73–0.92) |
| 5 | 0.37 | (0.33–0.42) | 0.72 | (0.65–0.80) | 0.52 | (0.45–0.60) | 0.89 | (0.79–0.98) |
| 10 | 0.40 | (0.35–0.45) | 0.77 | (0.70–0.84) | 0.56 | (0.49–0.63) | 0.94 | (0.85–1.03) |
| 15 | 0.43 | (0.38–0.48) | 0.82 | (0.75–0.89) | 0.59 | (0.52–0.67) | 1.00 | (0.91–1.09) |
| 20 | 0.46 | (0.41–0.51) | 0.86 | (0.79–0.93) | 0.63 | (0.56–0.70) | 1.05 | (0.96–1.14) |
| 25 | 0.49 | (0.44–0.54) | 0.91 | (0.84–0.98) | 0.66 | (0.59–0.74) | 1.10 | (1.00–1.20) |
| 30 | 0.52 | (0.47–0.57) | 0.95 | (0.88–1.03) | 0.69 | (0.62–0.77) | 1.15 | (1.05–1.26) |
| 35 | 0.55 | (0.49–0.60) | 0.99 | (0.91–1.07) | 0.72 | (0.64–0.80) | 1.20 | (1.09–1.31) |
| 40 | 0.58 | (0.52–0.63) | 1.03 | (0.95–1.12) | 0.75 | (0.67–0.84) | 1.25 | (1.13–1.37) |
Predicted values are adjusted to age 55 y, BMI 27 kg/m2, some college education, non-Hispanic white ethnicity, NHANES cycle 2005–2006, and urine creatinine 100 mg/dL (urine cadmium only).
Means are also adjusted to 20 years since smoking cessation.
Means are also adjusted to a smoking dose of 20 py.
Both uCd and bCd were lower in former smokers than current smokers with the same smoking dose (Table 4 and Figure 3). Among representative male smokers age 55 y with a smoking dose of 20 py, adjusted geometric mean bCd was 53% (48% – 58%) lower and uCd 23% (14%–33%) lower in former smokers than in current smokers, less than one year after cessation (Figure 3). In comparable male smokers who quit twenty years prior to NHANES participation, predicted geometric mean bCd was 65% lower and uCd was 45% lower than in comparable current smokers (Figure 3). However, in this representative group, adjusted geometric mean uCd remained approximately 50% higher, and bCd 25% higher, than in comparable never-smokers (Table 4). Similar results were observed for women.
Report of smoking within the 5 days prior to NHANES interview was associated with a 55% higher (95% CI: 40–71%) geometric mean bCd. In contrast, recent smoking was not associated with elevated uCd (ratio of geometric means (95% CI): 1.07 (0.97–1.18)).
DISCUSSION
In this study we were able to compare blood and urine cadmium concentrations measured in the same individuals to demonstrate that each matrix uniquely described cadmium exposure. These analyses took advantage of the strong relation between smoking and cadmium, and data from the US NHANES. Prior studies have generally been limited to occupational bio-monitoring and smaller studies of convenience samples from non-occupationally exposed populations. Thus, they have had limited ability to examine a wide range of exposure strength and recency.
Nonetheless, autopsy studies have demonstrated the accumulation of cadmium in the kidney, and other organs,over decades(30). Together with occupational biomonitoring studies that show increasing uCd associated with duration of exposure (14), a general understanding that uCd reflects long-term exposure over decades was developed(13, 31). In contrast, bCd tended to reflect more recent exposure(13, 31). Thus we were motivated to examine the relationship between bCd and uCd, differences in uCd and bCd associated with differences in age, and the relationship between bCd and uCd and the established cadmium exposure source tobacco in a large, well-described, representative population of adults..
Direct comparison of bCd and uCd confirmed that these measures are well-correlated, but that overall, bCd explained about 30% of the variation in uCd among all participants. This is similar to reports from other non-occupationally exposed population samples(15, 16), but a somewhat weaker correlation than in occupationally exposed workers(6). Thus if for chronic diseases with long latency, we believe uCd is a more appropriate biomarker of exposure, the use of bCd would likely attenuate risk estimates. For example, given our result that R2 ~0.3, a relative risk that would have been 2 had exposure been assessed with uCd would be observed to be ~1.2 (32). Similarly, dividing participants into sex-specific ordinal categories based on bCd would result in substantial misclassification if uCd is taken to be the “gold standard” for assessment of cadmium dose. These results apply to men and women, age 20–75; in other groups, especially children, bCd and uCd may be differently related or have a different relationship to exposure(33).
We hypothesized that misclassification between bCd and uCd may be higher in former smokers, because we anticipated that, following smoking cessation, uCd but not bCd would remain elevated. Surprisingly, correlation between uCd and bCd was strongest in former smokers, and weakest in current smokers, driven mainly by differences among men. Apparently, current smoking broadens the distribution of bCd much more than uCd, so that the overall correlation is attenuated. Removing participants with bCd below the limit of detection did not change the observed patterns.
To investigate further we explored the relationships between uCd, bCd, age, and smoking in detail. We noted that women had higher uCd and bCd than men of the same age and taking into account smoking history. This result is consistent with previous observations from diverse populations including the NHANES(14, 16, 23, 27, 34–36). Previous studies suggest that cadmium exposure through diet does not increase substantially with age during adulthood(37, 38). Thus the association of bCd with age among never-smokers in particular suggests that bCd, like uCd, partially reflects accumulated or long-term exposure. Among never-smokers, we can roughly estimate the proportion of uCd and bCd that could be ascribed to long-term accumulation. For example, among never-smokers, in women age 60–69 y uCd was 2.7-fold and bCd 1.6-fold values in women age 20–29 y. Therefore, if the excess uCd and bCd in older women is entirely attributed to accumulation with age, approximately 63% of uCd and 35% of bCd measured at age 60–69 y could be interpreted as representing past exposure.
Smoking was associated with higher uCd and bCd, consistent with previously published reports(23, 39). Regression coefficients showed that 10 py of smoking was associated with an ~15% higher geometric mean bCd and uCd. This relationship was approximately fixed with increasing smoking dose, suggesting no “saturation” of cadmium in blood or urine with increased exposure at these levels.
Our results of smoking cessation suggest that changes in uCd follow a much slower time-course than changes in bCd, and that uCd remains a measure of total cigarette dose, and therefore total cadmium dose, for decades. However, both uCd and bCd appear to substantially decline within a year of cessation: bCd declined by about 70% of the range between current and never smokers, in both sexes; uCd declined by about 25% and 40%, in women and men respectively (Figure 3). Subsequent years were associated with further declines in both bCd and uCd, but our results indicate that neither returns to the level observed in comparable never-smokers. For example, 20 years after smoking cessation, following a smoking dose of 20 py, bCd and uCd in 55 year old men were 28% and 47% higher than in never-smokers. Thus, from a counterfactual perspective, in this example roughly 22% of bCd (i.e., 0.28/1.28) and 32% of uCd in former smokers are possibly attributable to smoking exposure that ended 20 years earlier.
To examine short-term changes in uCd and bCd due to smoking, we examined the influence of reported smoking in the five days prior to NHANES interview. Recent smoking was associated with a ~60% higher geometric mean bCd, in stark contrast to uCd, regardless of overall smoking status. Thus the decline in bCd observed within a year of smoking cessation (Figure 3) likely occurs within days, while uCd is a much less sensitive measure of recent exposure.
Our results demonstrating that an appreciable portion of bCd is associated with long-ago exposure stands in contrast to typical interpretation of bCd as a marker of recent exposure, as previously noted. In fact, however, a few studies have noted sustained elevation of bCd in industrially exposed workers(10, 11, 40). We hypothesize that cadmium is released from tissues. Liver is well-known to accumulate cadmium; lower levels of cadmium in muscle, making up a larger fraction of total body mass, may also contribute(14, 30, 41, 42).
Limitations to our analysis and interpretation include the cross-sectional design of NHANES. Our comparisons by age may be influenced by cohort effects to the extent that cadmium exposure has changed over time. Recent evidence shows that cadmium exposure reflected in uCd has decreased over time possibly due to decreased smoking and secondhand smoke exposure (27, 43), which could increase the apparent “long-term” component of uCd and bCd we observed, even though we adjusted for NHANES cycle (i.e., year of interview). Secular trends in diet or smoking habits, such as types of cigarettes smoked(44, 45), may similarly have affected our results. Furthermore, 24-hour urine collection would be used for urine cadmium assessment, but this is impractical; the collection and analysis of single “spot” urines and a single blood sample may have introduced noise into the relationship between uCd and bCd(5). However, only a single sample is typically available in an epidemiological study, so our analysis applies directly to such studies.
In summary, we exploited the prevalent cadmium exposure through cigarette use and available data representative of the US population to examine in detail the relationship between cadmium exposure, blood cadmium, and urine cadmium levels. Our results indicate that the interpretation of blood and urine cadmium in the context of chronic exposure in the general population is largely consistent with studies of small occupational cohorts experiencing very high levels of exposure; blood cadmium is dominated by recent exposure, while urine cadmium reflects a much longer history of exposure. These results should be of value for future population studies of this heavy metal in human health and disease.
Acknowledgements
Investigators gratefully acknowledge the Centers for Disease Control and Prevention and National Center for Health Statistics; and Michael Passarelli and Sabah Quraishi for helpful comments on the manuscript. Supported by NIH/NIEHS R01ES019667.
Abbreviations
- NHANES
(National Health and Nutrition Examination Survey)
- bCd
(blood cadmium concentration)
- uCd
(urine cadmium concentration)
- 95% CI
(95% confidence interval)
- BMI
(body mass index)
- py
(pack-year of cigarette smoking)
- LOD
(limit of detection)
- ICP-MS
(inductively coupled plasma mass spectrometry)
Footnotes
Competing Financial Interests: The authors declare that they have no competing financial interests.
REFERENCES
- 1.Agency for Toxic Substances and Disease Registry (ATSDR) Toxicological Profile for Cadmium. Dept. of Health and Human Services; 2012. http://www.atsdr.cdc.gov/toxprofiles/tp5.pdf. [PubMed] [Google Scholar]
- 2.Pappas RS, Polzin GM, Zhang L, Watson CH, Paschal DC, Ashley DL. Cadmium, lead, and thallium in mainstream tobacco smoke particulate. Food Chem Toxicol. 2006;44(5):714–23. doi: 10.1016/j.fct.2005.10.004. Epub 2005/11/29. [DOI] [PubMed] [Google Scholar]
- 3.Clemens S, Aarts MG, Thomine S, Verbruggen N. Plant science: the key to preventing slow cadmium poisoning. Trends Plant Sci. 2013;18(2):92–9. doi: 10.1016/j.tplants.2012.08.003. Epub 2012/09/18. [DOI] [PubMed] [Google Scholar]
- 4.Vahter M, Berglund M, Slorach S, Friberg L, Saric M, Zheng XQ, et al. Methods for integrated exposure monitoring of lead and cadmium. Environ Res. 1991;56(1):78–89. doi: 10.1016/s0013-9351(05)80111-2. Epub 1991/10/01. [DOI] [PubMed] [Google Scholar]
- 5.Gunier RB, Horn-Ross PL, Canchola AJ, Duffy CN, Reynolds P, Hertz A, et al. Determinants and Within-Person Variability of Urinary Cadmium Concentrations among Women in Northern California. Environ Health Perspect. 2013;121(6):643–9. doi: 10.1289/ehp.1205524. Epub 2013/04/05. [DOI] [PMC free article] [PubMed] [Google Scholar]
- 6.Alessio L, Apostoli P, Forni A, Toffoletto F. Biological monitoring of cadmium exposure--an Italian experience. Scand J Work Environ Health. 1993;19(Suppl 1):27–33. Epub 1993/01/01. [PubMed] [Google Scholar]
- 7.Kawada T, Shinmyo RR, Suzuki S. Changes in urinary cadmium excretion among pigment workers with improvement of the work environment. Ind Health. 1993;31(4):165–70. doi: 10.2486/indhealth.31.165. Epub 1993/01/01. [DOI] [PubMed] [Google Scholar]
- 8.Borjesson J, Bellander T, Jarup L, Elinder CG, Mattsson S. In vivo analysis of cadmium in battery workers versus measurements of blood, urine, and workplace air. Occup Environ Med. 1997;54(6):424–31. doi: 10.1136/oem.54.6.424. Epub 1997/06/01. [DOI] [PMC free article] [PubMed] [Google Scholar]
- 9.Lauwerys R, Roels H, Regniers M, Buchet JP, Bernard A, Goret A. Significance of cadmium concentration in blood and in urine in workers exposed to cadmium. Environ Res. 1979;20(2):375–91. doi: 10.1016/0013-9351(79)90014-8. Epub 1979/12/01. [DOI] [PubMed] [Google Scholar]
- 10.Mason HJ, Williams N, Armitage S, Morgan M, Green S, Perrin B, et al. Follow up of workers previously exposed to silver solder containing cadmium. Occup Environ Med. 1999;56(8):553–8. doi: 10.1136/oem.56.8.553. Epub 1999/09/24. [DOI] [PMC free article] [PubMed] [Google Scholar]
- 11.Jarup L, Persson B, Elinder CG. Blood cadmium as an indicator of dose in a long-term follow-up of workers previously exposed to cadmium. Scand J Work Environ Health. 1997;23(1):31–6. doi: 10.5271/sjweh.175. Epub 1997/02/01. [DOI] [PubMed] [Google Scholar]
- 12.Jarup L, Rogenfelt A, Elinder CG, Nogawa K, Kjellstrom T. Biological half-time of cadmium in the blood of workers after cessation of exposure. Scand J Work Environ Health. 1983;9(4):327–31. doi: 10.5271/sjweh.2404. Epub 1983/08/01. [DOI] [PubMed] [Google Scholar]
- 13.Lauwerys RR, Bernard AM, Roels HA, Buchet JP. Cadmium: exposure markers as predictors of nephrotoxic effects. Clin Chem. 1994;40(7 Pt 2):1391–4. Epub 1994/07/01. [PubMed] [Google Scholar]
- 14.Kjellstrom T. Exposure and accumulation of cadmium in populations from Japan, the United States, and Sweden. Environ Health Perspect. 1979;28:169–97. doi: 10.1289/ehp.28-1637502. Epub 1979/02/01. [DOI] [PMC free article] [PubMed] [Google Scholar]
- 15.Shimbo S, Zhang ZW, Moon CS, Watanabe T, Nakatsuka H, Matsuda-Inoguchi N, et al. Correlation between urine and blood concentrations, and dietary intake of cadmium and lead among women in the general population of Japan. Int Arch Occup Environ Health. 2000;73(3):163–70. doi: 10.1007/s004200050023. Epub 2000/04/29. [DOI] [PubMed] [Google Scholar]
- 16.Olsson IM, Bensryd I, Lundh T, Ottosson H, Skerfving S, Oskarsson A. Cadmium in blood and urine--impact of sex, age, dietary intake, iron status, and former smoking--association of renal effects. Environ Health Perspect. 2002;110(12):1185–90. doi: 10.1289/ehp.021101185. Epub 2002/12/04. [DOI] [PMC free article] [PubMed] [Google Scholar]
- 17.Moon CS, Paik JM, Choi CS, Kim DH, Ikeda M. Lead and cadmium levels in daily foods, blood and urine in children and their mothers in Korea. Int Arch Occup Environ Health. 2003;76(4):282–8. doi: 10.1007/s00420-002-0415-4. Epub 2003/04/11. [DOI] [PubMed] [Google Scholar]
- 18.Moon CS, Zhang ZW, Shimbo S, Watanabe T, Moon DH, Lee CU, et al. Evaluation of urinary cadmium and lead as markers of background exposure of middle-aged women in Korea. Int Arch Occup Environ Health. 1998;71(4):251–6. doi: 10.1007/s004200050277. Epub 1998/06/25. [DOI] [PubMed] [Google Scholar]
- 19.Centers for Disease Control and Prevention (CDC) National Health and Nutrition Examination Survey data, protocols, and analytic guidelines. U.S. Department of Health and Human Services; Hyattsville, MD: 2011. http://www.cdc.gov/nchs/nhanes.htm. [Google Scholar]
- 20.Yeager DS, Krosnick JA. The validity of self-reported nicotine product use in the 2001–2008 National Health and Nutrition Examination Survey. Med Care. 2010;48(12):1128–32. doi: 10.1097/MLR.0b013e3181ef9948. Epub 2010/10/14. [DOI] [PubMed] [Google Scholar]
- 21.Centers for Disease Control and Prevention (CDC) Fourth National Report on Human Exposure to Environmental Chemicals. Centers for Disease Control and Prevention, Dept. of Health and Human Services; 2009. [Google Scholar]
- 22.Centers for Disease Control and Prevention (CDC) Fourth National Report on Human Exposure to Environmental Chemicals: Updated Tables. Centers for Disease Control and Prevention, Dept. of Health and Human Services; 2013. [Google Scholar]
- 23.Paschal DC, Burt V, Caudill SP, Gunter EW, Pirkle JL, Sampson EJ, et al. Exposure of the U.S. population aged 6 years and older to cadmium: 1988–1994. Arch Environ Contam Toxicol. 2000;38(3):377–83. doi: 10.1007/s002449910050. Epub 2000/02/10. [DOI] [PubMed] [Google Scholar]
- 24.Gunter EW, Lewis BG, Koncikowski SM. In: Laboratory Procedures Used for the Third National Health and Nutrition Examination Survey (NHANES III) Services UDoHaH, editor. US Department of Health and Human Services; Atlanta, GA: 1996. VII-H-1-VII-H-21. [Google Scholar]
- 25.Barr DB, Wilder LC, Caudill SP, Gonzalez AJ, Needham LL, Pirkle JL. Urinary creatinine concentrations in the U.S. population: implications for urinary biologic monitoring measurements. Environ Health Perspect. 2005;113(2):192–200. doi: 10.1289/ehp.7337. Epub 2005/02/03. [DOI] [PMC free article] [PubMed] [Google Scholar]
- 26.Suwazono Y, Akesson A, Alfven T, Jarup L, Vahter M. Creatinine versus specific gravity-adjusted urinary cadmium concentrations. Biomarkers. 2005;10(2–3):117–26. doi: 10.1080/13547500500159001. Epub 2005/08/04. [DOI] [PubMed] [Google Scholar]
- 27.Tellez-Plaza M, Navas-Acien A, Caldwell KL, Menke A, Muntner P, Guallar E. Reduction in cadmium exposure in the United States population, 1988–2008: the contribution of declining smoking rates. Environ Health Perspect. 2012;120(2):204–9. doi: 10.1289/ehp.1104020. Epub 2011/11/09. [DOI] [PMC free article] [PubMed] [Google Scholar]
- 28.Heeringa S, West BT, Berglund PA. Applied survey data analysis. Chapman & Hall/CRC; Boca Raton, FL: 2010. p. xix.p. 467. [Google Scholar]
- 29.Williams R. Using the margins command to estimate and interpret adjusted predictions and marginal effects. Stata Journal. 2012;12(2):308–31. [Google Scholar]
- 30.Benedetti JL, Samuel O, Dewailly E, Gingras S, Lefebvre MA. Levels of cadmium in kidney and liver tissues among a Canadian population (province of Quebec) J Toxicol Environ Health A. 1999;56(3):145–63. doi: 10.1080/009841099158123. Epub 1999/02/11. [DOI] [PubMed] [Google Scholar]
- 31.Jarup L, Akesson A. Current status of cadmium as an environmental health problem. Toxicol Appl Pharmacol. 2009;238(3):201–8. doi: 10.1016/j.taap.2009.04.020. Epub 2009/05/05. [DOI] [PubMed] [Google Scholar]
- 32.White E, Armstrong BK, Saracci R. Principles of Exposure Measurement in Epidemiology. 2nd ed Oxford University Press; Oxford, UK: 2008. [Google Scholar]
- 33.Chaumont A, Nickmilder M, Dumont X, Lundh T, Skerfving S, Bernard A. Associations between proteins and heavy metals in urine at low environmental exposures: evidence of reverse causality. Toxicol Lett. 2012;210(3):345–52. doi: 10.1016/j.toxlet.2012.02.005. Epub 2012/02/23. [DOI] [PubMed] [Google Scholar]
- 34.Baecklund M, Pedersen NL, Bjorkman L, Vahter M. Variation in blood concentrations of cadmium and lead in the elderly. Environ Res. 1999;80(3):222–30. doi: 10.1006/enrs.1998.3895. Epub 1999/03/30. [DOI] [PubMed] [Google Scholar]
- 35.Kido T, Nogawa K, Ohmichi M, Honda R, Tsuritani I, Ishizaki M, et al. Significance of urinary cadmium concentration in a Japanese population environmentally exposed to cadmium. Arch Environ Health. 1992;47(3):196–202. doi: 10.1080/00039896.1992.9938349. Epub 1992/05/01. [DOI] [PubMed] [Google Scholar]
- 36.Shaham J, Meltzer A, Ashkenazi R, Ribak J. Biological monitoring of exposure to cadmium, a human carcinogen, as a result of active and passive smoking. J Occup Environ Med. 1996;38(12):1220–8. doi: 10.1097/00043764-199612000-00007. Epub 1996/12/01. [DOI] [PubMed] [Google Scholar]
- 37.Egan SK, Bolger PM, Carrington CD. Update of US FDA's Total Diet Study food list and diets. J Expo Sci Environ Epidemiol. 2007;17(6):573–82. doi: 10.1038/sj.jes.7500554. Epub 2007/04/06. [DOI] [PubMed] [Google Scholar]
- 38.Choudhury H, Harvey T, Thayer WC, Lockwood TF, Stiteler WM, Goodrum PE, et al. Urinary cadmium elimination as a biomarker of exposure for evaluating a cadmium dietary exposure--biokinetics model. J Toxicol Environ Health A. 2001;63(5):321–50. doi: 10.1080/15287390152103643. Epub 2001/07/27. [DOI] [PubMed] [Google Scholar]
- 39.Richter PA, Bishop EE, Wang J, Swahn MH. Tobacco smoke exposure and levels of urinary metals in the U.S. youth and adult population: the National Health and Nutrition Examination Survey (NHANES) 1999–2004. Int J Environ Res Public Health. 2009;6(7):1930–46. doi: 10.3390/ijerph6071930. Epub 2009/09/11. [DOI] [PMC free article] [PubMed] [Google Scholar]
- 40.McDiarmid MA, Freeman CS, Grossman EA, Martonik J. Follow-up of biologic monitoring results in cadmium workers removed from exposure. Am J Ind Med. 1997;32(3):261–7. doi: 10.1002/(sici)1097-0274(199709)32:3<261::aid-ajim12>3.0.co;2-t. Epub 1997/09/01. [DOI] [PubMed] [Google Scholar]
- 41.Baba H, Tsuneyama K, Yazaki M, Nagata K, Minamisaka T, Tsuda T, et al. The liver in itai-itai disease (chronic cadmium poisoning): pathological features and metallothionein expression. Mod Pathol. 2013 doi: 10.1038/modpathol.2013.62. Epub 2013/04/06. [DOI] [PubMed] [Google Scholar]
- 42.Min KS, Ueda H, Kihara T, Tanaka K. Increased hepatic accumulation of ingested Cd is associated with upregulation of several intestinal transporters in mice fed diets deficient in essential metals. Toxicol Sci. 2008;106(1):284–9. doi: 10.1093/toxsci/kfn146. Epub 2008/07/24. [DOI] [PubMed] [Google Scholar]
- 43.Riederer AM, Belova A, George BJ, Anastas PT. Urinary cadmium in the 1999–2008 U.S. National Health and Nutrition Examination Survey (NHANES) Environ Sci Technol. 2013;47(2):1137–47. doi: 10.1021/es303556n. Epub 2012/12/21. [DOI] [PubMed] [Google Scholar]
- 44.Elinder CG, Kjellstrom T, Lind B, Linnman L, Piscator M, Sundstedt K. Cadmium exposure from smoking cigarettes: variations with time and country where purchased. Environ Res. 1983;32(1):220–7. doi: 10.1016/0013-9351(83)90209-8. Epub 1983/10/01. [DOI] [PubMed] [Google Scholar]
- 45.Jones MR, Apelberg BJ, Tellez-Plaza M, Samet JM, Navas-Acien A. Menthol cigarettes, race/ethnicity, and biomarkers of tobacco use in U.S. adults: the 1999–2010 National Health and Nutrition Examination Survey (NHANES) Cancer Epidemiol Biomarkers Prev. 2013;22(2):224–32. doi: 10.1158/1055-9965.EPI-12-0912. Epub 2012/12/20. [DOI] [PMC free article] [PubMed] [Google Scholar]