

SUMMARY
Localization of mRNA is a critical mechanism used by a large fraction of transcripts to restrict its translation to specific cellular regions. Although current high- resolution imaging techniques provide ample information, the analysis methods for localization have either been qualitative or employed quantification in non-randomly selected regions of interest. Here, we describe an analytical method for objective quantification of mRNA localization using a combination of two characteristics of its molecular distribution, polarization and dispersion. The validity of the method is demonstrated using single-molecule FISH images of budding yeast and fibroblasts. Live-cell analysis of endogenous β-actin mRNA in mouse fibroblasts reveals that mRNA polarization has a half- life of ~16 min and is cross-correlated with directed cell migration. This novel approach provides insights into the dynamic regulation of mRNA localization and its physiological roles.
INTRODUCTION
Cells achieve polarity in part by localization of mRNA, which allows protein synthesis to be confined to a subcellular compartment (Meignin and Davis, 2010). In the studies of mRNA localization in somatic cells, visualization has played a crucial role since the first observation almost 30 years ago (Jeffery et al., 1983; Lawrence and Singer, 1986). Although in situ hybridization is still widely considered as the standard tool, a variety of techniques in imaging and labeling have enabled detection of single RNA molecules not only in fixed cells (Femino et al., 1998) but also in live cells in real time (Bertrand et al.,1998).
Although imaging techniques are highly sophisticated, analysis of mRNA localization has been mostly limited by the qualitative interpretation. For instance, transcripts expressed during Drosophila embryogenesis are classified into ~35 localization categories (Lécuyer et al., 2007). A conventional method to quantify RNA localization is based on manual counting of the cells by two independent observers who are blind to the experimental conditions. Although it may eliminate potential bias in data selection and processing, ambiguities still remain due to individual variation. In addition to the need for an objective analysis, the importance of quantitative measurement has been recognized for several reasons. First, localization can be described as a continuous process rather than an “all-or- nothing” occurrence (Zimyanin et al., 2008). Second, a metric for localization could identify distinct populations that may be missed by a binary analysis. Moreover, quantification could be automated to facilitate high-throughput image analysis where differential response of cells could be examined under manifold conditions.
A few quantification methods have been suggested in the literature to analyze subcellular localization of mRNA. In one approach, the most dense and least dense regions of the cell were selected, and the ratio of the highest RNA density to the lowest density was calculated (Lawrence and Singer,1986). Latham et al. (1994) counted a cell as localizing if 80% signal was concentrated in leading lamella area comprising a quarter of the cell area. More recently, Yamagishi et al. (2009) selected regions of interest (ROI), and calculated the ratio of the mRNA concentration at the leading edge and in the perinuclear region. For the transcripts that localize in the vicinity of a certain cellular compartment, the distance between the mRNA and the cellular objects may be used to quantify localization (Jourdren et al., 2010). These varying analysis methods could lead to significantly different conclusions, and demonstrate the need for an objective quantitative analysis of RNA localization.
Here we demonstrate an analytical method applied to three different cell types: budding yeast, chicken embryonic fibroblasts (CEF), and mouse embryonic fibroblasts (MEF). We introduce two measures to characterize mRNA distribution, namely polarization and dispersion. When mRNA distribution is asymmetric in a cell, the centroid of the mRNA should deviate from the centroid of the cell. We define the displacement vector point- ing from the center of the cell to the center of mRNA as the RNA polarization vector (Figure 1A). The polarization index (PI) is determined by dividing the size of the polarization vector by the radius of gyration of the cell (Rgcell)
where , , are the coordinates of the centroid for the RNA, and, , , are those for the cell in a general threedimensional case. The radius of gyration Rgcell is calculated by the root gyration Rg cell is calculated by the root-mean-square distance of all pixels within the cell from the centroid of the cell. The displacement between the two centroids is divided by Rgcell in order to assess the polarization normalized to the size and the elongation of the cell. The second quantity, the dispersion of mRNA, is measured by calculating the second moment μ2 of RNA positions:
where N is the total number of mRNA molecules, xi, yi, zi are the coordinates of the ith mRNA, and , , are the variances of the positions. The second moment is dependent on the shape and size of the cell as well as the RNA distribution. To normalize the effect from the cell morphology, we divide the second moment of mRNA μ2 by the second moment of the hypothetical uniform distribution μ′2. A binary mask image of each cell is generated and μ′2 is calculated as the second moment of each pixel’s coordinates within the mask
where M is the total number of pixels within the mask, and Xi, Yi, Zi are the coordinates of the ith pixel. Then we define the dispersion index (DI) as
Figure 1. Quantification of ASH1 mRNA Distributions in Wild-Type and ΔSHE2 Budding Yeasts.
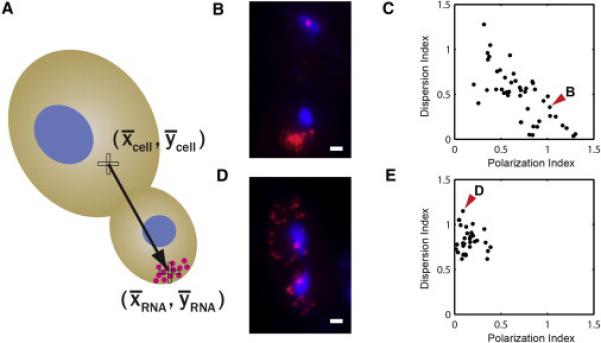
(A) A schematic showing the polarization vector of mRNA distribution pointing from the centroid of the cell to the centroid of the single mRNA positions.
(B) Overlay image of ASH1 mRNA molecules (magenta), and nuclei (blue) in a wild-type cell. ASH1 mRNAs localize to the daughter bud tip. Scale bar represents 1 μm.
(C) Scatter plot of polarization index in x axis and dispersion index in y axis for wild-type cells.
(D) Overlay image of ASH1 mRNA molecules, and nuclei in a ΔSHE2 cell. Deletion of She2p causes a complete delocalization of ASH1 transcripts. Scale bar represents 1 μm.
(E) Scatter plot of polarization index versus dispersion index for ΔSHE2 cells. The red arrow heads indicate the data points for the cells shown in (B) and (D).
See also Figure S1.
DI has by definition a value of 1 if the cell has an absolutely uniform distribution of mRNA (Figure S1A). When mRNA is concentrated in a certain region, DI is less than 1 (Figures S1B–S1D). If mRNA is spread around the rim of the cell, DI becomes larger than 1 (Figure S1E).
To test the two-quantity approach (PI and DI), we analyzed localization of the budding yeast ASH1 mRNA. ASH1 expression is cell-cycle regulated and reaches a peak during mitosis. In wild-type (WT) cells, the majority of ASH1 transcripts are actively localized to the bud (Long et al., 1997) (Figure 1B). Among several proteins that regulate ASH1 localization, She2p is the primary RNA-binding protein (Niessing et al., 2004). In the absence of She2p, ASH1 mRNA becomes homogeneously distributed between the mother cell and the bud tip (Long et al., 1997) (Figure 1D). We performed single-molecule fluorescence in situ hybridization (FISH) (Femino et al., 1998) on WT and ΔSHE2 cells as described previously (Trcek et al., 2012; Zenklusen et al., 2008). Multiple fields were imaged and maximum intensity projections of Z stacks were generated for two-dimensional analysis. By using a least-squares Gaussian fitting routine, we obtained the intensity and spatial information of each fluorescent particle and processed them to quantify polarization and dispersion of RNA distribution. In order to analyze the posttranscriptional localization of mRNA, the multiple copies of mRNA at the transcription sites were excluded from the analysis. In wild-type strain, PI was 0.71 ± 0.04 (SEM) and DI was 0.50 ± 0.04. In ΔSHE2 strain, PI was 0.16 ± 0.02 and DI was 0.82 ± 0.02. Consistent with the human perception of the representative images (Figures 1B and 1D), the objective metrics indicate that the highly polarized localization of ASH1 mRNA in wild-type cells was disrupted by the deletion of SHE2 gene. In order to assess the relationship between the polarization and dispersion of mRNA in each strain, we computed the correlation coefficient of the two metrics. The Pearson correlation coefficient was −0.72 in wild-type and −0.13 in the ΔSHE2 strain. In wild-type cells, higher polarization of ASH1 mRNA was strongly associated with tighter confinement of the mRNA. This negative correlation between the polarization and the dispersion disappeared in ΔSHE2 strain (Figures 1C and 1E). The correlation coefficient describes the characteristics of RNA distributionin a certain population of cells.
We next applied the analysis method for the distribution of mRNA in chicken embryonic fibroblasts. By comparing the distribution of β-actin mRNA and GAPDH mRNA in the same cell, we investigated if localization is a general effect for any mRNA or a specific effect for β-actin mRNA. Figure 2A shows a representative image of primary CEF cells in which β-actin mRNA is localized to the leading edge (indicated with arrowheads), whereas GAPDH mRNA is more uniformly distributed. Because the densities of these mRNA species are too high to distinguish individual molecules, the distribution of pixel intensity values were analyzed instead of the distribution of discrete mRNA particles. After background subtraction, the second moment m2 was calculated by
where rij is the distance from the centroid of the cell to the pixel (i,j) within the cell boundary, and Iij is the intensity value of the pixel in a two-dimensional image. A representative cell shown in the left side of Figure 2A exhibits polarized localization of β-actin mRNA (PI = 1.14, DI = 0.35) and more uniform distribution of GAPDH mRNA (PI = 0.33, DI = 1.17). In a randomly-chosen population of CEF cells (n = 99), the mean PI was 0.47 ± 0.03 for β-actin mRNA and 0.29 ± 0.02 for GAPDH mRNA. In 82% of the cells (in the upper triangle above the red dashed line in Figure 2B), the distribution of β-actin mRNA was more polarized than GAPDH mRNA. However, the difference in the mean DI was not as significant: 0.98 ± 0.05 for β-actin mRNA and 0.82 ± 0.04 for GAPDH mRNA. Unlike yeast ASH1 mRNA, the mean values of PI and DI for β-actin mRNA indicate a moderate polarization and a loose dispersion on average because of the intrinsic cell-to-cell variation in primary CEF culture. Previously, Latham et al. (1994) reported that only 30%–35% of primary CEF localized β-actin mRNA to the cell periphery using a binary counting method. These cells showing β-actin mRNA localization may represent a subpopulation of motile cells (Kislauskis et al., 1997). Although the cell population was heterogeneous, the correlation coefficient between PI and DI for β-actin mRNA was highly negative (r = −0.61) in contrast to the low value for GAPDH mRNA (r = −0.27) (Figures S2C and S2D). This result shows that β-actin mRNA tends to exhibit polarized localization whereas GAPDH mRNA does not. The correlation coefficient between PI and DI describes the distinct localization property of each mRNA species in a population of cells.
Figure 2. Comparison of GAPDH and β-Actin mRNA Distributions in Chicken Embryonic Fibroblasts.
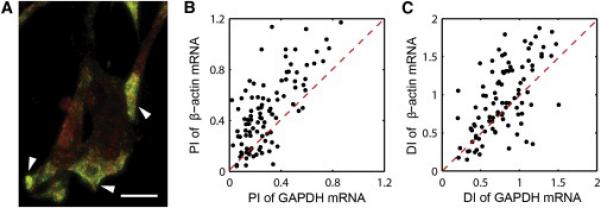
(A) FISH image of GAPDH mRNA (red), and β-actin mRNA (green). Scale bar represents 10 μm.
(B) Scatter plot of polarization index for GAPDH mRNA in x axis and β-actin mRNA in y axis.
(C) Scatter plot of dispersion index for GAPDH mRNA in x axis and β-actin mRNA in y axis. Red dashed lines indicate cells that have the same index for GAPDH and β-actin mRNA.
See also Figure S2.
Finally, we examined the performance of this method to quantify the dynamics of β-actin mRNA localization in living mammalian cells. Because the correlation between PI and DI for β-actin mRNA was high, the polarization of mRNA distribution was used as a single metric in live cell analysis. We visualized the endogenous β-actin mRNA using the cells from the Actb-MBS mouse that contains 24 repeats of MS2 binding site (MBS) cassette in the 3′ untranslated region (UTR) of the β-actin gene (Lionnet et al., 2011). Primary mouse embryonic fibroblasts (MEF) were isolated from the mouse, infected with lentivirus that expresses MS2 capsid protein fused with GFP (MCP-GFP) to allow fluorescent labeling of the β-actin transcript, and stained with membrane-permeable cytoplasmic dye. A nuclear localization sequence (NLS) was added to the N-terminus of MCP-GFP so that free NLS-MCP-GFPs preferentially localize in the nucleus lowering the background in the cytoplasm (Bertrand et al., 1998). As a negative control, we infected wild-type MEF with NLS-MCP-GFP expressing lentivirus and observed little fluorescence in the cytoplasm (Figure S3A). In the Actb-MBS MEF cells, NLS-MCP-GFP binds to MBS-tagged β-actin mRNA and the complex is exported out to the cytoplasm (Figure S3B). Using time-lapse imaging, we monitored the localization pattern of β-actin mRNA as the cell migrated on fibronectin-coated glass surface (Figure 3A and Movie S1). The velocity of the cell centroid was measured at 1-min interval, and defined as the protrusion vector. We found that the mRNA polarization vector (yellow arrows, Figure 3A) and the protrusion vector (red arrows, Figure 3A) were highly correlated in space and in time. In all of the migrating cells that we monitored (n = 11), the autocorrelation curve of protrusion vector decays faster than the one for mRNA polarization vector, indicating that mRNA localization is a slower process than random protrusions. From the mean auto-correlation curves of polarization vector (black curve, Figure 3B) and protrusion vector (red curve, Figure 3B), the half-lives are estimated to be ~16 min for mRNA localization and ~4 min for random protrusions. To quantify the relationship between RNA localization and cell protrusion, we calculated the correlation coefficients of two vectors with varying time lags. Within our time resolution, the mean correlation was the highest at zero lag time (Figure 3C). However, the skewed correlation in the negative time lag suggests that cell protrusion precedes mRNA localization in overall cell movement. It has been shown that mRNA localization is not necessary for random protrusions, but required for directed migration (Shestakova et al., 2001). We found that the net migration distance in 2 hr is highly correlated with the mean polarization index of the cell (r = 0.75) (Figure 3D). This result supports that localization of β-actin mRNA has a physiological role in directed cell migration.
Figure 3. Localization of β-Actin mRNA in a Migrating Cell.
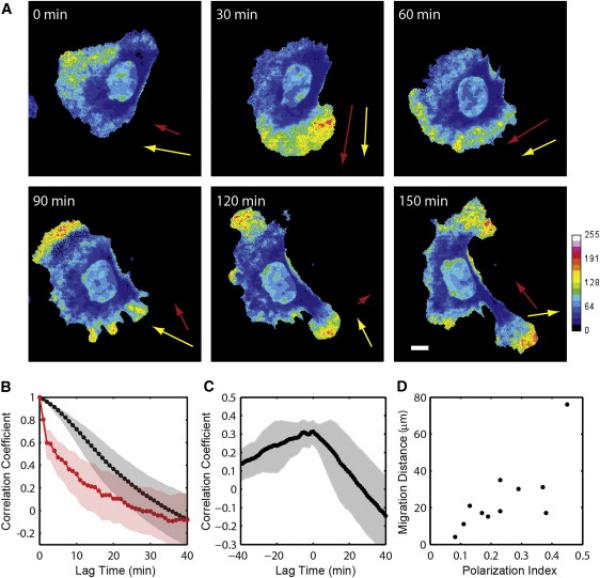
(A) Time-lapse images of a mouse embryonic fibroblast. The color map shows the fluorescence intensity of MCP-GFP labeling endogenous β-actin transcripts divided by the intensity of red fluorescent cytoplasmic dye. Yellow arrows show the polarization vector of mRNA distribution, and red arrows show the protrusion vector of the cell.
(B) Mean auto-correlation curves of the polarization vector (black) and the protrusion vector (red) (n = 11 cells). The shaded areas indicate 95% confidence intervals.
(C) Mean cross-correlation curve of the polarization vector and the protrusion vector (black curve) and 95% confidence interval (gray area) for n = 11 cells.
(D) Migration distance as a function of the time-average of the polarization index over 2 hr. The correlation coefficient between the polarization index and the migration distance is 0.75.
In summary, the combination of polarization and dispersion of mRNA distribution enables an effective assessment of mRNA localization. This approach will allow us to quantify subtle changes in RNA distribution by gene deletion or mutation, and to compare the localization characteristics of different transcripts. Moreover, a quantitative analysis of a single cell in time-lapse images will facilitate studies on the kinetics and the physiological role of mRNA localization.
We have demonstrated the utility of the new method in budding yeast and primary chicken and mouse embryonic fibroblasts. There is a requirement for this analysis that the entire cell area is imaged while maintaining sufficient sensitivity for detecting RNA signals. In order to apply this method for larger cells such as neurons (Bassell et al., 1998; Lyles et al., 2006), Drosophila embryos (Lé cuyer et al., 2007), and syncytial muscle cells (Kislauskis et al., 1993; Sigrist et al., 2000), it may be necessary to image multiple fields in three dimensions and stitch them together to reconstruct the whole specimen (Preibisch et al., 2009). In case of further application to the cells in vivo in the tissue environment, it will be useful to outline the cells by cellsurface markers or plasma membrane stains because the surrounding tissues may obscure the regions of the cell for analysis. The simple unbiased analysis of intracellular localization presented in this work may considerably enrich studies on the local regulation and function of many mRNA species.
EXPERIMENTAL PROCEDURES
FISH for Yeast
Yeast cells were grown in rich media until they reach early log phase with OD600 ~0.5 (Table S1). Cells were fixed by adding 8 ml of 32% paraformaldehyde to 42 ml of culture for 45 min at room temperature. The rest of the spheroplasting and in situ hybridization followed the procedure described previously (Trcek et al., 2012; Zenklusen et al., 2008). Briefly, we synthesized four different single stranded DNA probes each of which was 50-nucleotide-long and labeled with four Cy3 dyes (Table S2). The labeling efficiency of each probe was above 90%, indicating efficient coupling of fluorescent dye with each probe. Cells in G2 and mitosis were selected using morphological markers and analyzed for ASH1 mRNA localization (Trcek et al., 2011).
FISH for Chicken Embryonic Fibroblasts
Primary chicken embryonic fibroblast (CEF) cells were obtained from Charles River Laboratories (Wilmington, MA). Cells were plated on 10 cm culture dishes and grown at 37°C in MEM supplemented with 10% FCS in an atmosphere of 95% air/5% CO2 for 1–2 days. Cells were trypsinized and seeded on coverslips at a density of 1 × 10⁵ cells/mL. After overnight incubation, cells were washed with DPBS and fixed in 4% paraformaldehyde in PBS for 20 min. The coverslips were stored in 70% ethanol at 4 °C for a few days and processed for fluorescence in situ hybridization as described in Singer lab protocols (http://singerlab.org/protocols/). Slides were imaged using an Olympus BX-61 microscope equipped with an X-cite 120 PC lamp (EXFO), a UPlanApo 100 × 1.35 NA oil immersion objective (Olympus) and a CoolSNAP HQ CCD camera (Photometrics). We used Chroma filter set 31000 (DAPI), 41007a (Cy3), and 41008 (Cy5). Cells were imaged with 0.2 μmZ steps in each channel using MetaMorph software (Molecular Devices).
Live Cell Imaging of Mouse Embryonic Fibroblasts
Primary MEFs were cultured from 14-day-old embryos isolated from a pregnant female of Actb-MBS mouse (Lionnet et al., 2011). The head and dark cardiac tissue was removed from the embryo and the rest of the body was digested with Trypsin EDTA for 20 min. After adding media (DMEM, 10% FBS, 1% pen/strep), we selected fibroblasts by plating the cells on 10 cm culture dishes for 1 hr and washing off the unattached cells with fresh media. The next day, cells were plated on fibronectin-coated MatTek dishes (MatTek), infected with lentivirus, and incubated for 48 hr to express NLS-MCP-GFP. We stained the cells with 5 μM CellTracker Orange CMRA (Invitrogen) and replaced the culture media with L-15 media containing 10% FBS, 1% pen/strep, and 1% oxyrase (Oxyrase) prior to the experiment. Time-lapse images were taken on an Olympus IX-71 inverted microscope equipped with a UApo/340 40× 1.35 NA oil immersion objective (Olympus), an MS-2000 XYZ automated stage (ASI) and an iXon electron-multiplying charge-coupled device (EMCCD) camera (Andor). The temperature was kept at 37°C with 60% humidity in an environmental chamber (Precision Plastics). The excitation sources were 488 nm line from an argon ion laser (Melles Griot) and a 561 nm diode-pumped solid state laser (Cobolt). Multiple fields of images were acquired every 1 min using MetaMorph (Molecular Devices).
Image Analysis
Image segmentation and quantification were performed using custom designed MATLAB programs. If the cell was larger than the field of view, the 2D/3D Stitching Plugin available through Fiji was used to create a tiled image (Preibisch et al., 2009). To analyze the fixed-cell data, cells were segmented using the DIC or auto-fluorescence image. A binary mask was generated and the centroid of the cell was calculated by the mean value of x- and y-coordinate of the pixels within the mask region. For single-molecule FISH images, a maximum intensity projection of Z stacks was used to quantify mRNA distribution. In budding yeast images, each fluorescent spot was fit with a two-dimensional Gaussian function, yielding the amplitude and the position of the fluorescent particle. From the histogram of fluorescence intensity, the majority of the detected spots were identified as single probes bound nonspecifically. The average intensity of single probes was used to calculate the number of probes bound in each fluorescent spot inside a cell. Only the bright spots binding more than four probes were selected to analyze the number and the position of the target mRNA. The mean and the variance of the x- and y-coordinates of the RNA molecules except for the ones at the transcription sites were used to calculate the polarization and dispersion indices. For FISH images of CEFs, the background was determined from the median intensity value within each cell boundary. After background subtraction, the intensity-weighted centroid and the second moment were calculated.
To analyze the live-cell data, masks were generated that define the cell and the nucleus from the CellTracker dye image and the NLS-MCP-GFP image, respectively. The center of the cell was identified by the intensity-weighted centroid of the cytoplasmic dye image. After background subtraction, the NLS-MCP-GFP image was divided by the CellTracker image to obtain RNA distribution image normalized by the cytoplasmic volume. The center of RNA was determined by the weighted centroid of the resulting image excluding the nuclear region. For each time point, the RNA polarization vector was calculated as the vector pointing from the center of the cell to the center of RNA.
The protrusion vector was defined as the instantaneous velocity of the cell calculated every 1 min. The net migration distance was determined to be the distance between the beginning and ending points of the cell trajectory. Auto-correlation and cross-correlation of any two sets of vectors were computed by the dot product of the vectors with varied time lags using a similar method demonstrated by Weiger et al. (2010). The half-lives of mRNA polarization and cell protrusion were determined at the correlation coefficient of 0.5 from the autocorrelation curves.
Supplementary Material
Figure S1. Monte Carlo Simulation of Localization Patterns, Related to Figure 1
(A-E) Simulated localization patterns of 1,000 particles in a bounded circle. (F) Each data point indicates the polarization index and the dispersion index of the corresponding localization pattern shown in (A)-(E).
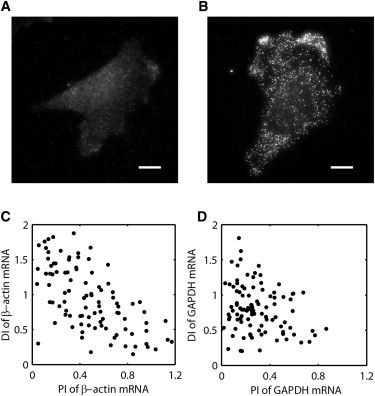
Figure S2. Specificity of Single-Molecule FISH and Quantification of mRNA Distribution, Related to Figure 2
(A and B) FISH with MS2_LK51 probe to wild-type MEF (A) and Actb-MBS MEF (B). The intensity range is the same for the two images. Because each β-actin mRNA in the Actb-MBS MEF contains 12 repeats of the MS2 linker, the bright spots in (B) indicate the presence of MBS-tagged β-actin mRNA with high specificity. Low fluorescence from nonspecific binding of single probes as shown in (A) is excluded from the analysis by thresholding the intensity value. The specificity of single-molecule FISH method has been also demonstrated previously (Femino et al., 1998 and Zenklusen et al., 2008). Scale bars, 10 μm.
(C and D) Quantification of β-actin mRNA and GAPDH mRNA distributions in chicken embryonic fibroblasts. Scatter plot of polarization index in x axis and dispersion index in y axis for β-actin mRNA (A) and for GAPDH mRNA (B).
Figure S3. Comparison of NLS-MCP-GFP Fluorescence in Wild-Type MEF and Actb-MBS MEF, Related to Figure 3
(A and B) Fluorescence images of NLS-MCP-GFP expressed in wild-type MEF (A) and Actb-MBS MEF (B). The intensity range is the same for the two images. In the absence of MBS, NLS-MCP-GFP localizes to the nucleus as shown in (A). In Actb-MBS MEF, NLS-MCP-GFP bound to MBS-tagged β-actin mRNA appears in the cytoplasm. Scale bars, 10 μm.
Movie S1. Localization of β-actin mRNA during Cell Migration, Related to Figure 3.
Distribution of β-actin mRNA in a migrating cell in real time. The color map shows the fluorescence intensity of NLS-MCP-GFP divided by the intensity of cytoplasmic dye, representing the concentration of β-actin mRNA. The time-lapse images were recorded for 3 hr. The localization pattern of β-actin mRNA is highly dynamic and correlated with the cell protrusion and migration.
ACKNOWLEDGMENTS
Microscopy equipment for the live cell imaging experiments was provided by the Gruss Lipper Biophotonics Center. This work was supported by NIH GM57071, GM84364 and GM86217 to R.H.S. H.Y.P. was supported by National Research Service Awards F32-GM087122.
Footnotes
Supplemental Information includes three figures, two tables, and one movie and can be found with this article online at doi:10.1016/j.celrep.2011.12.009.
REFERENCES
- Bassell GJ, Zhang H, Byrd AL, Femino AM, Singer RH, Taneja KL, Lifshitz LM, Herman IM, Kosik KS. Sorting of beta-actin mRNA and protein to neurites and growth cones in culture. J. Neurosci. 1998;18:251–265. doi: 10.1523/JNEUROSCI.18-01-00251.1998. [DOI] [PMC free article] [PubMed] [Google Scholar]
- Bertrand E, Chartrand P, Schaefer M, Shenoy SM, Singer RH, Long RM. Localization of ASH1 mRNA particles in living yeast. Mol. Cell. 1998;2:437–445. doi: 10.1016/s1097-2765(00)80143-4. [DOI] [PubMed] [Google Scholar]
- Femino AM, Fay FS, Fogarty K, Singer RH. Visualization of single RNA transcripts in situ. Science. 1998;280:585–590. doi: 10.1126/science.280.5363.585. [DOI] [PubMed] [Google Scholar]
- Jeffery WR, Tomlinson CR, Brodeur RD. Localization of actin messenger RNA during early ascidian development. Dev. Biol. 1983;99:408–417. doi: 10.1016/0012-1606(83)90290-7. [DOI] [PubMed] [Google Scholar]
- Jourdren L, Delaveau T, Marquenet E, Jacq C, Garcia M. CORSEN, a new software dedicated to microscope-based 3D distance measurements: mRNA-mitochondria distance, from single-cell to population analyses. RNA. 2010;16:1301–1307. doi: 10.1261/rna.1996810. [DOI] [PMC free article] [PubMed] [Google Scholar]
- Kislauskis EH, Li Z, Singer RH, Taneja KL. Isoform-specific 3′-untranslated sequences sort alpha-cardiac and beta-cytoplasmic actin messenger RNAs to different cytoplasmic compartments. J. Cell Biol. 1993;123:165–172. doi: 10.1083/jcb.123.1.165. [DOI] [PMC free article] [PubMed] [Google Scholar]
- Kislauskis EH, Zhu X, Singer RH. beta-Actin messenger RNA localization and protein synthesis augment cell motility. J. Cell Biol. 1997;136:1263–1270. doi: 10.1083/jcb.136.6.1263. [DOI] [PMC free article] [PubMed] [Google Scholar]
- Latham VM, Jr., Kislauskis EH, Singer RH, Ross AF. Betaactin mRNA localization is regulated by signal transduction mechanisms. J. Cell Biol. 1994;126:1211–1219. doi: 10.1083/jcb.126.5.1211. [DOI] [PMC free article] [PubMed] [Google Scholar]
- Lawrence JB, Singer RH. Intracellular localization of messenger RNAs for cytoskeletal proteins. Cell. 1986;45:407–415. doi: 10.1016/0092-8674(86)90326-0. [DOI] [PubMed] [Google Scholar]
- Lé cuyer E, Yoshida H, Parthasarathy N, Alm C, Babak T, Cerovina T, Hughes TR, Tomancak P, Krause HM. Global analysis of mRNA localization reveals a prominent role in organizing cellular architecture and function. Cell. 2007;131:174–187. doi: 10.1016/j.cell.2007.08.003. [DOI] [PubMed] [Google Scholar]
- Lionnet T, Czaplinski K, Darzacq X, Shav-Tal Y, Wells AL, Chao JA, Park HY, de Turris V, Lopez-Jones M, Singer RH. A transgenic mouse for in vivo detection of endogenous labeled mRNA. Nat. Methods. 2011;8:165–170. doi: 10.1038/nmeth.1551. [DOI] [PMC free article] [PubMed] [Google Scholar]
- Long RM, Singer RH, Meng X, Gonzalez I, Nasmyth K, Jansen RP. Mating type switching in yeast controlled by asymmetric localization of ASH1 mRNA. Science. 1997;277:383–387. doi: 10.1126/science.277.5324.383. [DOI] [PubMed] [Google Scholar]
- Lyles V, Zhao Y, Martin KC. Synapse formation and mRNA localization in cultured Aplysia neurons. Neuron. 2006;49:349–356. doi: 10.1016/j.neuron.2005.12.029. [DOI] [PubMed] [Google Scholar]
- Meignin C, Davis I. Transmitting the message: intracellular mRNA localization. Curr. Opin. Cell Biol. 2010;22:112–119. doi: 10.1016/j.ceb.2009.11.011. [DOI] [PubMed] [Google Scholar]
- Niessing D, Hü ttelmaier S, Zenklusen D, Singer R, Burley SK. She2p is a novel RNA binding protein with a basic helical hairpin motif. Cell. 2004;119:491–502. doi: 10.1016/j.cell.2004.10.018. [DOI] [PubMed] [Google Scholar]
- Preibisch S, Saalfeld S, Tomancak P. Globally optimal stitching of tiled 3D microscopic image acquisitions. Bioinformatics. 2009;25:1463–1465. doi: 10.1093/bioinformatics/btp184. [DOI] [PMC free article] [PubMed] [Google Scholar]
- Shestakova EA, Singer RH, Condeelis J. The physiological significance of beta -actin mRNA localization in determining cell polarity and directional motility. Proc. Natl. Acad. Sci. USA. 2001;98:7045–7050. doi: 10.1073/pnas.121146098. [DOI] [PMC free article] [PubMed] [Google Scholar]
- Sigrist SJ, Thiel PR, Reiff DF, Lachance PE, Lasko P, Schuster CM. Postsynaptic translation affects the efficacy and morphology of neuromuscular junctions. Nature. 2000;405:1062–1065. doi: 10.1038/35016598. [DOI] [PubMed] [Google Scholar]
- Trcek T, Chao JA, Larson DR, Park HY, Zenklusen D, Shenoy SM, Singer RH. Single-mRNA counting using fluorescent in situ hybridization in budding yeast. Nat. Protoc. 2012;7:408–419. doi: 10.1038/nprot.2011.451. [DOI] [PMC free article] [PubMed] [Google Scholar]
- Trcek T, Larson DR, Moldon A, Query CC, Singer RH. Single-molecule mRNA decay measurements reveal promoter regulated mRNA stability in yeast. Cell. 2011;147:1484–1497. doi: 10.1016/j.cell.2011.11.051. [DOI] [PMC free article] [PubMed] [Google Scholar]
- Weiger MC, Ahmed S, Welf ES, Haugh JM. Directional persistence of cell migration coincides with stability of asymmetric intracellular signaling. Biophys. J. 2010;98:67–75. doi: 10.1016/j.bpj.2009.09.051. [DOI] [PMC free article] [PubMed] [Google Scholar]
- Yamagishi M, Shirasaki Y, Funatsu T. Size-dependent accumulation of mRNA at the leading edge of chicken embryo fibroblasts. Biochem. Biophys. Res. Commun. 2009;390:750–754. doi: 10.1016/j.bbrc.2009.10.043. [DOI] [PubMed] [Google Scholar]
- Zenklusen D, Larson DR, Singer RH. Single-RNA counting reveals alternative modes of gene expression in yeast. Nat. Struct. Mol. Biol. 2008;15:1263–1271. doi: 10.1038/nsmb.1514. [DOI] [PMC free article] [PubMed] [Google Scholar]
- Zimyanin VL, Belaya K, Pecreaux J, Gilchrist MJ, Clark A, Davis I, St Johnston D. In vivo imaging of oskar mRNA transport reveals the mechanism of posterior localization. Cell. 2008;134:843–853. doi: 10.1016/j.cell.2008.06.053. [DOI] [PMC free article] [PubMed] [Google Scholar]
Associated Data
This section collects any data citations, data availability statements, or supplementary materials included in this article.
Supplementary Materials
Figure S1. Monte Carlo Simulation of Localization Patterns, Related to Figure 1
(A-E) Simulated localization patterns of 1,000 particles in a bounded circle. (F) Each data point indicates the polarization index and the dispersion index of the corresponding localization pattern shown in (A)-(E).
Figure S2. Specificity of Single-Molecule FISH and Quantification of mRNA Distribution, Related to Figure 2
(A and B) FISH with MS2_LK51 probe to wild-type MEF (A) and Actb-MBS MEF (B). The intensity range is the same for the two images. Because each β-actin mRNA in the Actb-MBS MEF contains 12 repeats of the MS2 linker, the bright spots in (B) indicate the presence of MBS-tagged β-actin mRNA with high specificity. Low fluorescence from nonspecific binding of single probes as shown in (A) is excluded from the analysis by thresholding the intensity value. The specificity of single-molecule FISH method has been also demonstrated previously (Femino et al., 1998 and Zenklusen et al., 2008). Scale bars, 10 μm.
(C and D) Quantification of β-actin mRNA and GAPDH mRNA distributions in chicken embryonic fibroblasts. Scatter plot of polarization index in x axis and dispersion index in y axis for β-actin mRNA (A) and for GAPDH mRNA (B).
Figure S3. Comparison of NLS-MCP-GFP Fluorescence in Wild-Type MEF and Actb-MBS MEF, Related to Figure 3
(A and B) Fluorescence images of NLS-MCP-GFP expressed in wild-type MEF (A) and Actb-MBS MEF (B). The intensity range is the same for the two images. In the absence of MBS, NLS-MCP-GFP localizes to the nucleus as shown in (A). In Actb-MBS MEF, NLS-MCP-GFP bound to MBS-tagged β-actin mRNA appears in the cytoplasm. Scale bars, 10 μm.
Movie S1. Localization of β-actin mRNA during Cell Migration, Related to Figure 3.
Distribution of β-actin mRNA in a migrating cell in real time. The color map shows the fluorescence intensity of NLS-MCP-GFP divided by the intensity of cytoplasmic dye, representing the concentration of β-actin mRNA. The time-lapse images were recorded for 3 hr. The localization pattern of β-actin mRNA is highly dynamic and correlated with the cell protrusion and migration.