

Abstract
We present an experimental study of coupling of isotachophoresis (ITP) and affinity chromatography (AC) to effect rapid, selective purification with high column utilization and high resolution. We provide a detailed protocol for performing ITP-AC and describe the design of a buffer system to perform sequence specific separation of nucleic acids. We describe the synthesis and functionalization of our affinity substrate, poly(glycidyl methacrylate-co-ethylene dimethacrylate) porous polymer monolith (GMA-EDMA PPM). This substrate allows easy immobilization of affinity probes, is nonsieving (even to macromolecules), and exhibits negligible nonspecific binding. We demonstrate ITP-AC with 25 nt, Cy5 labeled DNA target and a DNA probe and study the spatiotemporal dynamics using epifluorescence imaging. We make qualitative and quantitative comparisons between these data and the model presented in the first part of this two-paper series. We vary the target concentration from 1 pg μL–1 to 100 pg μL–1 and ITP velocity over the range of 10–50 μm s–1, and thereby explore over 4 orders of magnitude of scaled target amount. We observe very good agreement between predictions and experimental data for the spatiotemporal behavior of the coupled ITP and affinity process, and for key figures of merit, including scaled capture length and maximum capture efficiency. Lastly, we demonstrate that the resolution of ITP-AC increases linearly with time and purify 25 nt target DNA from 10 000-fold higher abundance background (contaminating) genomic fish sperm DNA. We perform this capture from 200 μL of sample in under 1 mm column length and within <10 min.
Affinity chromatography (AC) is a popular chromatographic technique for specific purification and/or analysis of enzymes, lectins, other proteins, and nucleic acids from various samples.1−4 However, when sample components of interest are present in very low concentrations, a substantial volume of sample must be processed through the affinity substrate. Low target concentrations and high concentrations of fouling or competing species also imply low target-probe binding rates.5 These factors increase the time of the affinity assay, and they can lead to poor substrate utilization and/or poor purification yield, limiting applications of AC. As we presented in Part 1, we propose to address these limitations of AC by preconcentrating and purifying the target immediately prior to and during affinity reaction using isotachophoresis (ITP).6
ITP has been used experimentally in conjunction with affinity-type assays in several applications. For example, Abelev et al. used ITP with counterflow to transport sample compounds onto regions of immobilized proteins on cellulose acetate and nitrocellulose membranes.7−13 Abelev et al. used the binding to detect the presence, and analyze the properties, of antibodies,7−13 lectins,9,10,12 other proteins,7,8 and nucleic acids.11 However, in their work, ITP was used only as a pump-free, reproducible transport mechanism, and not to substantially preconcentrate the analytes with ITP and demonstrably accelerate reactions.13 Garcia-Schwartz et al. presented an approach combining ITP and an affinity reaction to detect micro-RNA.14,15 They used ITP to accelerate hybridization between a target species and a mobile fluorescent DNA probe in a microchannel. This ITP zone was then transported into a channel section containing cross-linked polyacrylamide gel functionalized with DNA complementary to the fluorescent DNA probe. This method was used to remove signal background (a negative enrichment strategy) and, thus, enhance sequence specific quantitation and specificity.14,15 Recently (in work published during preparation of this manuscript), Karsenty et al. used ITP to accelerate a reaction of a DNA target to an immobilized DNA probe on a short region of stationary magnetic beads.16 In this relatively simple demonstration, only a small portion (<1%) of the target is captured uniformly by the short (order of ITP peak width) bead region and detected. Recently, Han et al.200 used ITP to improve sensitivity and speed of DNA array hybridization, detecting twenty targets down to 100 fM in 30 min, also with <1% capture efficiency. Despite these related studies, we know of no use of ITP with affinity reactions to capture and recover (i.e., purify) target molecules. We also know of no demonstrations where most of the ITP-focused target is captured and detected on an AC column.
In Part 1 of this two-paper series, we described the principle of coupling ITP preconcentration and AC purification to purify and/or analyze all of the target focused in ITP.6 Relevant to the current experiments, we derived and discussed an analytically solvable one-dimensional transport model for coupling of ITP with a semi-infinite AC porous column with second-order reversible reaction kinetics. Our model captured the spatiotemporal dynamics of target-probe binding including the coupled effects of target distribution width, distribution intensity, application velocity, forward and reverse reaction constants, and probe concentration on necessary affinity region length, assay time, and capture efficiency. Our formulation collapses these six independent variables to three nondimensionalized parameters: α, β, and Da. Parameters α and Da represent the scaled target distribution height and width, respectively, and β represents a scaled dissociation constant. We will discuss trends predicted by our model below, as these are relevant to the current comparisons between experimental results and our model.
Here, we demonstrate experimentally ITP-enhanced affinity capture in 500-μm inner diameter glass capillary with a poly(glycidyl methacrylate-co-ethylene dimethacrylate) (GMA-EDMA) porous polymer monolith (PPM) with pores on the order of 2 μm, functionalized with cDNA probes. We employed GMA-EDMA as GMA epoxy group allowed for easy immobilization of DNA probes. These 2-μm-diameter pores allowed us to migrate target macromolecules (here DNA) without target sieving, or exclusion effects from concentration polarization, or Donnan exclusion. Lastly, we used GMA-EDMA because it is translucent (enabling fluorescent detection of bound DNA), can be UV photopolymerized, and is easily incorporated into microfluidic devices.
In this paper, we first explain our choice of the affinity substrate, GMA-EDMA PPM for ITP-AC. We then describe the synthesis of GMA-EDMA, and its functionalization with DNA probes. Next, we describe our protocol for our ITP-enhanced affinity study, as well as the choice of buffer chemistry for ITP-AC of DNA. We chose a DNA target for this demonstration of ITP-AC because nucleic acids are important clinical markers and therapeutic agents,17−19 which often require rapid purification prior to analysis or use.20−24 Next, we present an experimental validation of our model from Part 16 with experiments using a Cy5 labeled 25 nt synthetic DNA target and a synthetic DNA PPM immobilized probe. Lastly, using our technique, we demonstrate high-resolution sequence-specific purification of 25 nt target DNA from genomic fish sperm DNA, as an example of extraction from a high abundance background (with a mass 10 000-fold greater than that of the target).
Experimental Methods
Here, we describe our experimental setup and materials, our choice of affinity substrate, GMA-EDMA PPM, the synthesis of this PPM, and functionalization of this PPM with cDNA. We also discuss ITP-AC protocol and our choice of ITP-AC buffer chemistry.
Experimental Setup
Figure 1 summarizes the major features of our experimental setup, including the power supply, optical detection hardware, and the PPM affinity structure integrated into a capillary and forming the affinity column. We performed ITP-aided affinity chromatography experiments in Model 53432-728 micropipet capillaries (501 μm inner diameter; borosilicate glass) (VWR, Vasalia, CA) secured in a custom-built capillary setup, which interfaced LE and TE reservoirs to the capillary (see Figure 1a and section SI 5 in the Supporting Information (SI)). Using these capillaries allowed us to iterate through PPM synthesis chemistries and DNA functionalization chemistries in an easy and cost-effective manner. To apply current for ITP, we used platinum wire electrodes (Sigma–Aldrich, St. Louis, MO) and a Model 2410 high-voltage sourcemeter (Keithley Instruments, Cleveland, OH) in galvanostatic mode.
Figure 1.
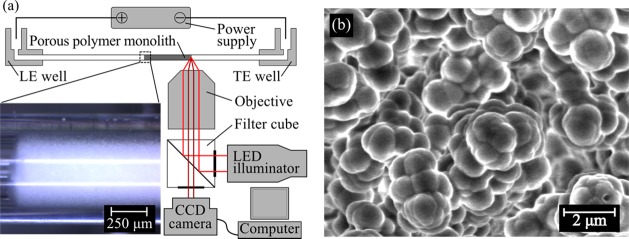
(a) Schematic of the experimental setup consisting of a custom-built capillary setup, a high-voltage power supply, and an epifluorescence microscope with a CCD camera. The inset in the lower left is a bright-field image of the GMA-EDMA PPM inside a borosilicate glass capillary with an inner diameter of 500 μm. (b) SEM micrograph of our GMA-EDMA substrate for probe immobilization. The PPM morphology consisted of globules ∼1 μm in diameter, and these formed pores ∼2 μm in diameter, ensuring that the porous affinity region had small hydrodynamic resistance and easily permitted ITP focusing and transport without sieving effects.
We monitored our experiments and performed fluorescence measurements of the PPM with an Olympus Model IX70 inverted fluorescence microscope equipped with 4× (NA of 0.16) and 2× (NA of 0.08) objectives (Olympus, Hauppauge, NY), filter cubes (Models XF110-2 and XF115-2, Omega Optical, Brattleboro, VT), and 627-nm red and 470-nm blue LEDs (ThorLabs, Newton, NJ) for illumination. We captured images with a 12-bit, 2048 × 2048 pixel charge coupled device (CCD) camera with 7.4 μm × 7.4 μm pixels (Photometrics CoolSNAP K4) controlled with WinView software, (Roper Scientific, Trenton, NJ). We post-processed the images with custom in-house scripts written in MATLAB (Mathworks, Natick, MA).
Materials
Ethylene dimethacrylate (EDMA, CAS No. 97-90-5), glycidyl methacrylate (GMA, CAS No. 106-91-2), inhibitor removal media (Product No. 311332; CAS No. 9003-70-7), azobis(isobutyronitrile) (CAS No. 78-67-1), 3-(trimethoxysilyl)propyl methacrylate (TSPM, CAS No. 2530-85-0), sodium dodecyl sulfate (SDS), acetone, and methanol (MeOH, 99.93% purity) were purchased from Sigma–Aldrich. n-Hexane (HPLC grade, 95+% purity) was purchased from Alfa Aesar. Saline-sodium citrate (SSC) buffer 20X was obtained from Invitrogen (Carlsbad, CA). Fish sperm DNA (CAS No. 100403-24-5) was obtained from Amresco (Solon, OH). Synthetic oligos were purchased from Integrated DNA Technologies (Coralville, IA) and the Protein and Nucleic Acid (PAN) facility at Stanford University (Stanford, CA).
Porous Polymer Monolith Synthesis and Functionalization
For our affinity substrate, we chose GMA-EDMA PPM, since the epoxide group on GMA is known to be highly reactive to primary amines on biopolymers such as nucleic acids20,25 and proteins26−28 and other well-known affinity ligands.3 We cross-linked GMA with EDMA via a free-radical, UV-initiated polymerization in the presence of MeOH and hexane as solvents, with AIBN as a photoinitiator.29 We then functionalized the PPM with DNA, via epoxy-amine reaction between the GMA epoxy group and a primary amine on the synthetic DNA probe. (See section SI 6 in the Supporting Information for details regarding the choice of PPM chemistry, and protocols for PPM synthesis and functionalization.)
ITP-Aided Affinity Chromatography Protocol
The protocol for our experiments is summarized in Figure 2, along with example experimental data. We began by filling the LE reservoir and the capillary with integrated affinity column with the LE buffer by applying a vacuum of 68 kPa to the TE reservoir. We then mixed the sample containing the target with the TE buffer and placed this in the TE reservoir (Figure 2a, Step 1). We then applied a constant current, inducing ITP extraction, purification, and focusing. We refer to this current as “run current”. Under ITP transport, the LE ions in the capillary migrated toward the LE reservoir, followed by the TE ions. The target ions (DNA) have an electrophoretic mobility intermediate to our LE and TE ions, and so overspeed neighboring TE ions and focus at the interface. The DNA is quickly (within 15 min) concentrated to at least 100-fold at the LE/TE interface, resulting in a sharp, Gaussian-like peak (Figure 2a, Step 2). The target DNA was labeled and visualized with fluorescent Cy5 dye. To purify unlabeled DNA, the LE/TE interface can be tracked noninvasively, for example, with species-altered fluorescence imaging30 or via current monitoring.31 Any matrix and/or interference ions with electrophoretic mobilities lower than that of the TE were separated from the target (Figure 2a, Step 2). Prior to the target migrating into the porous affinity region, we lowered the current to a value we refer to as “capture current”. We thus employed two magnitudes of current for our experiments, allowing us to independently control the time to focus target and the rate of transport through the affinity region. The concentrated target then migrated into the porous affinity region, where it was captured by the immobilized probe (Figure 2a, Step 2; Figure 2b). The LE/TE interface continued to migrate through the affinity region and beyond. We ended the experiment once the LE/TE interface migrated far enough from the capture region. To quickly terminate the reverse (dissociation) reaction, we displaced the LE and TE buffers entirely from the column with air (applying vacuum to the LE reservoir). The drying-out of this column quickly disrupts any dissociation reactions, enabling capture levels close to those of the focused ITP concentration. To elute and harvest the captured target, we then introduced a finite liquid slug (∼5 μL) of elution buffer into the capillary. We used a syringe to drive this slug through the column and, thus, elute the target (Figure 2a, Step 4). We removed this eluted volume from the column and quickly quenched the alkaline elution buffer (50 mM NaOH) with 200 mM HEPES to achieve near neutral pH. In section SI 1 in the Supporting Information, we provide more details of our injection protocol, including an estimate of the efficiency of target extraction from the TE reservoir.
Figure 2.
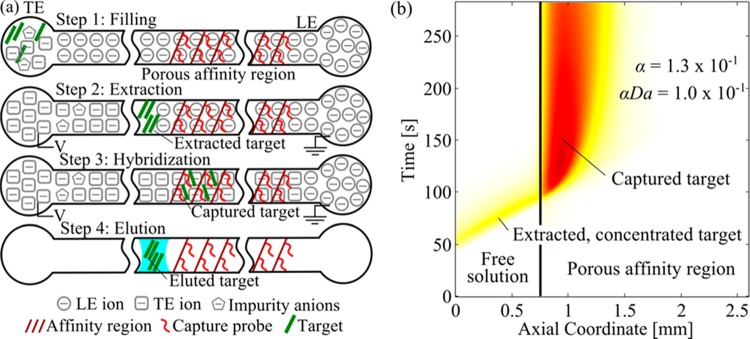
(a) Schematic illustrating our assay for ITP-aided affinity chromatography in a porous polymer monolith column. We filled the LE reservoir and affinity column with LE buffer (via vacuum at the TE reservoir), and then introduce the sample and TE mixture into the TE reservoir (Step 1). We apply an electric field (from LE to TE) and the target species are extracted and focused into a sharp ITP peak (Step 2). The target migrates into the affinity region and is captured by the immobilized probe (Step 3). After capture, we displace the LE and TE buffers with air to arrest the desorption reaction. We then introduce a small (roughly 5 μL) slug of elution buffer to remove and collect the bound target from the column (Step 4). (b) Spatiotemporal plot of experimentally measured target concentration showing dynamics of a typical ITP-AC binding experiment. The concentrated target (visualized with Cy5 fluorescence) entered the porous affinity region from the left and was captured by the immobilized probes. In this experiment, αDa = 1.0 × 10⁻¹ and α = 1.3 × 10⁻¹.
ITP-AC Choice of Buffer Chemistry
We explored a significant number of variations of our chemistry and here summarize our final choice. The LE buffer consisted of 250 mM HCl and 500 mM Tris. The TE buffer, as placed in the TE well, consisted of 25 mM HEPES, 50 mM Tris, and varying amounts of target and/or contaminating species. We chose chloride and HEPES as the LE and TE ions, respectively, to provide a good tradeoff between focusing the target DNA and excluding contaminants. We chose Tris as a counterion to provide a pH of 8.2 for the hybridization reaction, as the hybridization of DNA occurs readily around this pH.32,33 (See section SI 7 in the Supporting Information for more details regarding our choices of buffer chemistry for ITP-AC.)
Results and Discussion
First, we briefly review the results of our model from Part 1 of this two-part series6 and then present a series of experiments that we used to study ITP-AC and validate our model. In these experiments, we measured the target migration in ITP and its subsequent hybridization reaction with the immobilized probe. We varied the scaled total target amount, αDa, over 4 orders of magnitude by varying the target amount and ITP velocity. We compared the spatiotemporal behavior of ITP-AC, capture length, and capture efficiency to that predicted by our model that was described in Part 1 of this two-part series.6 Lastly, we demonstrated purification of the 25 nt DNA target from 10 000-fold more-abundant fish sperm DNA.
Brief Review of ITP-AC Trends Predicted by Our Model
Here, we summarize some insights from the model presented in Part 1 of our two-part series.6 These insights guided our experimental efforts and are relevant to the experiment versus prediction comparisons presented below. Briefly, our analysis showed that the product αDa represents the scaled total target amount and acts as a saturation parameter. For αDa < 1, there is an insufficient amount of target to locally saturate the affinity region. In this regime, the dimensional capture length, pz, which is the physical distance required to capture 95% of the target, is governed only by the balance of advection and reaction. In this regime, pz = 2.8u/(k1N). For αDa > 1, the affinity region becomes locally saturated, starting at the leading edge. In this regime, the capture length is proportional to the total target amount. For αDa ≤ 1 and Da < 0.1, the target distribution acts as a Dirac delta distribution, relative to the affinity region. In this regime, the capture time, pt, which is the physical time required to capture 95% of the target, is determined solely by the kinetics of the reaction; pt = 4.3/(k1N). For αDa ≤ 1 and Da > 1, the target distribution is relatively wide and the capture time is governed by the time to advect the target into the affinity region. In the latter regime, pt ≈ 5.4σ/u. We showed that, by decreasing Da (e.g., as with ITP preconcentration), we can reduce AC assay time and/or improve column utilization. Lastly, we showed that the integration of ITP and AC separates the target and contaminants into nondiffusing zones, so the resolution of ITP-AC scales proportionally with time.
Measurement of ITP-AC Parameters
In the comparison of model versus experiments, we strived to minimize the number of assumed parameters and find global parameters that represented the entire dataset (not just individual conditions). Our model requires three parameters: α, β, and Da. To evaluate these, we directly measured the values of u, pz, a, n, and N, so we make no assumptions regarding these parameters. We measured u directly from spatiotemporal data of target migration in free solution in front of the PPM. We measured pz by integrating the width-averaged measured fluorescence intensity, with respect to the axial coordinate, to find the bounds containing 95% of the total integrated intensity. We measured a and n by measuring fluorescence intensity in the spatiotemporal fluorescence data and by interpolating within calibration curve for Cy5 fluorescence vs DNA concentration (see section SI 2 in the Supporting Information). Similarly, in separate experiments, we measured N by measuring the fluorescence intensity of Cy5 modified probe bound to the PPM and interpolating on a Cy5 fluorescence vs DNA concentration curve.
After measuring values of u, pz, a, n, and N, we had several choices of obtaining the values of Kd and k1. We chose to demonstrate our assay using DNA target and capture probes with high hybrid melting temperature, so the reactions in our experiments are strongly irreversible. This made the model predictions very weak functions of Kd. We chose to estimate and fix the value of Kd and then vary k1 as the sole “free” parameter. We estimated Kd based on published experimental measurements of Kd for similar oligonucleotide lengths and similar ionic strengths (see section SI 3 in the Supporting Information). For all of our experiments, Kd ≈ 10–11 M and β ≈ 3 × 10⁻⁷. This β value is much lower than a β value for which any decrease of capture efficiency or streaking could be expected from the target-affinity probe dissociation (see the section entitled “Control of Capture Efficiency (n/N)” in Part 1 of this two-paper series6). From our model-versus-experiment comparisons, we obtained a value for k1 of 1.5 × 10³ M–1 s–1, and this provided the best global fit to all 18 experiments in our dataset (spanning six experimental conditions). This value for the on-rate constant is consistent with that observed by, for example, Gao et al. for surface hybridization of DNA with some secondary structure.34 For example, Gao et al. obtained forward rate constants ranging from 3 × 10³ M–1 s–1 for probes and targets with some secondary structure to 5 × 10⁴ M–1 s–1 for probes and targets with little secondary structure for 25 nt probes and targets.34 (See section SI 3 in the Supporting Information for the predicted secondary structure of our target and probe. See section SI 9 in the Supporting Information for additional discussion and recommendations for practical ITP-AC parameters.)
Spatiotemporal Behavior of ITP-AC
We observed and quantified the spatiotemporal behavior of ITP-AC by tracking the target while it was migrating in ITP in free solution and while it was reacting with the immobilized probe in PPM. In Figure 2b, we show a spatiotemporal plot of the target entering the PPM from free solution and reacting with the immobilized probe in the PPM. We plot the averaged Cy5 fluorescence intensity, based on the channel cross-sectional area, as a function of distance along the axial coordinate and time.
In this experiment, we spiked 10 nM target DNA into the TE and performed ITP in galvanostatic mode with a run current of 800 μA and a capture current of 200 μA. Both the ITP velocity and the electro-osmotic flow velocity are proportional to the current. For this system, the electro-osmotic flow is in the direction opposite of the LE/TE interface migration and therefore decreases the ITP velocity. The electric field in the LE/TE interface is also proportional to the current in the system. This electric field counteracts target dispersion, and, therefore, the target distribution width in this regime is inversely proportional to the current in the system.35−38 Therefore, as in typical ITP dynamics, the capture current simultaneously controlled the net target velocity and the target distribution width. This combination of target concentration and capture current resulted in values of α = 1.3 × 10⁻¹ and αDa = 1.0 × 10⁻¹.
The target focused in ITP migrated at constant velocity in a Gaussian-like distribution toward the PPM (Figure 2b). As we described in the section entitled “ITP-Aided Affinity Chromatography Protocol”, we performed ITP-AC experiments with semi-infinite injection, meaning that a small amount of target continuously streamed through the TE into the Gaussian peak. As we observe in Figure 2b, the concentration of target in the TE is negligibly small. Hence, we approximate the initial target distribution (the distribution just before the target enters the PPM) as a perfectly Gaussian distribution, as occurs with finite injection ITP (and as assumed by our model).
Upon reaching the monolith, the target immediately began to bind with the affinity probe, penetrating ∼2.8 advection-reaction length scales into the affinity region (see Figure 2b). As shown in Figure 2b, there is an increase in fluorescence intensity (by a factor of ∼1.7) when the target enters the PPM. This effect was observed both with ITP and without ITP in our PPMs. It was also observed with and without immobilized probes (see section SI 2 in the Supporting Information). Such observations lead us to attribute this to the refractive optical properties of the PPM, and we corrected for this when measuring a, n, and N.
Comparison between Predicted and Measured Spatiotemporal Behavior of ITP-AC
In Figure 3, we compare the spatiotemporal behavior of three ITP-AC experiments (bottom row) with that predicted by theory (top row) from Part 1 of this two-part series.6 We plot the logarithm of the averaged fluorescence intensity, based on the channel cross-sectional area, as a function of distance along the axial coordinate inside the PPM and time. To predict the spatiotemporal plots, we neglected the effects of photobleaching and assumed a proportional relationship between the fluorescence intensity of Cy5 and target concentration. For experiments shown in Figures 3d, 3e, and 3f, we spiked 10000, 100, and 100 pM target DNA into the TE, respectively. We performed ITP in galvanostatic mode with a run current of 800 μA and capture currents of 200, 200, and 600 μA, respectively. These combinations of target concentrations and capture currents resulted in the following αDa and α values: αDa = 1.0 × 10⁻¹ and α = 1.3 × 10⁻¹ for a target concentration of 10000 pM and a capture current of 200 μA; αDa = 4.3 × 10⁻⁴ and α = 1.1 × 10⁻³ for a target concentration of 100 pM and a capture current of 200 μA; and αDa = 1.7 × 10⁻⁴ and α = 9.2 × 10⁻⁴ for a target concentration of 100 pM and a capture current of 600 μA. We chose to operate at αDa < 1, so that the affinity region would not be locally saturated (see the section entitled “Brief Review of ITP-AC Trends Predicted by Our Model” in this work). For experiments shown in Figures 3d, 3e, and 3f, as well as those in Figure 5 (shown later in this paper), Da was on the order of 1, and the ITP preconcentration was on the order of 100-fold. We chose not to preconcentrate further, since doing so would not significantly decrease pt* and, therefore, would not improve assay time or column utilization (see the section entitled “Control of Capture Time pt” in Part 1 of this two-paper series6).
Figure 3.
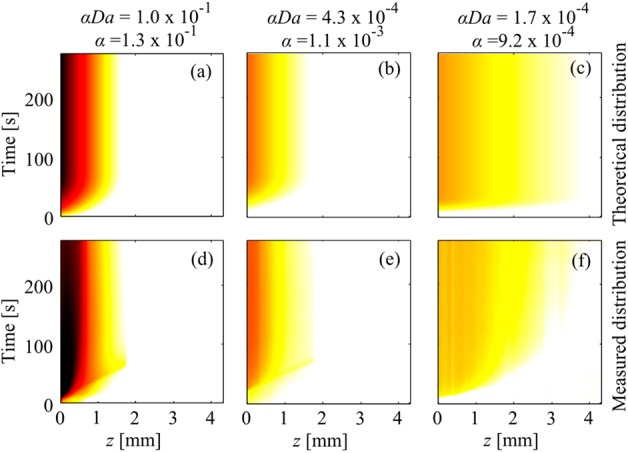
(a, b, c) Predicted and (d, e, f) measured spatiotemporal behavior fluorescently labeled DNA target in ITP-AC inside the affinity region. The spatiotemporal plots show the logarithm of the averaged fluorescence intensity of the target, based on the cross-sectional area, as a function of the axial coordinate (z) and time. Location z = 0 is located at the leading edge of the PPM affinity region (see Figure 2a). Panels a, b, and c show theoretically predicted captured target distributions for αDa = 1.0 × 10⁻¹ and α = 1.3 × 10⁻¹, αDa = 4.3 × 10⁻⁴ and α = 1.1 × 10⁻³, and αDa = 1.7 × 10⁻⁴ and α = 9.2 × 10⁻⁴, respectively. Panels d, e, and f show experimentally observed captured target distribution for the same respective αDa and α values. The predicted spatiotemporal distribution of the target agreed well with that experimentally observed.
Figure 5.
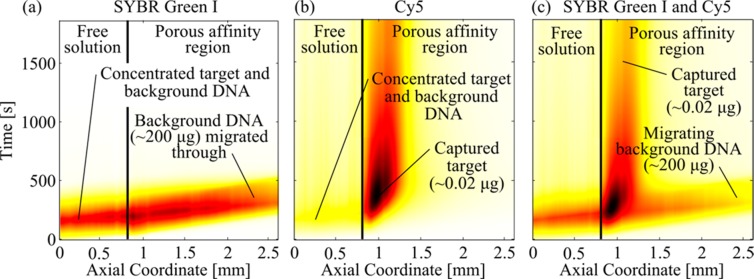
Spatiotemporal plots showing separation of rare target DNA from 10 000-fold more-abundant contaminating DNA using ITP-AC. The plots show the target and contaminant migrating from free solution into the porous polymer. SYBR Green I mostly visualized the highly abundant background contaminant fish sperm DNA and Cy 5 visualized the 25 nt target. (a) Separation observed in the SYBR Green I optical channel showing the migration of fish sperm DNA; fish sperm DNA was not captured by the immobilized probe on the PPM and continued to migrate in ITP (this indicates that there was little nonspecific binding of DNA to PPM). (b) Separation observed in the Cy5 optical channel (the Cy5-labeled, low-abundance target DNA was quickly and selectively captured). (c) Separation observed in overlapped SYBR Green I and Cy5 channels shows separation between the trace target DNA and the 10 000-fold more-abundant contaminating fish sperm DNA.
Overall, our model showed very good qualitative agreement with the experiments for over 3 orders of magnitude of target concentration. Both the predicted shape and the relative magnitude of J-shaped contours for the bound target concentration agreed well with that experimentally observed. For example, in the experiment shown in Figure 3d, the target concentration was larger than that shown in Figures 3e and 3f, so the captured target fluorescence intensity (proportional to n/N) was markedly larger than that shown in Figures 3e and 3f. In the experiment shown in Figure 3f, the capture current was larger than that shown in Figures 3d and 3e, and this resulted in a larger target velocity and, thus, deeper penetration into the PPM than in experiments shown in Figures 3d and 3e. For all three experiments, upon penetrating ∼2.8 advection-reaction length scales into the affinity region, a steady state was reached and the target persisted on the PPM, as expected.
Our model also showed good quantitative agreement with our experiments. For example, for the experiment of Figure 3d, pz = 0.93 mm, and max(n/N) = 7.2 × 10⁻². For the corresponding theoretical prediction shown in Figure 3a, pz = 1.03 mm, and max(n/N) = 8.3 × 10⁻², which is within 11% and 15%, respectively, of the experimentally measured values. For the experiment of Figure 3e, pz = 0.91 mm, and max(n/N) = 5.8 × 10⁻⁴; whereas, for the corresponding prediction shown in Figure 3b, values of pz = 0.97 mm, and max(n/N) = 3.9 × 10⁻⁴ were observed (within 7% and 33% of the measured values, respectively). Lastly, for the experiment of Figure 3f, pz = 2.8 mm and max(n/N) = 2.7 × 10⁻⁴; and the corresponding theoretical prediction shown in Figure 3c is pz = 2.5 mm, and max(n/N) = 1.6 × 10⁻⁴, which are within 11% and 41%, respectively, of experimentally measured values.
We attribute slight distortions in the J-shaped profiles in Figures 3d and 3e to small amounts of impurity present with the target that were not captured by the affinity probes. We attribute the difference in early time slopes of the contours of Figures 3c and 3f to a difference in target velocity between our model and the experiment. Our model assumes a constant velocity of the target, resulting in linear low-angle contours at early times of t in Figure 3c. In our experiments, we observed that the target slowed down, which is reflected in the fluorescence slope of Figure 3f. One possible cause for this is the interactions of the target with the immobilized probes.
We attribute the small discrepancies in pz and max(n/N) between theoretical predictions (Figures 3a, 3b, and 3c) and experimental observations (Figures 3d, 3e, and 3f) to small inhomogeneities in the PPM, resulting in slightly nonhomogeneous immobilized probe distribution. We hypothesize that this inhomogeneity was caused by air trapped in some of the pores. This air was likely trapped with a slightly different, random, distribution for each experiment. This trapped air blocked access to the immobilized probes, causing effective inhomogeneity in probe distribution. This hypothesis is supported by our observations that the PPM material was somewhat hydrophilic, and thus trapped the less-wetting phase (air) inside the pores.
Effect of α and Da on the Scaled Capture Length
To validate our predictions for scaled capture length (pz*), we measured pz for 18 ITP-AC experiments (6 experimental conditions), varying the αDa values from 10–4 to 10–1. We varied αDa by varying both the target concentration in the TE well (100 pM to 10 nM) and the capture current (200 μA to 600 μA). We stayed within a regime of αDa < 1 in our experiments, so that the affinity capture region would not be locally saturated. To calculate pz*, we obtained u, pz, N, and k1, as described in the section entitled “Measurement of ITP-AC Parameters”. We plot the measured pz* and the theoretically predicted pz* curves, as a function of αDa in Figure 4a.
Figure 4.

Predicted and experimentally observed (a) scaled capture length and (b) maximum capture efficiency, each as a function of the total scaled target amount (αDa). CS is the target concentration in the TE, and Icap is the capture current in the ITP-AC experiment. The scaled capture length is invariant of αDa for αDa < 1 and equals ∼2.8. For αDa > 1, the affinity region is locally saturated and scaled capture length increases linearly with αDa. The maximum capture efficiency increases linearly with αDa for αDa < 1. For αDa > 1, the affinity region is locally saturated and max(n/N) approaches unity.
Figure 4a shows a successful collapse of our pz* data over 4 orders of magnitude of αDa (from 10–4 to 10–1). This confirms our prediction that pz* is approximately constant for this most relevant range of αDa. We attribute small column-to-column variations in pz* to small, irreproducible inhomogeneities in the PPM.
Effect of α and Da on Capture Efficiency
We validated our theoretical predictions for maximum capture efficiency max(n/N) with measurements of max(n/N) for 18 ITP-AC experiments varying αDa from 10–4 to 10–1, as with the section entitled “Effect of α and Da on the Scaled Capture Length” in this paper. We again maintained αDa < 1, so that the affinity capture region would not be saturated. As Peterson et al. showed, local saturation of an affinity region with high DNA probe density is not always experimentally possible, because of electrostatic repulsion of DNA.39
To obtain max(n/N), we measured max(n) from the spatiotemporal data and N from separate calibration experiments (see the section entitled “Measurement of ITP-AC Parameters” in this work). First, we measured the maximum fluorescence intensity of a bound target after a steady state was reached (i.e., the distribution of target was not changing). We then obtained max(n) by interpolating the fluorescence intensity on a Cy5 fluorescence intensity vs DNA concentration calibration curve (see section SI 2 in the Supporting Information). We plot the measured max(n/N) and the theoretically predicted max(n/N) as a function of αDa in Figure 4b.
We observed that the measured values of max(n/N) indicate changes in the value of αDa of more than 4 orders of magnitude and, across all our conditions, successfully collapses the data to a single linear relationship. This agrees very well with the theoretically predicted trend. We attribute the random variations in max(n/N) to experiment-to-experiment variations in inhomogeneity of N due to trapping of air in the PPM.
Sequence Specific Extraction of the Target from a 104× More-Abundant Contaminant
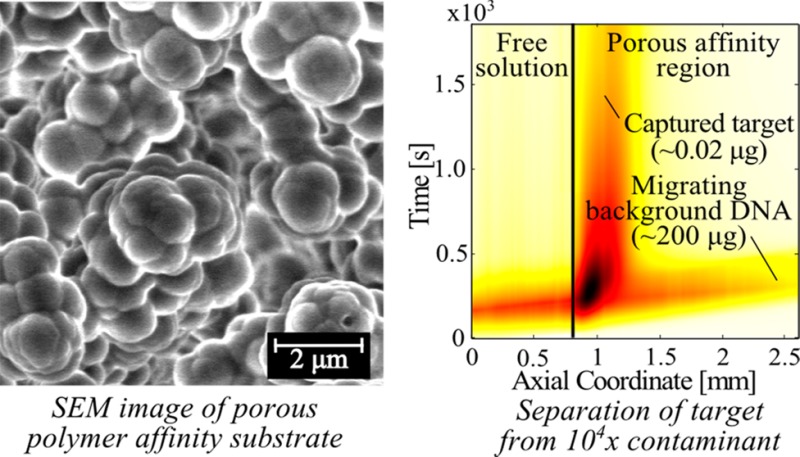
Finally, as a demonstration of ITP-AC, we performed separations of Cy5 labeled 25 nt oligo DNA from 10 000-fold more-abundant genomic fish sperm DNA. For these experiments, we placed into the TE reservoir 0.1 μg mL–1 of Cy5 labeled target DNA (total 0.02 μg) and 1000 μg mL–1 fish sperm DNA (total 200 μg). We included 0.1× SYBR Green I in the mixture, to aid visualization of the total nucleic acids. We performed ITP in galvanostatic mode with a run current of 800 μA and a capture current of 200 μA. We visualized this experiment independently in the SYBR Green I optical channel (visualizing the very-high-abundance fish sperm DNA) and in the Cy5 optical channel (visualizing only the target). Lastly, we performed electrophoresis analysis of the eluate, providing an independent verification of the purification (see section SI 8 in the Supporting Information).
Figure 5 summarizes our demonstration of selective capture. Figure 5a shows the spatiotemporal plot of observed fluorescence from the experiment in the SYBR Green I channel. The fish sperm DNA migrated in ITP from free solution into the PPM and continued to migrate in ITP. This shows that background DNA was not captured by the immobilized probe of the PPM, showing little nonspecific binding of DNA to the GMA-EDMA PPM. We attribute the slight decrease in ITP velocity of fish sperm DNA to the effects of EOF on ITP.
In Figure 5b, we show the spatiotemporal plot of observed fluorescence from the experiment in the Cy5 channel. The Cy5-labeled target migrated in ITP from free solution into the PPM and was quickly captured by the immobilized probe on the PPM. The presence of 10 000-fold more-abundant contaminating DNA did not interfere with capture of the target. We attribute the decrease in Cy5 fluorescence over time (which becomes prominent in Figure 5b after 1000 s) to photobleaching of Cy5.
In Figure 5c, we show the spatiotemporal plot of observed fluorescence from the experiment in both the SYBR Green I and Cy5 channels. Figure 5c clearly shows how target species attain zero velocity in a time of pt, while the contaminant species (fish sperm DNA) continues to migrate at ITP velocity. This allows for superior separation, as the target and contaminant are spatially confined to two distinct, nondiffusing regions.6 The resolution of ITP-AC increases proportionally to time. For this experiment, μL in LE ≈ −60 × 10–9 m2V–1s–1, μT in LE ≈ −20 × 10–9 m2 V–1 s–1, k1 = 103 M–1 s–1, N ≈ 30 μM, and pz* ≈ 2.8. Hence, u95, the target velocity needed to achieve 95% maximum resolution with ITP-AC was ∼0.01 mm s–1 (see the Supporting Information of Part 1 of this two-part series6 for a discussion of u95). In this experiment, the target velocity was ∼0.05 mm/s; therefore, we achieved >95% of the maximum resolution. In this experiment, we separated the target from fish sperm DNA in a length of PPM of <1 mm and within <10 min.
Conclusions
We presented an experimental demonstration of ITP-AC with Cy5 labeled synthetic DNA target and synthetic DNA probe immobilized onto an ∼2-μm-pore-diameter porous polymer monolith (PPM) inside a 500-μm glass capillary. We provided detailed protocol for ITP-AC and discussed the choice of buffers to perform sequence-specific separation of nucleic acids. We described our choice of the porous polymer monolith affinity substrate, poly(glycidyl methacrylate-co-ethylene dimethacrylate). This substrate was nonsieving and exhibited no nonspecific binding. Therefore, it allowed for specific separation of large macromolecules. We described the synthesis of GMA-EDMA PPM and the functionalization of the PPM with DNA probes.
We performed ITP-AC experiments with 25 nt DNA target and compared these with our model presented in the first part of this two-paper series.6 For these experiments, we used epifluorescence imaging to track the Cy5 labeled target as it traveled and reacted within the affinity region. The predicted spatiotemporal dynamics of ITP-AC agreed very well with that measured experimentally. By varying target concentration and ITP velocity, we explored capture length and capture efficiency for over 4 orders of magnitude of scaled target amount αDa (from 10–4 to 10–1). The predicted scaled capture length and maximum capture efficiency agreed very well with experimentally measured values for the entire range explored. Lastly, using our technique, we demonstrated sequence-specific purification of 25 nt target DNA from 200 μL of sample and demonstrated that the resolution in ITP-AC increases linearly with time. In this experiment, we successfully purified 25 nt target DNA from 10 000-fold more-abundant background (contaminating) genomic fish sperm DNA in a column length of <1 mm and within <500 s.
Acknowledgments
We gratefully acknowledge support from the National Institutes of Health Progenitor Cell Biology Consortium (No. 5U01HL099997, Subcontract No. SR00002307). We also gratefully acknowledge support from the National Science Foundation under contract number CBET-1159092 and for a Graduate Research Fellowship for Viktor Shkolnikov. We thank Michael Barako for help with obtaining SEM images of the PPM.
Supporting Information Available
This material is available free of charge via the Internet at http://pubs.acs.org.
The authors declare no competing financial interest.
Funding Statement
National Institutes of Health, United States
Supplementary Material
References
- Hage D. S.Handbook of Affinity Chriomatography; CRC Press: Boca Raton, FL, 2006. [Google Scholar]
- Hage D. S. Clin. Chem. 1999, 45, 593–615. [PubMed] [Google Scholar]
- Mallik R.; Hage D. S. J. Sep. Sci. 2006, 29, 1686–1704. [DOI] [PubMed] [Google Scholar]
- Pfaunmiller E. L.; Paulemond M. L.; Dupper C. M.; Hage D. S. Anal. Bioanal. Chem. 2013, 405, 2133–2145. [DOI] [PMC free article] [PubMed] [Google Scholar]
- Levenspiel O.Chemical Reaction Engineering, 3rd Edition; John Wiley & Sons: New York, 1999. [Google Scholar]
- Shkolnikov V.; Santiago J. G.. Anal. Chem. 2014, DOI: 10.1021/ac5011052. [DOI] [Google Scholar]
- Abelev G.; Karamova É.; Yazova A.; Gusev A. Bull. Exp. Biol. Med. 1988, 106, 1600–1604. [Google Scholar]
- Abelev G.; Karamova E.; Yazova A.; Gussev A. Mol. Immunol. 1989, 26, 49–52. [DOI] [PubMed] [Google Scholar]
- Abelev G.; Karamova E. Mol. Immunol. 1989, 26, 41–47. [DOI] [PubMed] [Google Scholar]
- Abelev G.; Karamova É. Bull. Exp. Biol. Med. 1988, 105, 748–751. [Google Scholar]
- Schranz D.; Morkowski S.; Karamova E. R.; Abelev G. I. Electrophoresis 1991, 12, 414–419. [DOI] [PubMed] [Google Scholar]
- Abelev G. I.; Karamova E. R. In Serological Cancer Markers; Springer: Heidelberg, Berlin, 1992; pp 453–471. [Google Scholar]
- Abelev G.; Karamova E.; Lazarevich N.; Kiseleva V.; Poverennyĭ A. Mol. Biol. (Mosk). 1994, 28, 768. [PubMed] [Google Scholar]
- Garcia-Schwarz G.; Santiago J. G. Anal. Chem. 2012, 84, 6366–6369. [DOI] [PubMed] [Google Scholar]
- Garcia-Schwarz G.; Santiago J. G. Angew. Chem. 2013, 125, 11748–11751. [Google Scholar]
- Karsenty M.; Rubin S.; Bercovici M. Anal. Chem. 2014, 86, 3028–3036. [DOI] [PubMed] [Google Scholar]
- Han C. M.; Katilius E.; Santiago J. G. Lab on a Chip 2014, 10.1039/c4lc00374h. [DOI] [PubMed] [Google Scholar]
- Pushpendra S.; Arvind P.; Anil B. In Nucleic Acids Sequences to Molecular Medicine; Springer, 2012; pp 19–45. [Google Scholar]
- Haasnoot J.; Berkhout B. In Antiviral Strategies; Springer: Berlin, 2009; pp 243–263. [Google Scholar]
- Opalinska J. B.; Gewirtz A. M. Nat. Rev. Drug Discovery 2002, 1, 503–514. [DOI] [PubMed] [Google Scholar]
- Schwarzenbach H.; Hoon D. S.; Pantel K. Nat. Rev. Cancer 2011, 11, 426–437. [DOI] [PubMed] [Google Scholar]
- Wilson I. G. Appl. Environ. Microbiol. 1997, 63, 3741. [DOI] [PMC free article] [PubMed] [Google Scholar]
- Boom R.; Sol C.; Salimans M.; Jansen C.; Wertheim-van Dillen P.; Van der Noordaa J. J. Clin. Microbiol. 1990, 28, 495–503. [DOI] [PMC free article] [PubMed] [Google Scholar]
- Bodi K.; Perera A.; Adams P.; Bintzler D.; Dewar K.; Grove D.; Kieleczawa J.; Lyons R.; Neubert T.; Noll A. J. Biomol. Techn.: JBT 2013, 24, 73. [DOI] [PMC free article] [PubMed] [Google Scholar]
- Mamanova L.; Coffey A. J.; Scott C. E.; Kozarewa I.; Turner E. H.; Kumar A.; Howard E.; Shendure J.; Turner D. J. Nat. Methods 2010, 7, 111–118. [DOI] [PubMed] [Google Scholar]
- West J. A.; Satterfield B. C. In Microchip-Based Assay Systems; Springer: Heidelberg, Berlin, 2007; pp 9–21. [Google Scholar]
- Ma J.; Zhang L.; Liang Z.; Zhang W.; Zhang Y. J. Sep. Sci. 2007, 30, 3050–3059. [DOI] [PubMed] [Google Scholar]
- Sinitsyna E. S.; Walter J. G.; Vlakh E. G.; Stahl F.; Kasper C.; Tennikova T. B. Talanta 2012, 93, 139–146. [DOI] [PubMed] [Google Scholar]
- Křvenková J.; Bilková Z.; Foret F. J. Sep. Sci. 2005, 28, 1675–1684. [DOI] [PubMed] [Google Scholar]
- Shkolnikov V.; Strickland D. G.; Fenning D. P.; Santiago J. G. Sens. Actuators B 2010, 150, 556–563. [Google Scholar]
- Shkolnikov V.; Santiago J. G. Lab Chip 2013, 13, 1632–1643. [DOI] [PubMed] [Google Scholar]
- Persat A.; Marshall L. A.; Santiago J. G. Anal. Chem. 2009, 81, 9507–9511. [DOI] [PubMed] [Google Scholar]
- Edman C. F.; Raymond D. E.; Wu D. J.; Tu E.; Sosnowski R. G.; Butler W. F.; Nerenberg M.; Heller M. J. Nucleic Acids Res. 1997, 25, 4907–4914. [DOI] [PMC free article] [PubMed] [Google Scholar]
- Wetmur J. G. Annu. Rev. Biophys. Bioeng. 1976, 5, 337–361. [DOI] [PubMed] [Google Scholar]
- Gao Y.; Wolf L. K.; Georgiadis R. M. Nucleic Acids Res. 2006, 34, 3370–3377. [DOI] [PMC free article] [PubMed] [Google Scholar]
- MacInnes D. A.; Longsworth L. G. Chem. Rev. 1932, 9, 171–230. [Google Scholar]
- Shkolnikov V.; Bahga S. S.; Santiago J. G. Phys. Chem. Chem. Phys. 2012, 14, 11534–11545. [DOI] [PubMed] [Google Scholar]
- Garcia-Schwarz G.; Bercovici M.; Marshall L. A.; Santiago J. G. J. Fluid Mech. 2011, 679, 455–475. [Google Scholar]
- Bhattacharyya S.; Gopmandal P. P.; Baier T.; Hardt S. Phys. Fluids 2013, 25, 022001. [Google Scholar]
- Peterson A. W.; Heaton R. J.; Georgiadis R. M. Nucleic Acids Res. 2001, 29, 5163–5168. [DOI] [PMC free article] [PubMed] [Google Scholar]
Associated Data
This section collects any data citations, data availability statements, or supplementary materials included in this article.