Abstract
♦ Background: Previous studies have demonstrated that increased body mass index (BMI) is associated with decreased mortality in hemodialysis (HD) patients. However, the association between BMI and survival has not been well established in patients undergoing peritoneal dialysis (PD). The aim of the study was to determine the association between BMI and mortality in the PD population using the Clinical Research Center (CRC) registry for end-stage renal disease (ESRD) cohort in Korea.
♦ Methods: Prevalent patients with PD were selected from the CRC registry for ESRD, a prospective cohort study on dialysis patients in Korea. Patients were categorized into four groups by quartiles of BMI. Cox regression analysis was used to calculate the adjusted hazard ratio (HR) of mortality with a BMI of quartile 2 (21.4 - 23.5 kg/m2) as the reference.
♦ Results: A total of 900 prevalent patients undergoing PD were included. The median follow-up period was 24 months. The multivariate Cox proportional hazard model showed that the lowest quartile of BMI was associated with higher mortality (HR 3.00, 95% confidence interval (CI), 1.26 - 7.15). However, the higher quartiles of BMI were not associated with mortality compared with the reference category of BMI quartile 2 (Quartile 3: HR 1.11, 95% CI, 0.43 - 2.85, Quartile 4: HR 1.64, 95% CI, 0.66 - 4.06) after adjustment for clinical variables.
♦ Conclusions: Lower BMI was a significant risk factor for death, but increased BMI was not associated with mortality in Korean PD patients.
Keywords: Body mass index, mortality, peritoneal dialysis
Obesity is known to be an established risk factor for increased morbidity and mortality in the general population (1,2). However, the relationship between body mass index (BMI) and mortality varies according to the comorbid illness (2). In hemodialysis (HD) patients, previous studies have demonstrated that increased BMI is associated with decreased mortality, which is the opposite of that found in the general population (3-5).
In patients undergoing peritoneal dialysis (PD), the association between BMI and mortality is still controversial. Some studies have demonstrated that higher BMI was associated with lower risk for death (6-9), whereas other studies have demonstrated increased mortality in patients with obesity (10,11) or equivalent mortality in patients with obesity compared with those with normal BMI (12-15). This discrepancy may be due to the differences in the study designs or the populations of the studies. The aim of the present study was to determine the association between BMI and mortality in the PD population in the Clinical Research Center (CRC) registry for end-stage renal disease (ESRD) cohort in Korea.
Methods
Study Poppulations
All patients in this study participated in the CRC for ESRD. This is an ongoing observational prospective cohort study in patients with ESRD from 31 centers in Korea. The cohort started in April 2009 and included adult (> 18 years old) chronic dialysis patients. Demographic data and clinical data were collected at enrollment. Assessment of dialysis characteristics and measurements of health were done every 6 months until the end of the follow-up. Dates and causes of mortality were immediately reported through the follow-up period. The CRC for ESRD was approved by the medical ethics committees of the participating hospitals and informed consent was obtained from all patients before inclusion.
Data Collection
In the CRC for ESRD study, baseline demographic data and clinical data including age, sex, BMI, causes of ESRD, comorbidity, laboratory investigations, nutritional status and therapeutic characteristics were recorded. The causes of ESRD as primary kidney diseases were classified according to the ninth revision of the International Classification of Diseases, clinical modification codes (ICD-9-CM). Serum cholesterol, serum albumin, creatinine, and urea were determined from blood samples. Serum albumin levels were measured by colorimetric assay using Bromcresol Green method For the assessment of comorbity, Davies comorbidity score and Modified Charlson comorbidity score were used (16-18). According to Davies comorbidity score, the low-risk group had a score of zero, the moderate-risk group a score of 1-2, and the high-risk group a score of ≥ 3 (16,17). The modified Charlson comorbidity index combines information from 14 medical conditions designed to predict 1-year mortality among patients with ESRD (18).
BMI was calculated as weight (kg)/height (m2). Body weight was measured without intraperitoneal dialysate. Body mass index values were categorized according to quartile groups, as follows: Quartile 1, BMI < 21.4 kg/m2; Quartile 2, BMI = 21.4 - 23.5 kg/m2; Quartile 3, BMI = 23.5 - 25.4 kg/m2 and Quartile 4, BMI > 25.4 kg/m2. The primary outcome was mortality. Follow-up of the patients was censored at the time of death, kidney transplantation, patient withdrawal or transfer to a nonparticipating hospital.
Statistical Analysis
Data with continuous variables and normal distribution are presented as mean ± SD and those without normal distribution are presented as the median with ranges as appropriate for the type of variable. Student t-test, Mann-Whitney test, One-way ANOVA test or Kruskal-Wallis test were used, as appropriate, to determine the differences in continuous variables. Categorical variables are presented as percentages. Pearson’s chi-square test or Fisher’s exact test were used to determine the differences in categorical variables. Absolute mortality rates were calculated per 100-person-year of follow-up. Survival curves were estimated by the Kaplan-Meier method and compared by the log-rank test according to the BMI categories. A Cox proportional hazard regression model was used to calculate hazard ratio (HR) with 95% confidence interval (CI) for all-cause mortality, using a BMI of quartile 2 (21.4 - 23.5 kg/m2) as the reference. Analyses were adjusted for potential confounders: age, gender, diabetes mellitus and comorbidity score. A value of p < 0.05 was considered statistically significant. Statistical analyses were performed using SPSS 11.5 software (Chicago, IL, USA).
Results
Patient Characteristics
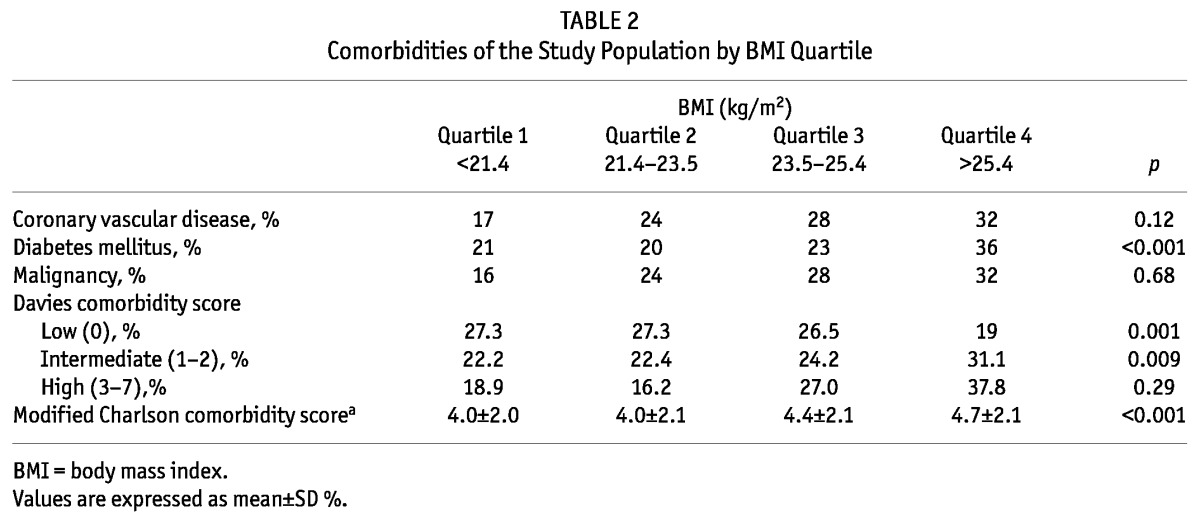
Until February 2012, 2,743 prevalent patients undergoing dialysis were included in this cohort and 1,084 of these were prevalent PD patients. Of the 1,084 prevalent PD patients, 184 patients whose BMI could not be ascertained at enrollment were excluded for the present analyses. Thus 900 prevalent PD patients were included in the present analysis. The mean age of patients was 56 ± 12 years and the mean BMI was 23.6 ± 3.2 kg/m2. Figure 1 shows the distribution of patients according to BMI. The main causes of ESRD were diabetes (32%), renal vascular disease (25%) and glomerulonephritis (18%). Table 1 shows the baseline characteristics of the study population by BMI quartile. The mean BMI value ranged from 19.8 ± 1.3 kg/m2 for patients in the lowest BMI quartile to 27.7 ± 3.2 kg/m2 for patients in the highest BMI quartile. In general, patients in the higher BMI quartile were older and had more males than those in the lower BMI quartile. The use of automated peritoneal dialysis was not significantly different among the BMI categories. Diabetes as a cause of ESRD was more common in the highest BMI quartile, while glomerulonephritis as a cause of ESRD was more common in the lower BMI quartile. There was no difference in systolic and diastolic blood pressure, hemoglobin level, serum albumin level, serum total cholesterol level and subjective global assessment of nutritional status (SGA) among the BMI categories. Table 2 shows the prevalence of the comorbidities of the study population by BMI quartile. Diabetes was more prevalent in the highest BMI quartile. In the Davies comorbidity score, low risk was more prevalent in lower BMI quartiles and intermediate risk was more prevalent in higher BMI quartiles. The prevalence of high risk was not significantly different among the BMI categories. The modified Charlson comorbidity score was higher in the highest BMI quartile.
Figure 1 —
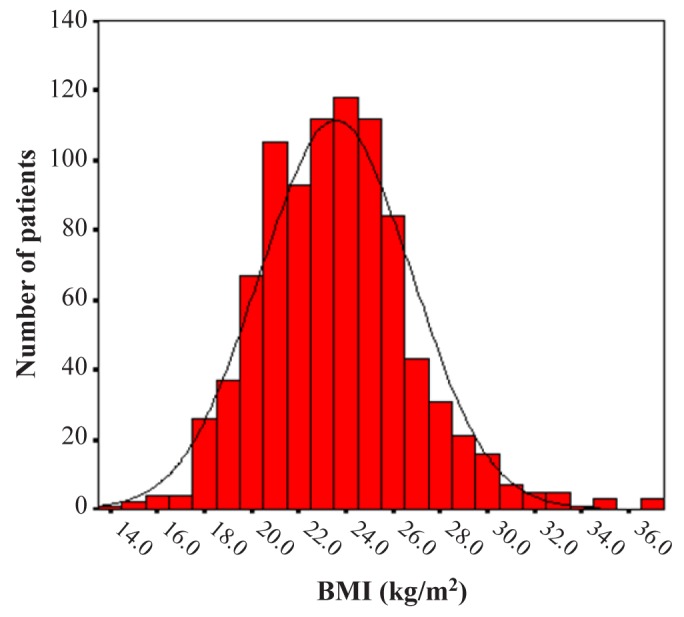
The distribution of study population according to body mass index (BMI).
TABLE 1.
Baseline Characteristics of the Study Population by BMI Quartile
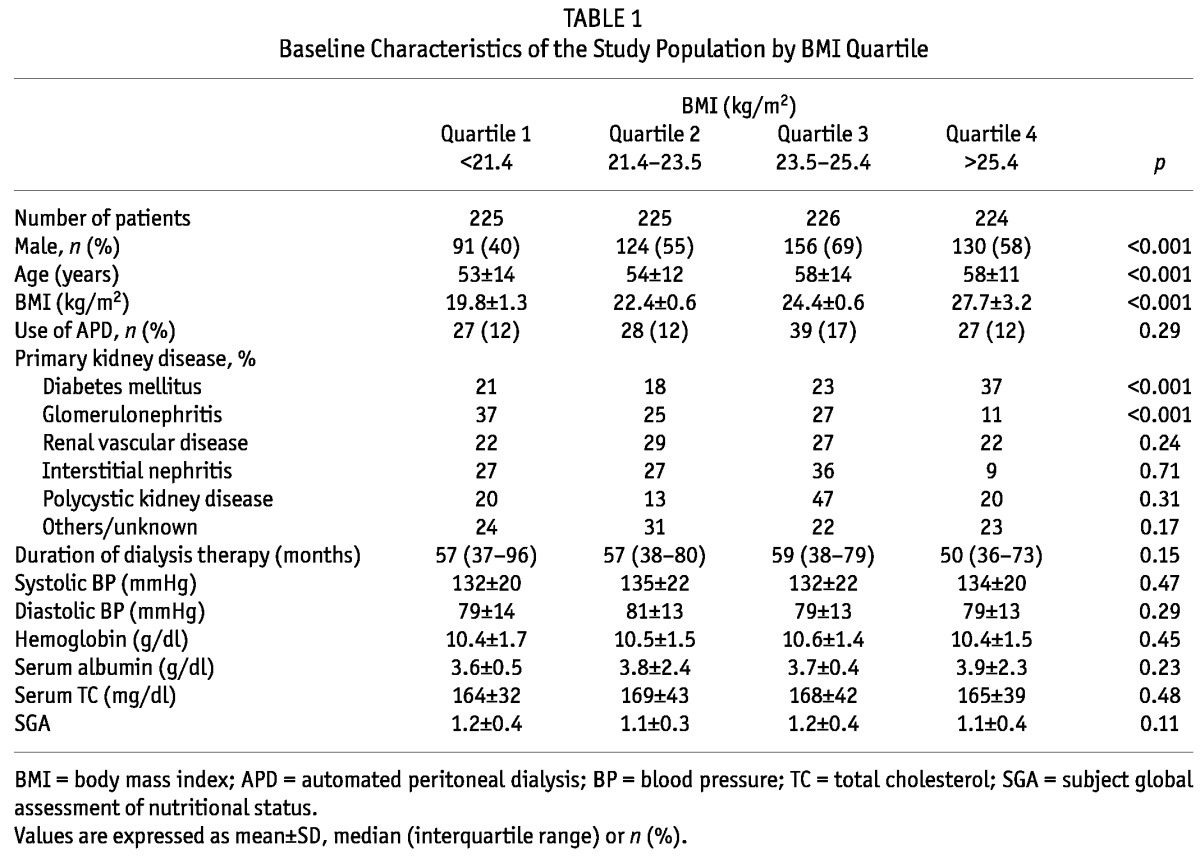
TABLE 2.
Comorbidities of the Study Population by BMI Quartile
Relationship of BMI to Mortality
The median follow-up period was 24 months (interquartile range, 14 - 27 months). During the follow-up period, 64 patients left the study. The reasons for censoring included kidney transplantation (n = 35), transfer to a nonparticipating hospital (n = 13), refusal of further participation (n = 8) or other (n = 8). Table 3 shows the number of kidney transplants and modality change from PD to HD of the study population by BMI quartile during the follow-up period. Kidney transplant rates or modality change rates from PD to HD were not significantly different among the BMI quartiles. There were 63 deaths during the follow-up period. The leading causes of death were infectious diseases including peritonitis (43% of all deaths) and cardiovascular diseases (30% of all deaths). Table 4 shows the causes of death in each BMI category. The absolute mortality rate during the median follow-up period of 24 months was 4.0 deaths per 100 person-years. Figure 2 shows the Kaplan-Meier plot of patient survival by BMI quartile. As shown, survival was lower in patients in the lowest BMI quartile compared to those in higher BMI quartiles (p = 0.018, log-rank test). Survival in second, third and fourth quartiles of BMI was equivalent. Table 5 shows the crude and adjusted HR for mortality during PD treatment according to BMI categories, using BMI quartile 2 as the reference category. The crude HR for mortality of BMI quartile 1 was 2.86 (95% CI, 1.33 - 6.12, p = 0.007) and the adjusted HR was 3.00 (95% CI, 1.26 - 7.15, p = 0.01) after multivariate adjustment for age, gender, diabetes and Davies comorbidity score, implying that the lowest BMI quartile is a 3-fold strong risk factor compared to the reference category of BMI quartile 2 after adjustment for clinical variables. The crude HR for mortality of BMI quartile 3 and 4 was 1.32 (95% CI, 0.56 - 3.14, p = 0.53) and 1.99 (95% CI, 0.89 - 4.46, p = 0.10), respectively. The adjusted HR for mortality of BMI quartile 3 and 4 was 1.11 (95% CI, 0.43 - 2.85, p = 0.83) and 1.64 (95% CI, 0.66 - 4.06, p = 0.28) respectively, after adjustment for age, gender, diabetes and Davies comorbidity score; implying that higher BMI quartiles had no impact on survival compared to the reference category of BMI quartile 2 after adjustment for clinical variables.
TABLE 3.
Kidney Transplants and Modality Change from PD to HD of the Study Population by BMI Quartile During the Follow-Up Period

TABLE 4.
Causes of Death in Each BMI Category
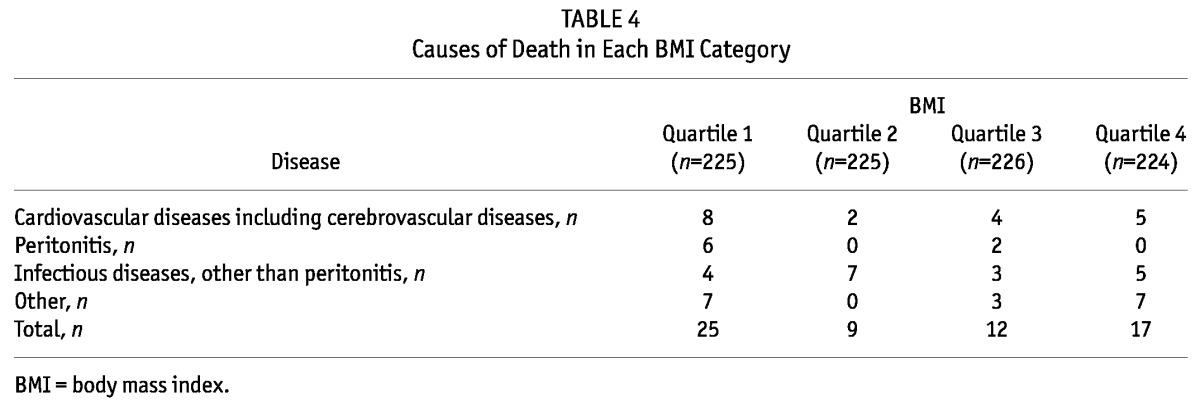
Figure 2 —
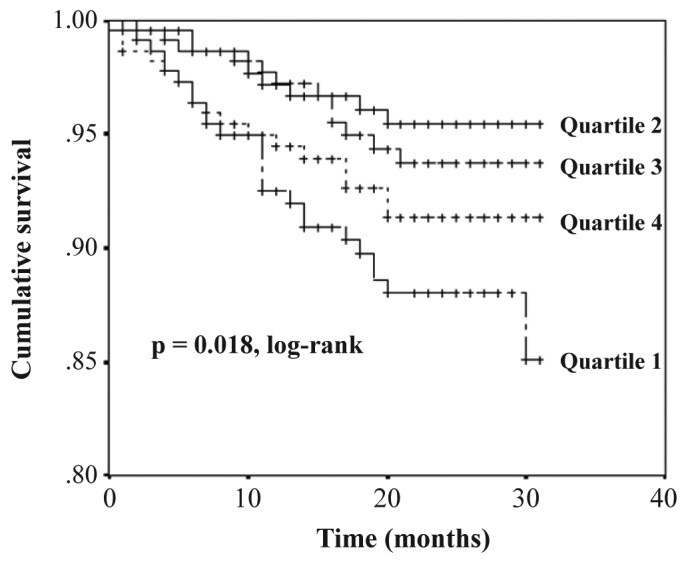
Kaplan-Meier plot of patient survival by body mass index quartile.
TABLE 5.
Hazard Ratios for Mortality during PD Treatment According to BMI Category

Discussion
In this multicenter prospective observational study of the association between BMI and mortality in Korean patients undergoing PD treatment, we found that higher BMI groups were not associated with increased mortality compared to the reference category of BMI quartile 2, while the lowest BMI group was independently associated with increased mortality.
Our findings are consistent with some of the previous large studies for the association between BMI and mortality in patients with PD treatment (12-14). Abbott et al. reported in their retrospective large cohort study (the USRDS Dialysis Morbidity and Mortality Wave Study) that PD patients with the three highest quartiles of BMI had virtually identical mortality and PD patients with the lowest quartiles of BMI had lower survival over time compared to other categories of BMI (12). On the other hand, our findings are in contrast to some of the previous studies, which demonstrated either beneficial or worse effects of obesity (6,11). Snyder et al. reported in their retrospective large cohort study of the USRDS population that PD patients who were overweight or obese had longer survival than those with lower BMI (7). McDonald et al. reported in their large retrospective cohort study of the Australia and New Zealand Dialysis and Transplantation Registry that obesity was independently associated with increased mortality in patients undergoing PD treatment (10). The discrepancy between the findings of the previous observational studies may be due to the differences of the study designs or the populations of the studies. Our findings support the evidence that obesity has equivalent survival to PD patients.
An interesting point of this study is that study populations are Asian patients with PD treatment. Asian populations have different association between BMI, percent of body fat, and health risk than Western populations (19-21). Asian populations have a higher percentage of body fat for a given BMI than Western populations (22). Moreover, the prevalence of type 2 diabetes mellitus and cardiovascular risk factors are increased in parts of Asia even below the BMI cut-off point of 25 kg/m2, a value defined as being overweight by the current World Health Organization (WHO) classification (19,20). Thus, the WHO Expert Consultation recommended that BMI cut-off values in the definition of overweight and obesity should be lower for Asian populations than those for Western populations (19).
Previous studies on the association between BMI and mortality in PD patients have been conducted primarily in Western populations. Compared to previous studies, the distribution of our study population according to BMI was different from that of Western populations. The mean BMI of our study (23.6 kg/m2) was lower than that of previous studies with the Western patients undergoing PD treatment (mean BMI of 24.6 - 26.4 kg/m2) (11-14). The number of patients with obesity defined by the WHO classification (BMI ≥ 30 kg/m2) was 34 (3.8%), which is lower than the percentage of patients with obesity in Western PD patients (10 - 22%) (11-14). It seems that the WHO classification of BMI may not be appropriate for our study population. Therefore, we analyzed the impact of BMI for survival in our study populations by categorizing the study population by BMI quartile rather than by the WHO classification of BMI. Our results showed that BMI has a significant impact on survival when the study populations were categorized by BMI quartile rather than by the WHO classification of BMI, suggesting that the association between BMI and clinical outcomes may be identified along the continuum of BMI in Asian PD patients rather than the BMI cut-off point (19,21).
An important point of our study is that we recorded information on the severity of comorbidities, which may be a confounder in the analysis of the association between BMI and mortality. The prevalence of diabetes mellitus and comorbidity scores such as the Davies comorbidity score and the modified Charlson comorbidity score were higher in higher BMI groups than those in lower BMI groups in our study. These findings are similar to those in general populations (23). After adjustment for the severity of comorbidities, the relationship between obesity and mortality was slightly attenuated but still persisted. This finding indicates that obesity may have an impact on mortality by some mechanisms that are independent of the severity of comorbidities in PD patients.
Our study has some limitations. First, our study included the prevalent PD patients, thus it is not free form survivor bias, especially selection bias (24). Second, the median follow-up period of 24 months was relatively short. Third, the factors (peritoneal solute transport rate, type of solution or adequacy) which are known to affect BMI and mortality were not included in this study (25-27). Fourth, we used BMI only as a parameter of obesity. Other measurements such as the waist-to-hip ratio or waist circumference may be needed. In spite of these limitations, the results of our study clearly demonstrate the association between BMI and mortality in Korean PD patients.
In conclusion, low BMI was found to be a significant risk factor for death in Korean PD patients. However, increased BMI was not associated with mortality in Korean PD patients.
Disclosures
The authors have no financial conflict of interest to declare.
Acknowledgments
This work was supported by a grant of the Korea Healthcare Technology R&D Project, Ministry of Health and Welfare, Republic of Korea (HI10C2020). We thank the study coordinators Hye Young Lim, Nam Hee Kim, Mi Joung Moon, Hwa Young Lee, Mi Joung Kwon, Su Yeon An, Su Joung Oh and Hye Young Kwak for their contribution to this study.
References
- 1. Byers T. Body weight and mortality. N Engl J Med 1995; 333:723–4 [DOI] [PubMed] [Google Scholar]
- 2. Calle EE, Thun MJ, Petrelli JM, Rodriguez C, Heath CW., Jr Body-mass index and mortality in a prospective cohort of U.S. adults. N Engl J Med 1999; 341:1097–105 [DOI] [PubMed] [Google Scholar]
- 3. Salahudeen AK. Obesity and survival on dialysis. Am J Kidney Dis 2003; 41:925–32 [DOI] [PubMed] [Google Scholar]
- 4. Kalantar-Zadeh K, Abbott KC, Salahudeen AK, Kilpatrick RD, Horwich TB. Survival advantages of obesity in dialysis patients. Am J Clin Nutr 2005; 81:543–54 [DOI] [PubMed] [Google Scholar]
- 5. Kopple JD, Zhu X, Lew NL, Lowrie EG. Body weight-for-height relationships predict mortality in maintenance hemodialysis patients. Kidney Int 1999; 56:1136–48 [DOI] [PubMed] [Google Scholar]
- 6. Johnson DW, Herzig KA, Purdie DM, Chang W, Brown AM, Rigby RJ, et al. Is obesity a favorable prognostic factor in peritoneal dialysis patients? Perit Dial Int 2000; 20:715–21 [PubMed] [Google Scholar]
- 7. Snyder JJ, Foley RN, Gilbertson DT, Vonesh EF, Collins AJ. Body size and outcomes on peritoneal dialysis in the United States. Kidney Int 2003; 64:1838–44 [DOI] [PubMed] [Google Scholar]
- 8. Mehrotra R, Chiu YW, Kalantar-Zadeh K, Vonesh E. The outcomes of continuous ambulatory and automated peritoneal dialysis are similar. Kidney Int 2009; 76:97–107 [DOI] [PubMed] [Google Scholar]
- 9. Ramkumar N, Pappas LM, Beddhu S. Effect of body size and body composition on survival in peritoneal dialysis patients. Perit Dial Int 2005; 25:461–9 [PubMed] [Google Scholar]
- 10. McDonald SP, Collins JF, Johnson DW. Obesity is associated with worse peritoneal dialysis outcomes in the Australia and New Zealand patient populations. J Am Soc Nephrol 2003; 14:2894–901 [DOI] [PubMed] [Google Scholar]
- 11. Hoogeveen EK, Halbesma N, Rothman KJ, Stijnen T, van Dijk S, Dekker FW, et al. Obesity and mortality risk among younger dialysis patients. Clin J Am Soc Nephrol 2012; 7:280–8 [DOI] [PMC free article] [PubMed] [Google Scholar]
- 12. Abbott KC, Glanton CW, Trespalacios FC, Oliver DK, Ortiz MI, Agodoa LY, et al. Body mass index, dialysis modality, and survival: analysis of the United States Renal Data System Dialysis Morbidity and Mortality Wave II Study. Kidney Int 2004; 65:597–605 [DOI] [PubMed] [Google Scholar]
- 13. Stack AG, Murthy BV, Molony DA. Survival differences between peritoneal dialysis and hemodialysis among “large” ESRD patients in the United States. Kidney Int 2004; 65:2398–408 [DOI] [PubMed] [Google Scholar]
- 14. de Mutsert R, Grootendorst DC, Boeschoten EW, Dekker FW, Krediet RT. Is obesity associated with a survival advantage in patients starting peritoneal dialysis? Contrib Nephrol 2009; 163:124–31 [DOI] [PubMed] [Google Scholar]
- 15. Aslam N, Bernardini J, Fried L, Piraino B. Large body mass index does not predict short-term survival in peritoneal dialysis patients. Perit Dial Int 2002; 22:191–6 [PubMed] [Google Scholar]
- 16. Davies SJ, Russell L, Bryan J, Phillips L, Russell GI. Comorbidity, urea kinetics, and appetite in continuous ambulatory peritoneal dialysis patients: their interrelationship and prediction of survival. Am J Kidney Dis 1995; 26:353–61 [DOI] [PubMed] [Google Scholar]
- 17. Davies SJ, Phillips L, Naish PF, Russell GI. Quantifying comorbidity in peritoneal dialysis patients and its relationship to other predictors of survival. Nephrol Dial Transplant 2002; 17:1085–92 [DOI] [PubMed] [Google Scholar]
- 18. Hemmelgarn BR, Manns BJ, Quan H, Ghali WA. Adapting the Charlson Comorbidity Index for use in patients with ESRD. Am J Kidney Dis 2003; 42:125–32 [DOI] [PubMed] [Google Scholar]
- 19. WHO Expert Consultation. Appropriate body-mass index for Asian populations and its implications for policy and intervention strategies. Lancet 2004; 363:157–63 [DOI] [PubMed] [Google Scholar]
- 20. Wen CP, David Cheng TY, Tsai SP, Chan HT, Hsu HL, Hsu CC, et al. Are Asians at greater mortality risks for being overweight than Caucasians? Redefining obesity for Asians. Public Health Nutr 2009; 12:497–506 [DOI] [PubMed] [Google Scholar]
- 21. Jee SH, Sull JW, Park J, Lee SY, Ohrr H, Guallar E, et al. Body-mass index and mortality in Korean men and women. N Engl J Med 2006; 355:779–87 [DOI] [PubMed] [Google Scholar]
- 22. Deurenberg P, Yap M, van Staveren WA. Body mass index and percent body fat: a meta analysis among different ethnic groups. Int J Obes Relat Metab Disord 1998; 22:1164–71 [DOI] [PubMed] [Google Scholar]
- 23. Ul-Haq Z, Mackay DF, Fenwick E, Pell JP. Impact of metabolic comorbidity on the association between body mass index and health-related quality of life: a Scotland-wide cross-sectional study of 5,608 participants. BMC Public Health 2012; 12:143 [DOI] [PMC free article] [PubMed] [Google Scholar]
- 24. Jager KJ, Stel VS, Zoccali C, Wanner C, Dekker FW. The issue of studying the effect of interventions in renal replacement therapy - to what extent may we be deceived by selection and competing risk? Nephrol Dial Transplant 2010; 25:3836–9 [DOI] [PubMed] [Google Scholar]
- 25. Chen HY, Kao TW, Huang JW, Chu TS, Wu KD. Correlation of metabolic syndrome with residual renal function, solute transport rate and peritoneal solute clearance in chronic peritoneal dialysis patients. Blood Purif 2008; 26:138–44 [DOI] [PubMed] [Google Scholar]
- 26. Davies SJ, Phillips L, Russell GI. Peritoneal solute transport predicts survival on CAPD independently of residual renal function. Nephrol Dial Transplant 1998; 13:962–8 [DOI] [PubMed] [Google Scholar]
- 27. Szeto CC, Wong TY, Chow KM, Leung CB, Law MC, Li PK. Independent effects of renal and peritoneal clearances on the mortality of peritoneal dialysis patients. Perit Dial Int 2004; 24:58–64 [PubMed] [Google Scholar]


