Abstract
♦ Background: Obesity increases mortality in the general population, but improves survival in hemodialysis patients. In peritoneal dialysis (PD) patients, the reported effect is controversial. We investigated the effect of body mass index (BMI) on patient survival in Asian PD patients.
♦ Methods: The survival of incident Asian PD patients from 2001 to 2008 in a single center in Hong Kong was analyzed retrospectively. Baseline demographic and clinical data were collected from patient records. Patients who had a total Kt/V below 1.7 or who died within 6 months were excluded. The BMI was categorized using the World Health Organization recommendation for Asian populations.
♦ Results: In the 274 study patients [154 men (56%); 138 with diabetes (50.4%); mean age: 63.4 ± 14.6 years; mean BMI: 21.97 ± 3.23 kg/m2; 37 underweight (13.5%); 35 obese (12.8%)], the relative risk (RR) for mortality [adjusted for age, diabetes status, and cardiovascular disease (CVD)] was similar for the normal and overweight groups, but higher for the underweight (RR: 1.909; p = 0.028) and obese groups (RR: 1.799; p = 0.048). The increased mortality in obese patients was more prominent in patients with diabetes (RR: 1.9 vs 1.19 in patients without diabetes; p = 0.074 and 0.76 respectively), and in patients with CVD (RR: 8.895 vs 1.642 in patients without CVD; p = 0.012 and 0.122 respectively).
♦ Conclusions: In Asian PD patients, the relationship between BMI and mortality was U-shaped, with higher mortality in the underweight and obese patients. The negative impact of obesity was more prominent in patients with diabetes and CVD.
Keywords: Body mass index, cardiovascular disease, diabetes, mortality
In the general population, body mass index (BMI) has an influence on health risk and survival. Increased risks for cardiovascular disease (CVD), diabetes mellitus (DM), and mortality are found in patients with overweight and obesity. A J- or V-shaped relationship between BMI and mortality risk is well documented in the general population, meaning that, although mortality increases with BMI, individuals with low a BMI also experience increased mortality, although not as high as that in obese individuals (1-5). However, in hemodialysis (HD) patients, higher BMI carries a protective effect with respect to patient survival (6-10)—a finding described as a “reverse epidemiology” phenomenon (11). In contrast, the impact of BMI on survival in peritoneal dialysis (PD) patients is inconsistent. Some studies have suggested a similar protective effect of BMI (12-15), some have suggested a neutral effect (11,16), and some have indicated that survival is worse in obese patients (17,18).
The relationship between BMI and mortality might be different in dialysis patients of different ethnicities. Wong et al. (9) were the first to report a difference in the impact of BMI on survival in white and Asian HD patients within the United States. In contrast to the typical reverse epidemiology pattern found in white HD patients, Asian HD patients in the United States demonstrated a V-shaped mortality risk relationship, with the lowest risk found in the middle-quintile BMI group, corresponding to a BMI of approximately 23 kg/m2. (The middle-quintile BMI for Caucasians is approximately 25 kg/m2.) This V-shaped relationship somewhat simulates the relationship in the general population (5). McDonald et al. (17) also found that the relationship was different in white and Pacific Islander PD patients in Australia and New Zealand. However, there is a paucity of such information for Asian PD populations living in Asia. It is also plausible that the relationship between mortality risk and BMI differs not only between ethnicities, but also between subgroups such as those with and without DM, and those with and without CVD. We therefore conducted the present analysis to examine the impact of BMI on survival in Asian PD patients and to analyze whether the patterns of association are different in patients with different DM and CVD statuses.
Methods
This retrospective study looked at incident adult Asian end-stage renal disease patients who started home PD at our center from 2001 to 2008. Starting in 2001, our center had adopted the policy of a minimal combined peritoneal and renal Kt/V of 1.7, which accords with the subsequently published Kidney Disease Outcomes Quality Initiative, European best practice, and International Society for Peritoneal Dialysis guidelines in 2005 and 2006 (19-21). Patients of non-Asian ethnicity and those whose combined Kt/V target was not achieved were excluded. Patients who died within 6 months after PD commencement were also excluded because their causes of death were most likely related to pre-existing comorbidities.
Clinical, demographic, and biochemical data were retrieved from patient records. Clinical data included primary kidney disease and history of CVD and comorbidities [by Charlson comorbidity index (CCI)]. Demographic data—including age, body weight, and height—were collected at the time of home PD training, usually after a few weeks of hospital intermittent PD. Assessment of PD adequacy and a peritoneal equilibration test were performed after 4 - 6 weeks of home PD and yearly thereafter. Adequacy data included Kt/V (peritoneal, renal, and combined), residual renal function (calculated as the average of urea and creatinine clearances from a 24-hour urine collection), and normalized protein equivalent of nitrogen appearance (nPNA). Serum albumin and creatinine were measured at the time of PD adequacy assessment. Body weight recorded on the day of the first Kt/V assessment was used for the analysis.
Because body composition is different in individuals of Asian and white ethnicity, we adopted the BMI categorization of the World Health Organization for Asian populations (22,23), classifying patients into underweight, normal, overweight, obese I, and obese II groups (<18.5 kg/m2, 18.5 - 22.9 kg/m2, 23 - 24.9 kg/m2, 25 - 29.9 kg/m2, and ≥30 kg/m2 respectively). Because only 2 patients had a BMI in the obese II category, the obesity I and II categories were combined into a single obese category (BMI ≥ 25 kg/m2).
Survival was counted from the day of home PD training to 31 January 2011 and was censored for transplantation, permanent transfer to HD, and loss to follow-up.
Statistical Analysis
We used SPSS Statistics (version 17.0: SPSS, Chicago, IL, USA) for the statistical analysis. Analysis of variance was used to compare continuous variables, and chi-square tests were used to compare categorical data between the patient groups. Actuarial survival rates were determined by life-table and Kaplan-Meier analysis, with a log-rank test for the comparison of survival rates between groups. The impact of each variable on mortality was tested in a univariate Cox regression model. A multivariate backward stepwise Cox regression model was used to determine the relative risk (RR) for each category of BMI with respect to mortality; the model was controlled for age, DM, history of CVD, and residual renal function. The CCI score was not used in the multivariate model because age, DM, and CVD are major components of that index.
Data are presented as mean ± standard deviation. The RR for mortality was expressed with a 95% confidence interval (CI). The difference was considered significant when the p value was less than 0.05.
Results
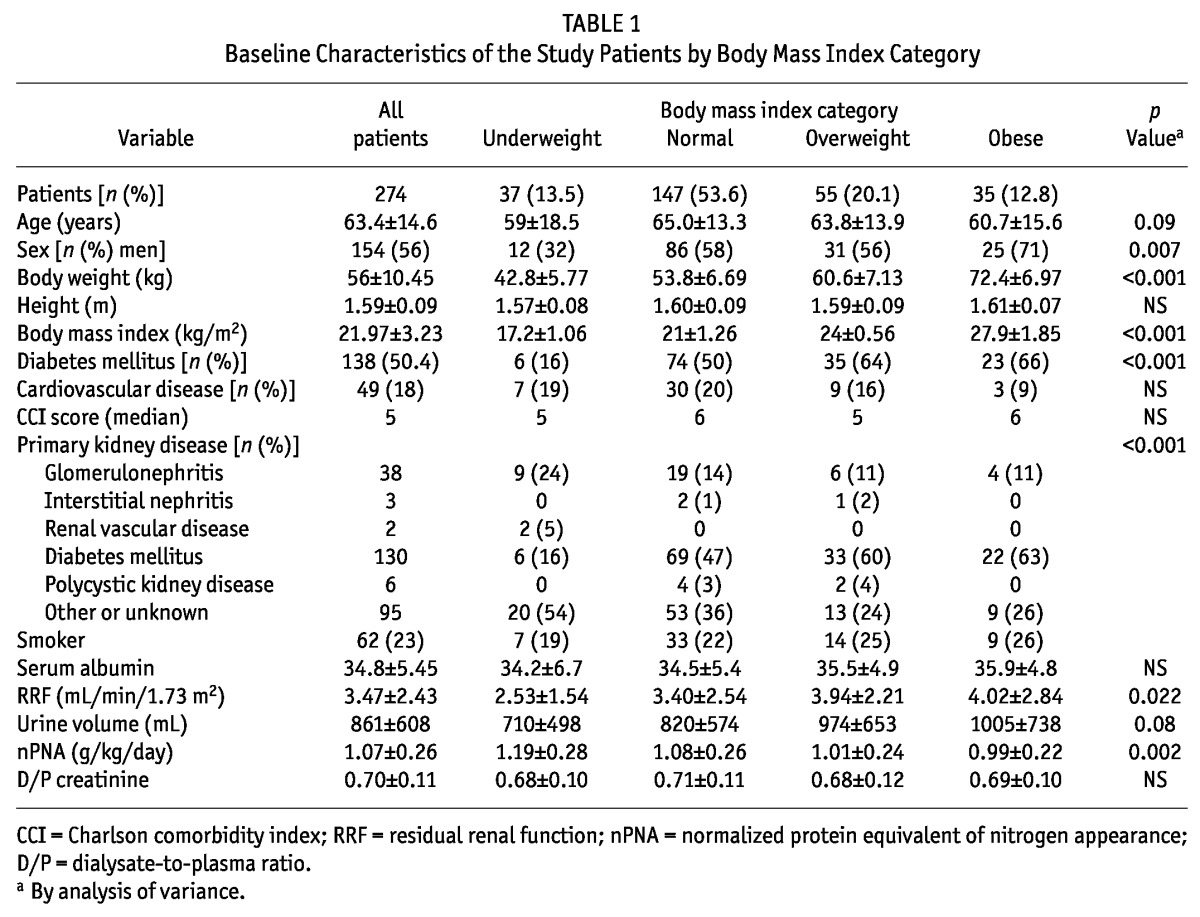
Of the 300 patients who commenced home PD during 2001 - 2008, 274 fulfilled the inclusion criteria. The excluded patients were non-Asian (n = 1), had less than 6 months of follow-up (died, n = 14; underwent renal transplantation, n = 3; switched to HD, n = 3; or were lost to follow-up, n = 4), or had a combined Kt/V less than 1.7 (n = 1). In the study cohort, all patients were Chinese, except for 2 who were Filipino (age range: 21.6 - 88.8 years; mean follow-up: 43.5 ± 22.9 months). Table 1 shows the demographic and clinical data for the study cohort.
TABLE 1.
Baseline Characteristics of the Study Patients by Body Mass Index Category
BMI Categorization
Among the study patients, 147 (53.6%) were in the normal BMI group. The proportion of underweight, overweight, and obese patients was 13.5%, 20.1%, and 12.8% respectively. Patients in both the underweight and the obese group were younger than those in the normal and overweight groups. Compared with the underweight and normal BMI groups, the overweight and obese groups contained more patients with DM (64% and 66% respectively, p < 0.001; Figure 1). The proportion of patients with a history of CVD was not significantly different in the various BMI categories.
Figure 1 —
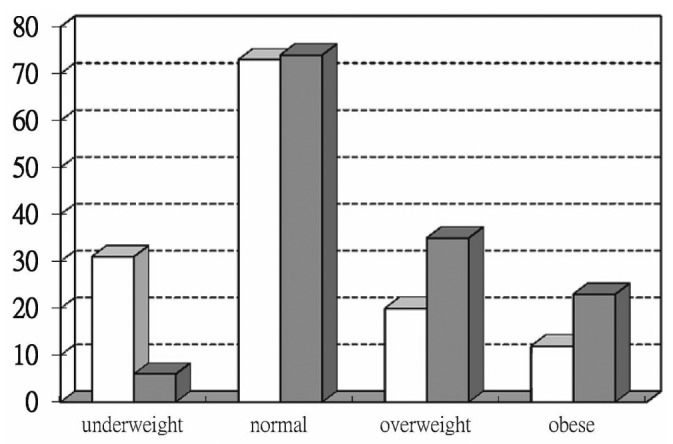
Number of patients in each body mass index group according to diabetes status (nondiabetic, open bars; diabetic, solid bars; p = 0.000).
Outcomes
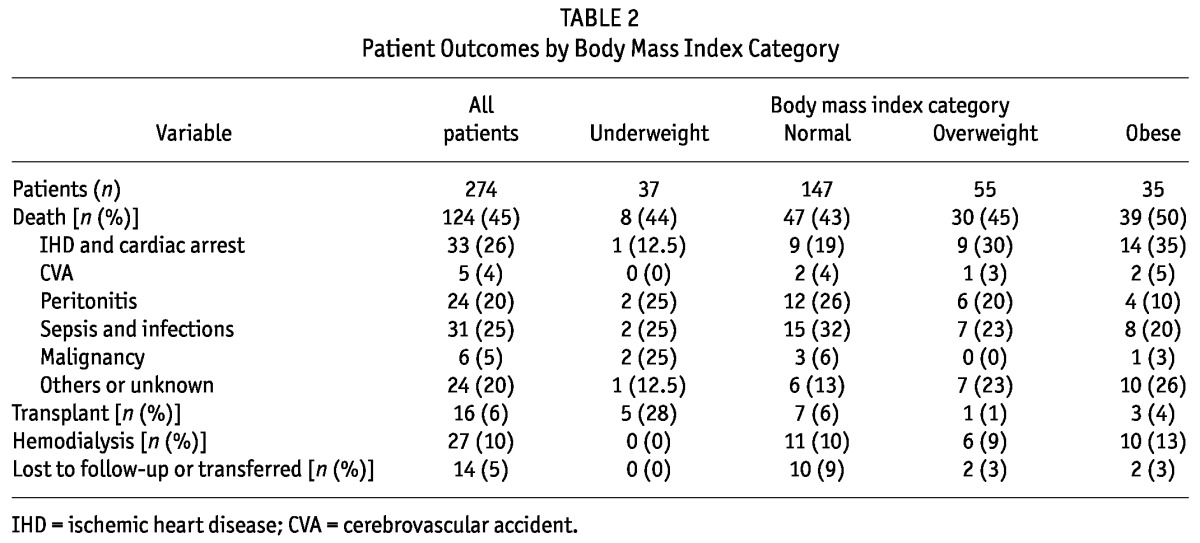
By the end of the study period, 124 patients had died, 16 had undergone transplantation, 27 had transferred to HD, and 14 had been lost to follow-up or had transferred to other hospitals. The mean follow-up period was 43.5 ± 22.9 months. Counting from 6 months after the start of home PD, the 1-, 2-, and 5-year survival rates were 94%, 82%, and 46% respectively. Survival in the various BMI groups did not significantly differ (p = 0.4, Figure 2). Deaths from cardiac causes were more frequent in the overweight and obese groups, but the difference was not statistically significant (Table 2). Of the 33 patients who died from cardiac events, 23 (70%) belonged to the combined overweight and obese population, but that proportion was not statistically significant (p = 0.21).
Figure 2 —
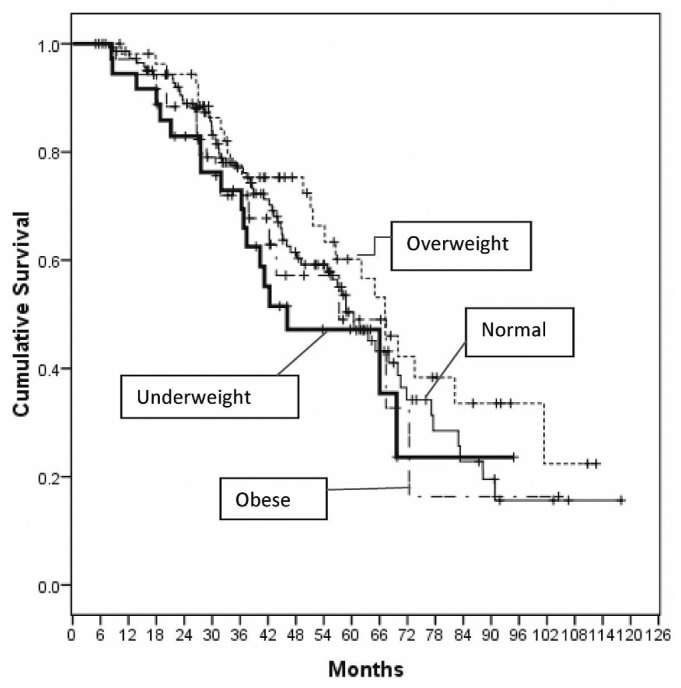
Unadjusted survival by body mass index group, starting 6 months after commencement of home peritoneal dialysis (p = nonsignificant).
TABLE 2.
Patient Outcomes by Body Mass Index Category
The significant mortality risk factors, as identified by univariate Cox regression analysis were age, CVD, CCI score, body weight, serum albumin, and creatinine (Table 3). Sex, DM, residual renal function, nPNA, and BMI category were not significant mortality risk factors. However, after adjustment for age, CVD, and DM, BMI category became a significant independent mortality risk factor in the multivariate Cox regression analysis, with increased risk in the underweight and obese groups (Table 3). Compared with the normal BMI group, the underweight and obese groups had higher mortality risks (underweight RR: 1.909; 95% CI: 1.07 to 3.40; p = 0.028; obese RR: 1.799; 95% CI: 1.006 to 3.215; p = 0.048). The mortality risk for the overweight group was similar to that for the normal group (overweight RR: 0.92; 95% CI: 0.58 to 1.48; p = nonsignificant; Table 3, Figures 3 and 4).
TABLE 3.
Unadjusted and Adjusted Relative Mortality Risk by Various Parameters at Baseline
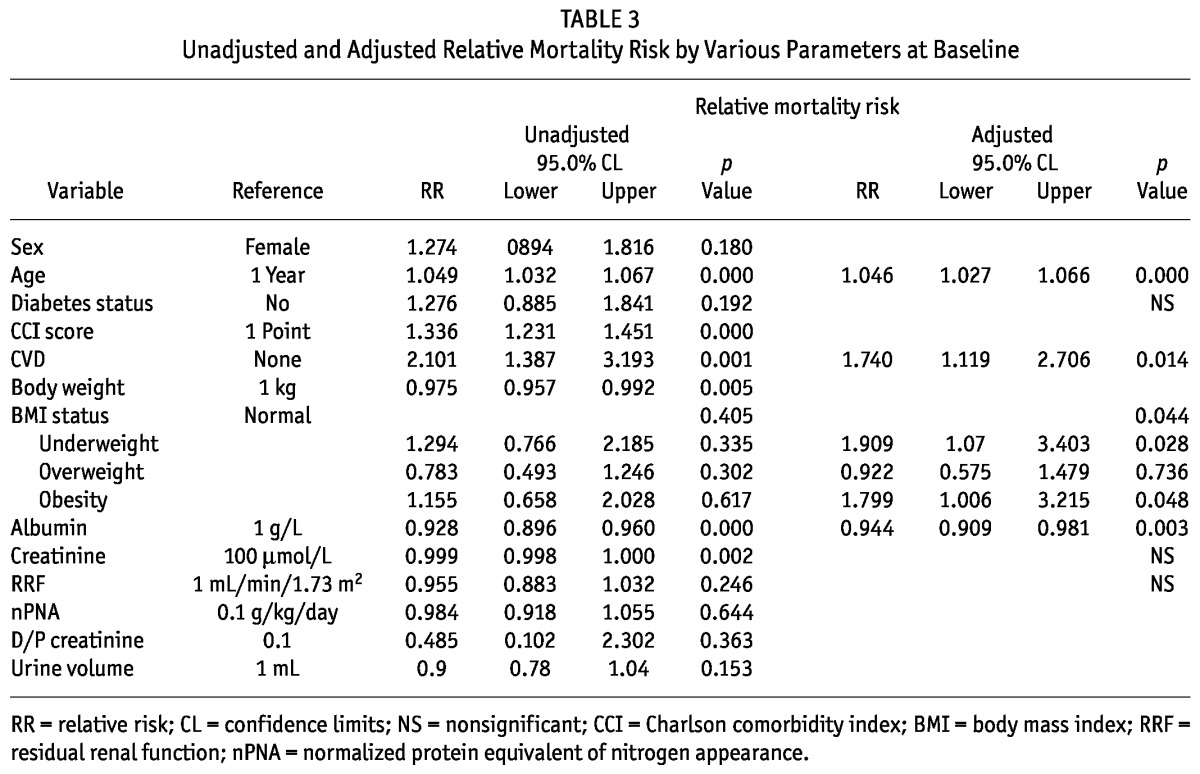
Figure 3 —
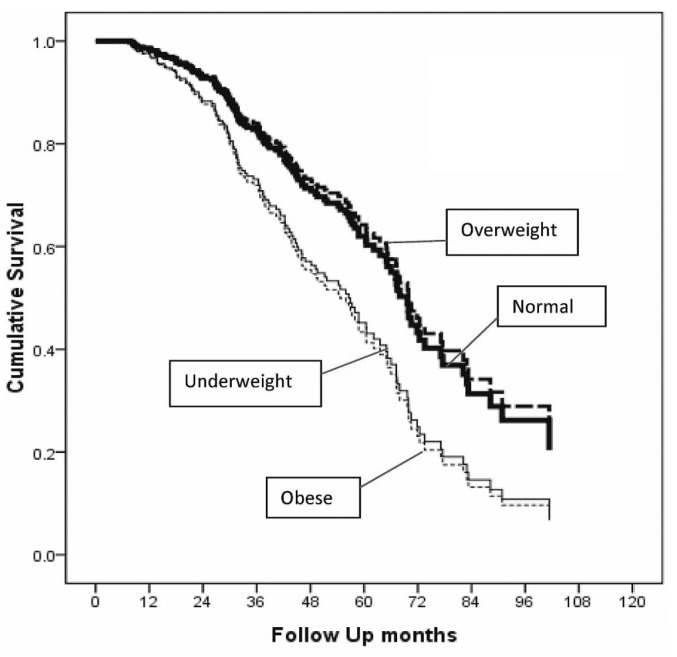
Adjusted survival by body mass index group, starting 6 months after commencement of home peritoneal dialysis (underweight, p = 0.028; obese, p = 0.048).
Figure 4 —
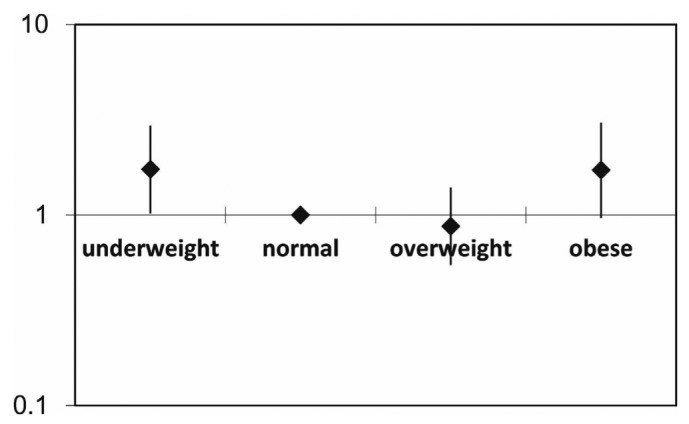
Relative mortality risk by baseline body mass index group (all patients), adjusted for age, diabetes and cardiovascular disease history, and residual renal function. The mortality risk is expressed in log scale.
The 5-year death-censored technique survival rate was 78%. Neither the unadjusted nor the adjusted RRs for the various BMI groups were statistically significant. The mean peritonitis rate was slightly higher in the underweight and obese groups, but the difference was not statistically significant: 0.42, 0.18, 0.18, and 0.31 episodes per patient-year for the underweight, normal, overweight, and obese groups respectively; p = 0.87 by Kruskal-Wallis test between the groups; and p = 0.83 between the underweight and combined normal and overweight groups, and p = 0.65 between the obese and combined normal and overweight groups by Mann-Whitney U-test.
Subgroup Analysis
The increase in adjusted mortality risk in the obese group was more prominent among patients with DM (RR: 1.90; 95% CI: 0.94 to 3.86; p = 0.074) than among those without DM (RR: 1.19; 95% CI: 0.40 to 3.51; p = 0.759; Figure 5). When patients were divided according to history of CVD, the U-shaped association was also observed in patients with and without CVD. The association between obesity and mortality risk was very strong in patients with a history of CVD (RR: 8.895; 95% CI: 1.629 to 48.572; p = 0.012; Table 4, Figure 6).
Figure 5 —

Relative mortality risk by baseline body mass index group and diabetes status, adjusted for age, cardiovascular disease history, and residual renal function in (A) nondiabetic patients and (B) diabetic patients. The mortality risk is expressed in log scale.
TABLE 4.
Adjusted Relative Mortality Risk in Patients With and Without a History of Cardiovascular Disease
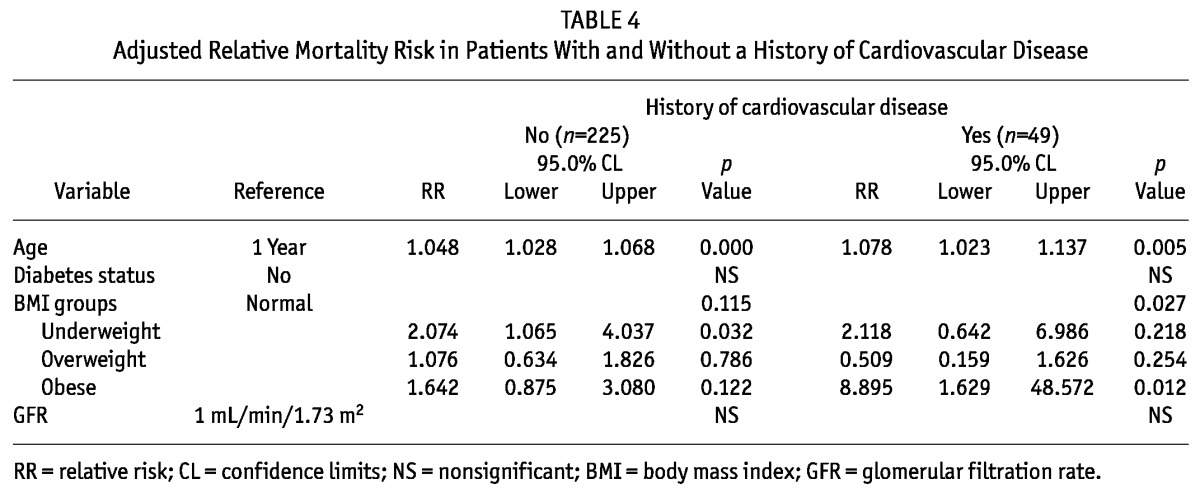
Figure 6 —

Relative mortality risk by baseline body mass index group and cardiovascular disease (CVD) history, adjusted for age, diabetes status, and residual renal function, in patients (A) with no CVD history and (B) with a CVD history. The mortality risk is expressed in log scale.
Discussion
Our study demonstrates increased mortality risk in underweight and obese PD patients alike; in the normal and overweight groups, mortality risk was similar. This pattern is somewhat different from that observed in HD patients. Our findings are consistent with a recent publication from China (18). That study used the reference BMI categories for a white population for the definition of normal weight (18.5 - 24.9 kg/m2) and overweight (25 - 29.9 kg/m2) and showed that survival was better in the normal BMI group than in the overweight PD patients. In fact, the overweight patients in that study should be regarded as obese according to the World Health Organization definition for Asian populations. We therefore emphasize the importance of using the appropriate World Health Organization classification according to ethnicity in body-weight studies.
In HD patients, achieving Kt/V targets in bigger individuals is usually not a problem, and a higher BMI might indicate more nutrition reserves for combating the effects of inflammation—a plausible explanation for the reverse epidemiology phenomenon (11). In PD patients, the issue of BMI is more complicated. Higher BMI usually means higher body weight and total body water, resulting in less solute clearance for the same dialysis prescription, which might have a negative effect on survival. To eliminate that confounder, our study included only patients whose combined renal and peritoneal Kt/V reached the target of 1.7—the minimum dialysis adequacy target according to the latest International Society for Peritoneal Dialysis, Kidney Disease Outcomes Quality Initiative, and European best practice guidelines (19-21). Our previous multicenter study in Hong Kong did not find a survival difference between incident patients randomized to a Kt/V of 1.7 - 2.0 and of more than 2.0 (24). The higher mortality risk in our obese patients was therefore not affected by a lower-than-optimal peritoneal Kt/V.
An important finding of our study is that factors such as age, DM, and history of CVD influence the relationship between BMI and mortality risk. We wanted to study the specific interactions of age, DM, CVD, and BMI with survival, and so, even though CCI score was a strong predictor in the univariate analysis, we chose not to use CCI score in the multivariate analysis because the major determinants of the CCI score include age, DM, and CVD. Recently, the Netherlands Cooperative Study on the Adequacy of Dialysis found that in their dialysis (HD and PD) patients, obesity increased mortality risk in the younger patients, but not in those older than 65 years (25). We did not find this effect in our PD patients. Instead, we found that the association between obesity and mortality was most prominent in patients with DM and particularly in those with CVD. In the general population, obesity is associated mainly with death from CVD, but not with death from non-CVD causes (26). The additional glucose load in PD could be a contributing factor to obesity in end-stage renal failure patients leading to adverse outcomes, which is not seen in HD patients. The varying proportions of patients with DM or CVD in different populations might be one explanation for the variable relation between BMI and mortality in PD patients in the published literature. Another potential explanation is patient selection bias. Most published reports come from countries in which PD is used much less than HD. There is a belief that PD is not good for obese patients, and thus fewer such patients might be initiated on PD. Obese patients that are initiated on PD might therefore have some special characteristics that allow physicians to put them on PD, and those characteristics might have a confounding effect on mortality. In Hong Kong, all patients without a contraindication to PD are typically initiated on PD, including morbidly obese patients. Thus, selection bias is not an issue in the interpretation of our results.
Our study does have limitations. First, being a retrospective study, proving a causal relationship between BMI and mortality is difficult. In dialysis patients, body weight is also affected by fluid status. Fluid overload could contribute to a higher BMI or an increase in BMI, and similarly, improvement in fluid status could contribute to a reduction in BMI. We could not precisely determine fluid status retrospectively and thus could not eliminate fluid overload as a factor contributing to mortality. Similarly, we could not differentiate the relative contributions of fat mass and lean body mass to mortality, given that it has been suggested that PD patients with a high BMI and low muscle mass experience higher all-cause mortality and cardiovascular death (28). In HD patients, higher mid-arm muscle circumference was also associated with lower mortality (29). Some studies have reported that a proper proportion of muscle and fat mass is most important. Fat or muscle mass that is too low has been associated with increased mortality risk in HD patients (30). As a tool, BMI is too crude to reflect actual nutrition status or body composition. Ethnicity is also a concern in BMI and mortality studies. Most of our patients were of Southern Chinese origin, and thus we cannot generalize our results to other Asian populations or even to Northern Chinese, who have a slightly different build compared with their Southern counterparts. Too few obese II patients were available for analysis, given that some studies have suggested that morbid obesity is a poor prognostic factor in PD patients (17). The number of patients in our single-center study is much smaller than in studies using registry analysis. A larger cohort is required to confirm our observations and to conduct a more detailed subgroup analysis. It must also be noted that the survival rate in our study was counted starting 6 months after home PD commencement to eliminate the effect of mortality related to pre-existing conditions. The actual 1-year survival would be a bit lower. Thus, our observations might not be applicable for comparisons with conventional survival rates, which count from dialysis commencement or 3 months after commencement. Finally, although we found an increased mortality risk in obese PD patients, we have no data for a comparison of the impact of obesity on mortality between PD and HD patients. Given that an increased mortality risk with obesity has also been reported in Asian American and Japanese HD patients (9,27), our findings cannot be used to judge whether obese patients should be dialyzed with HD or PD.
Conclusions
Our study demonstrates increased mortality risk in both underweight and obese Asian PD patients, but not in overweight patients, in Hong Kong. The negative impact of obesity is more prominent among patients with DM and CVD. We recommend including DM and CVD status in future analyses of BMI and mortality.
Disclosures
VRK was an International Society of Peritoneal Dialysis fellow at Dr. Lee Iu Cheung Memorial Renal Centre, Department of Medicine, Tung Wah Hospital, Hong Kong, under the mentorship of WKL. The authors hereby state that they have no financial conflicts of interest.
Acknowledgments
The authors gratefully acknowledge editorial assistance provided by Rebecca Lew, PhD, of ProScribe Medical Communications (http://www.proscribe.com.au) and funded by Baxter Healthcare. Baxter Healthcare did not sponsor this study. In compliance with the Uniform Requirements for Manuscripts established by the International Committee of Medical Journal Editors, Baxter Healthcare did not influence the study design, data collection or analysis, or the decision to publish the manuscript. ProScribe’s services complied with international guidelines for Good Publication Practice (GPP2).
References
- 1. Lew EA, Garfinkel L. Variations in mortality by weight among 750,000 men and women. J Chronic Dis 1979; 32:563–76 [DOI] [PubMed] [Google Scholar]
- 2. Kushner RF. Body weight and mortality. Nutr Rev 1993; 51:127–36 [DOI] [PubMed] [Google Scholar]
- 3. Byers T. Body weight and mortality. N Engl J Med 1995; 333:723–4 [DOI] [PubMed] [Google Scholar]
- 4. Manson JE, Willett WC, Stampfer MJ, Colditz GA, Hunter DJ, Hankinson SE, et al. Body weight and mortality among women. N Engl J Med 1995; 333:677–85 [DOI] [PubMed] [Google Scholar]
- 5. Calle EE, Thun MJ, Petrelli JM, Rodriguez C, Heath CW., Jr Body-mass index and mortality in a prospective cohort of US adults. N Engl J Med 1999; 341:1097–105 [DOI] [PubMed] [Google Scholar]
- 6. Degoulet P, Legrain M, Réach I, Aimé F, Devriés C, Rojas P, et al. Mortality risk factors in patients treated by chronic hemodialysis. Report of the Diaphane collaborative study. Nephron 1982; 31:103–10 [DOI] [PubMed] [Google Scholar]
- 7. Leavey SF, Strawderman RL, Jones CA, Port FK, Held PJ. Simple nutritional indicators as independent predictors of mortality in hemodialysis patients. Am J Kidney Dis 1998; 31:997–1006 [DOI] [PubMed] [Google Scholar]
- 8. Leavey SF, McCullough K, Hecking E, Goodkin D, Port FK, Young EW. Body mass index and mortality in “healthier” as compared with “sicker” haemodialysis patients: results from the Dialysis Outcomes and Practice Patterns Study (DOPPS). Nephrol Dial Transplant 2001; 16:2386–94 [DOI] [PubMed] [Google Scholar]
- 9. Wong JS, Port FK, Hulbert-Shearon TE, Carroll CE, Wolfe RA, Agodoa LY, et al. Survival advantage in Asian American end-stage renal disease patients. Kidney Int 1999; 55:2515–23 [DOI] [PubMed] [Google Scholar]
- 10. Abbott KC, Glanton CW, Trespalacios FC, Oliver DK, Ortiz MI, Agodoa LY, et al. Body mass index, dialysis modality, and survival: analysis of the United States Renal Data System Dialysis Morbidity and Mortality Wave II Study. Kidney Int 2004; 65:597–605 [DOI] [PubMed] [Google Scholar]
- 11. Kalantar-Zadeh K, Abbott KC, Salahudeen AK, Kilpatrick RD, Horwich TB. Survival advantages of obesity in dialysis patients. Am J Clin Nutr 2005; 81:543–54 [DOI] [PubMed] [Google Scholar]
- 12. Johnson DW, Herzig KA, Purdie DM, Chang W, Brown AM, Rigby RJ, et al. Is obesity a favorable prognostic factor in peritoneal dialysis patients? Perit Dial Int 2000; 20:715–21 [PubMed] [Google Scholar]
- 13. Snyder JJ, Foley RN, Gilbertson DT, Vonesh EF, Collins AJ. Body size and outcomes on peritoneal dialysis in the United States. Kidney Int 2003; 64:1838–44 [DOI] [PubMed] [Google Scholar]
- 14. Pliakogiannis T, Trpeski L, Taskapan H, Shah H, Ahmad M, Fenton S, et al. Reverse epidemiology in peritoneal dialysis patients: the Canadian experience and review of the literature. Int Urol Nephrol 2007; 39:281–8 [DOI] [PubMed] [Google Scholar]
- 15. de Mutsert R, Grootendorst DC, Boeschoten EW, Dekker FW, Krediet RT. Is obesity associated with a survival advantage in patients starting peritoneal dialysis? Contrib Nephrol 2009; 163:124–31 [DOI] [PubMed] [Google Scholar]
- 16. Aslam N, Bernardini J, Fried L, Piraino B. Large body mass index does not predict short-term survival in peritoneal dialysis patients. Perit Dial Int 2002; 22:191–6 [PubMed] [Google Scholar]
- 17. McDonald SP, Collins JF, Johnson DW. Obesity is associated with worse peritoneal dialysis outcomes in the Australia and New Zealand patient populations. J Am Soc Nephrol 2003; 14:2894–901 [DOI] [PubMed] [Google Scholar]
- 18. Zhou H, Cui L, Zhu G, Jiang Y, Gao X, Zou Y, et al. Survival advantage of normal weight in peritoneal dialysis patients. Ren Fail 2011; 33:964–8 [DOI] [PubMed] [Google Scholar]
- 19. Peritoneal Dialysis Adequacy Work Group. Clinical practice guidelines for peritoneal dialysis adequacy. Am J Kidney Dis 2006; 48(Suppl 1):S98–129 [DOI] [PubMed] [Google Scholar]
- 20. Dombros N, Dratwa M, Feriani M, Gokal R, Heimbürger O, Krediet R, et al. on behalf of the EBPG Expert Group on Peritoneal Dialysis. European best practice guidelines for peritoneal dialysis. Nephrol Dial Transplant 2005; 20(Suppl 9):ix1–37 [DOI] [PubMed] [Google Scholar]
- 21. Lo WK, Bargman JM, Burkart J, Krediet RT, Pollock C, Kawanishi H, et al. on behalf of the ISPD Adequacy of Peritoneal Dialysis Working Group. Guideline on targets for solute and fluid removal in adult patients on chronic peritoneal dialysis. Perit Dial Int 2006; 26:520–2 [PubMed] [Google Scholar]
- 22. World Health Organization, The International Association for the Study of Obesity International Obesity Task Force. The Asia-Pacific Perspective: Redefining Obesity and Its Treatment. Brisbane, Australia: Health Communications Australia; 2000. [Google Scholar]
- 23. WHO Expert Consultation. Appropriate body-mass index for Asian populations and its implications for policy and intervention strategies. Lancet 2004; 363:157–63 [Erratum in: Lancet 2004; 363:902] [DOI] [PubMed] [Google Scholar]
- 24. Lo WK, Ho YW, Li CS, Wong KS, Chan TM, Yu AW, et al. Effect of Kt/V on survival and clinical outcome in CAPD patients in a randomized prospective study. Kidney Int 2003; 64:649–56 [DOI] [PubMed] [Google Scholar]
- 25. Hoogeveen EK, Halbesma N, Rothman KJ, Stijnen T, van Dijk S, Dekker FW, et al. Obesity and mortality risk among younger dialysis patients. Clin J Am Soc Nephrol 2012; 7:280–8 [DOI] [PMC free article] [PubMed] [Google Scholar]
- 26. Dorn JM, Schisterman EF, Winkelstein W, Jr, Trevisan M. Body mass index and mortality in a general population sample of men and women. The Buffalo Health Study. Am J Epidemiol 1997; 146:919–31 [DOI] [PubMed] [Google Scholar]
- 27. Kaizu Y, Tsunega Y, Yoneyama T, Sakao T, Hibi I, Miyaji K, et al. Overweight as another nutritional risk factor for the long-term survival of non-diabetic hemodialysis patients. Clin Nephrol 1998; 50:44–50 [PubMed] [Google Scholar]
- 28. Ramkumar N, Pappas LM, Beddhu S. Effect of body size and body composition on survival in peritoneal dialysis patients. Perit Dial Int 2005; 25:461–9 [PubMed] [Google Scholar]
- 29. Noori N, Kopple JD, Kovesdy CP, Feroze U, Sim JJ, Murali SB, et al. Mid-arm muscle circumference and quality of life and survival in maintenance hemodialysis patients. Clin J Am Soc Nephrol 2010; 5:2258–68 [DOI] [PMC free article] [PubMed] [Google Scholar]
- 30. Huang CX, Tighiouart H, Beddhu S, Cheung AK, Dwyer JT, Eknoyan G, et al. Both low muscle mass and low fat are associated with higher all-cause mortality in hemodialysis patients. Kidney Int 2010; 77:624–9 [DOI] [PMC free article] [PubMed] [Google Scholar]


