Abstract
♦ Objectives: We studied the effect of body mass index (BMI) at peritoneal dialysis (PD) initiation on patient and technique survival and on peritonitis during follow-up.
♦ Methods: We followed 328 incident patients on PD (176 with diabetes; 242 men; mean age: 52.6 ± 12.6 years; mean BMI: 21.9 ± 3.8 kg/m2) for 20.0 ± 14.3 months. Patients were categorized into four BMI groups: obese, ≥25 kg/m2; overweight, 23 - 24.9 kg/m2; normal, 18.5 - 22.9 kg/m2 (reference category); and underweight, <18.5 kg/m2. The outcomes of interest were compared between the groups.
♦ Results: Of the 328 patients, 47 (14.3%) were underweight, 171 (52.1%) were normal weight, 53 (16.2%) were overweight, and 57 (17.4%) were obese at commencement of PD therapy. The crude hazard ratio (HR) for mortality (p = 0.004) and the HR adjusted for age, subjective global assessment, comorbidities, albumin, diabetes, and residual glomerular filtration rate (p = 0.02) were both significantly greater in the underweight group than in the normal-weight group. In comparison with the reference category, the HR for mortality was significantly greater for underweight PD patients with diabetes [2.7; 95% confidence interval (CI): 1.5 to 5.0; p = 0.002], but similar for all BMI categories of nondiabetic PD patients.
Median patient survival was statistically inferior in underweight patients than in patients having a normal BMI. Median patient survival in underweight, normal, overweight, and obese patients was, respectively, 26 patient-months (95% CI: 20.9 to 31.0 patient-months), 50 patient-months (95% CI: 33.6 to 66.4 patient-months), 57.7 patient-months (95% CI: 33.2 to 82.2 patient-months), and 49 patient-months (95% CI: 18.4 to 79.6 patient-months; p = 0.015). Death-censored technique survival was statistically similar in all BMI categories. In comparison with the reference category, the odds ratio for peritonitis occurrence was 1.8 (95% CI: 0.9 to 3.4; p = 0.086) for underweight patients; 1.7 (95% CI: 0.9 to 3.2; p = 0.091) for overweight patients; and 3.4 (95% CI: 1.8 to 6.4; p < 0.001) for obese patients.
♦ Conclusions: In our PD patients, mean BMI was within the normal range. The HR for mortality was significantly greater for underweight diabetic PD patients than for patients in the reference category. Death-censored technique survival was similar in all BMI categories. Obese patients had a greater risk of peritonitis.
Keywords: Body mass index, obesity, patient survival, technique survival, peritonitis
Obesity is a growing problem worldwide, including in developing countries. In the general population, increasing body mass index (BMI) is associated with greater comorbidity and mortality (1,2). With improved life expectancy, greater awareness of renal disease, and better pre-dialysis management of chronic kidney disease, the number of patients surviving to initiate renal replacement therapy (RRT) is increasing (3,4). Studies in hemodialysis patients have shown the presence of “confounded” or “reverse” epidemiology, a seemingly paradoxical observation that the presence of hypercholesterolemia, hypertension, and high BMI are associated with improved survival in patients on maintenance hemodialysis (5-9). In contrast, reports of outcomes in patients undergoing PD have been conflicting, with one study showing a survival advantage with higher BMI (10), and two other studies showing lack of an effect of body size on outcomes (11,12).
Obesity has long been considered a relative contraindication to PD initiation because of a greater chance of metabolic complications with excessive carbohydrate absorption, high serum concentration of triglycerides, poor uremic solute clearance, abdominal herniation, catheter failure, and peritonitis (13-15). However, PD patients with a high BMI and normal or high muscle mass fared best on survival analysis (16).
Previous studies evaluating the effect of body size on PD catheter-associated peritonitis also yielded inconsistent results. Two studies of small sample size and short follow-up duration found no association (17,18), but a large retrospective study showed a significant risk of peritonitis in patients with a higher BMI at commencement of PD (19).Despite technical advancements in connectology, peritonitis continues to be an “Achilles heel” for PD patients (20,21). The dropout rate for patients on PD has declined significantly in the South Asian region since the early 2000s, but non-resolving peritonitis continues to be a leading cause of technique failure and poor patient survival (22-24).
Compared with patients in developed countries, patients in India initiating RRT have a different body size (25). The BMI has recently been validated for Asians, and different cut-off values have been used to define underweight, normal, overweight, and obese patients (26-28). South Asia—including India, Pakistan, Bangladesh, Nepal, and Sri Lanka—is home to more than 1.4 billion people, constituting 23% of the world’s population. All South Asians share the dubious distinction of having the highest rates of premature coronary artery disease and diabetes in the world. Diabetes and cardiovascular disease both occur about 10 years earlier in South Asians than in any other population group (29,30).
For more than two decades, PD has been an established mode of RRT in India (31). Evidence is lacking for the effect of BMI—using either the new or the old classification—on survival in PD patients from India. We undertook the present study to analyze the effect of initial BMI on patient and technique survival and on peritonitis in Indian PD patients.
Methods
Subjects
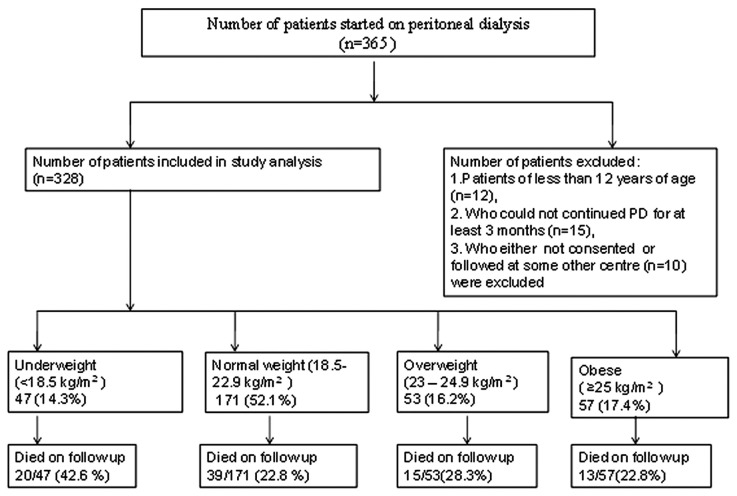
Our prospective observational study considered for inclusion 365 end-stage renal disease (ESRD) patients who were initiated on PD from November 2005 to December 2009 at our institute. De novo patients between the ages of 12 and 75 years starting RRT with PD as their primary choice were included. Patients less than 12 years of age (n = 12), those who had not continued PD for at least 3 months (n = 15), and those who could not consent to inclusion or who were followed at another center (n = 10) were excluded, leaving 328 patients for analysis. Patients were followed to one of the study endpoints: death, renal transplantation, transfer to hemodialysis, or end of the study period (December 2011). Figure 1 shows the study plan.
Figure 1 —
Study plan. PD = peritoneal dialysis.
All patients were interviewed for a detailed clinical history and underwent a physical examination. Baseline demographics and clinical characteristics of the patients were recorded. In all patients, a double-cuffed straight Tenckhoff catheter was inserted by surgical technique, and PD was started after a break-in period of 12 ± 4 days. All patients were started on a disconnect system using Dianeal UltraBag PD fluid (Baxter, Manesar, India), using three 2-L exchanges daily. The dialysis prescription was then changed according to individual requirements during follow-up. Transport characteristics (by peritoneal equilibration test) and adequacy of dialysis (measured as the weekly total Kt/V urea and creatinine clearances) were calculated using the PD Adequest software (version 2.0: Baxter) between 4 and 6 weeks after PD initiation.
Each individual’s BMI at the commencement of RRT was calculated as their weight in kilograms divided by the square of their height in meters. The recommendations of the World Health Organization for Asians were adopted to categorize the patients into 4 groups based on BMI: obese, ≥25 kg/m2; overweight, 23 - 24.9 kg/m2; normal weight, 18.5 - 22.9 kg/m2; and underweight, <18.5 kg/m2 (26).
Nutrition status was also assessed for all patients by anthropometry, serum albumin, and subjective global assessment (SGA), a validated estimate of nutrition status for patients treated with PD. We used a 7-point Likert-type scale consisting of 4 items: weight loss, anorexia, subcutaneous fat, and muscle mass. Each item was individually scored and then totalled to produce a global assessment. A score of 1-2 represents severe malnutrition; 3-5, moderate-to-mild malnutrition; and 6-7, normal nutrition (32). The mean SGA scores were also compared for the 4 BMI groups.
The comorbidities of patients were scored using the Davies index (33). The domains considered to be active comorbidities were malignancy, ischemic heart disease, peripheral vascular disease, left ventricular dysfunction, diabetes mellitus, systemic collagen vascular disease, and other significant pathology (severe chronic obstructive pulmonary disease, cirrhosis, psychotic illness). The comorbidity score for each patient was a simple count of the affected domains. Residual glomerular filtration rate (GFR) was estimated as the mean of the urea and creatinine clearances determined from a 24-hour urine collection at the time of a peritoneal equilibration test in the patients.
Diagnosis of Peritonitis
All patients on PD were advised to contact us, the PD nurses, or the clinical field coordinator as soon as possible by emergency call if they experienced cloudy effluent, digestive tract symptoms, fever, or abdominal pain of either undetermined or determined origin. Each patient was assessed by PD nurses and a physician. A diagnosis of peritonitis was made when the patient fulfilled at least 2 of the following 3 criteria: signs and symptoms of peritonitis; cloudy dialysate, with a white blood cell count exceeding 100/μL and more than 50% neutrophils; and demonstration of organisms by either smear or culture of peritoneal effluent.
All episodes of peritonitis were tracked in our main data system. The peritonitis episodes (with 95% upper and lower confidence limits) were compared for the BMI groups. The incidence of peritonitis in episodes per patient-year was additionally calculated by dividing the total number of peritonitis episodes by the total duration of PD treatment for the particular group of patients.
Statistical Analysis
All data were analyzed using the SPSS statistical software package (version 16: SPSS, Chicago, IL, USA). All data are expressed as mean ± standard deviation for continuous parametric data, and as frequencies and percentages for categorical variables. The chi-square and Kruskal-Wallis tests were used to compare the frequency distribution of categorical variables in the BMI groups depending on whether the data had a parametric or nonparametric distribution. One-way analysis of variance was used to compare the differences in mean values between the groups, and a Bonferroni test was used to determine the significance of differences.
Time-dependent univariate and multivariate Cox regression analysis was used to determine hazard ratios for death. Crude and adjusted hazard ratios for death were also analyzed with reference to normal weight in the various BMI groups. Patient and technique survival were analyzed using Kaplan-Meier curves, and the log-rank test was used to compare groups. All-cause mortality was considered an event in the patient survival analysis, and patients who underwent renal transplantation or who were shifted to maintenance hemodialysis were censored.
Technique failure was defined as removal of the Tenckhoff catheter and transfer from PD to hemodialysis for more than 1 month. It was tested without counting death during treatment as a failure (death-censored technique failure). If a patient died within 4 weeks after transfer to hemodialysis, the death was attributed to PD because these early deaths are considered to reflect the health status of the patient during PD therapy. In contrast, deaths that occurred more than 4 weeks after cessation of PD were not attributed to PD, and such episodes were censored at the end of PD treatment. A p value less than 0.05 was considered significant.
Results
Table 1 shows the relevant demographics and baseline clinical characteristics of the patients in the 4 BMI groups. In our PD patients, mean BMI (21.9 kg/m2) was within the normal range. Of the 328 study patients, 47 (14.3%) were underweight, 171 (52.1%) were normal weight, 53 (16.2%) were overweight, and 57 (17.4%) were obese according to BMI at commencement of PD therapy. Overweight and obese patients were relatively older (56.1 ± 12.5 years and 56.7 ± 9.8 years respectively) than the normal-weight or underweight patients (51.4 ± 12.7 years and 52.8 ± 14.9 years respectively). The sex ratio (men:women) was statistically similar in all groups. Men (n = 242) outnumbered women (n = 86).
TABLE 1.
Demographic Profile and Clinical Characteristics of Study Patients by Body Mass Index Category
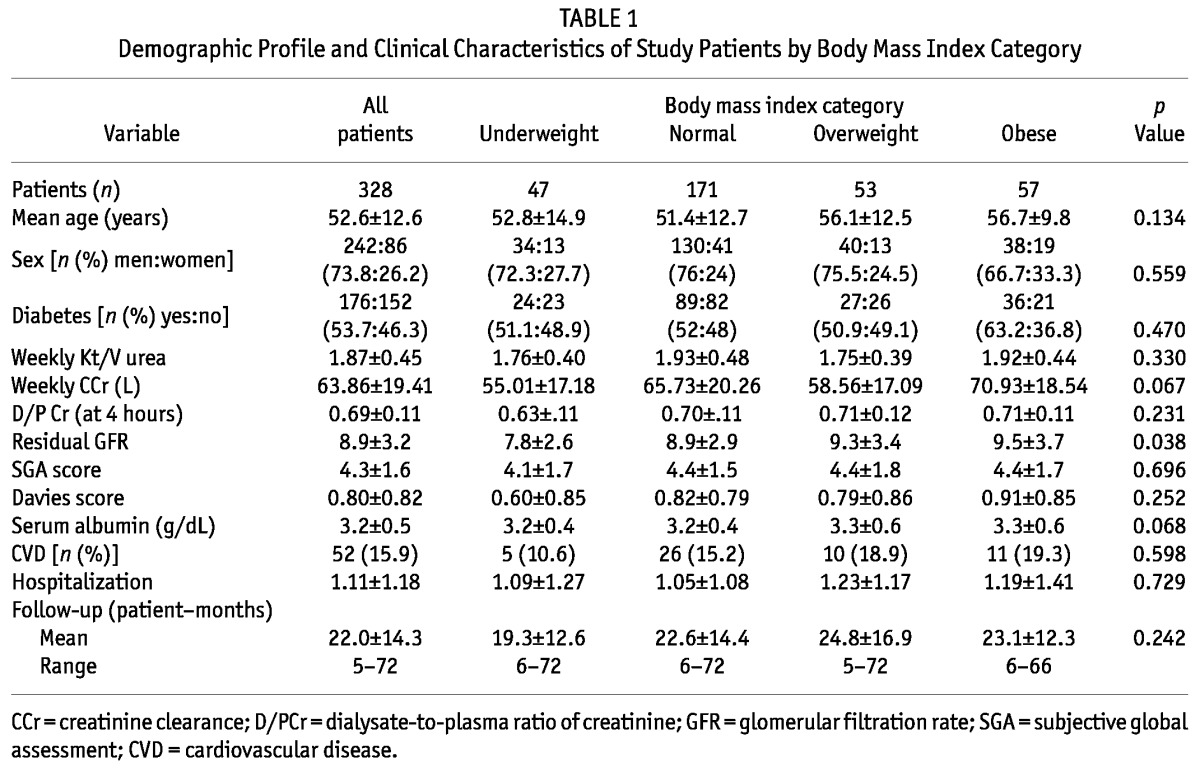
More than half the patients included in the study (53.7%) had diabetes. The proportion of diabetic patients in each group was not statistically different. Baseline parameters of dialysis adequacy (weekly Kt/V urea and creatinine clearances) and peritoneal membrane character as assessed by dialysate-to-plasma ratio of creatinine at 4 hours were similar in all the groups. Compared with underweight patients, obese, overweight, and normal-weight patients were initiated on PD at a greater mean residual GFR (p = 0.038). The overall prevalence of malnutrition (based on SGA score), serum albumin, comorbidity score (Davies index), and presence of cardiovascular disease were similar in all groups.
Of the 328 patients, 87 (26.5%) died during follow-up. Deaths among the 47 underweight, 171 normal-weight, 53 overweight, and 57 obese patients numbered 20 (42.6%), 39 (22.8%), 15 (28.3%), and 13 (22.8%) respectively (p = 0.04). The major causes of death were cardiovascular disease in 54 patients (62.1%), peritonitis and related complications in 9 patients (10.3%), sepsis in 8 patients (9.2%), malignancy in 2 patients (2.3%), pneumonia in 4 patients (4.6%), uremia and noncompliance in 6 patients (6.9%), and other unknown causes in 4 patients (4.6%) patients. Of the 176 patients with diabetes, 65 (36.9%) died; only 22 of the 152 nondiabetic patients (14.5%) died during follow-up (p < 0.001).
Hazard Ratios for Mortality and Technique Failure by BMI Category
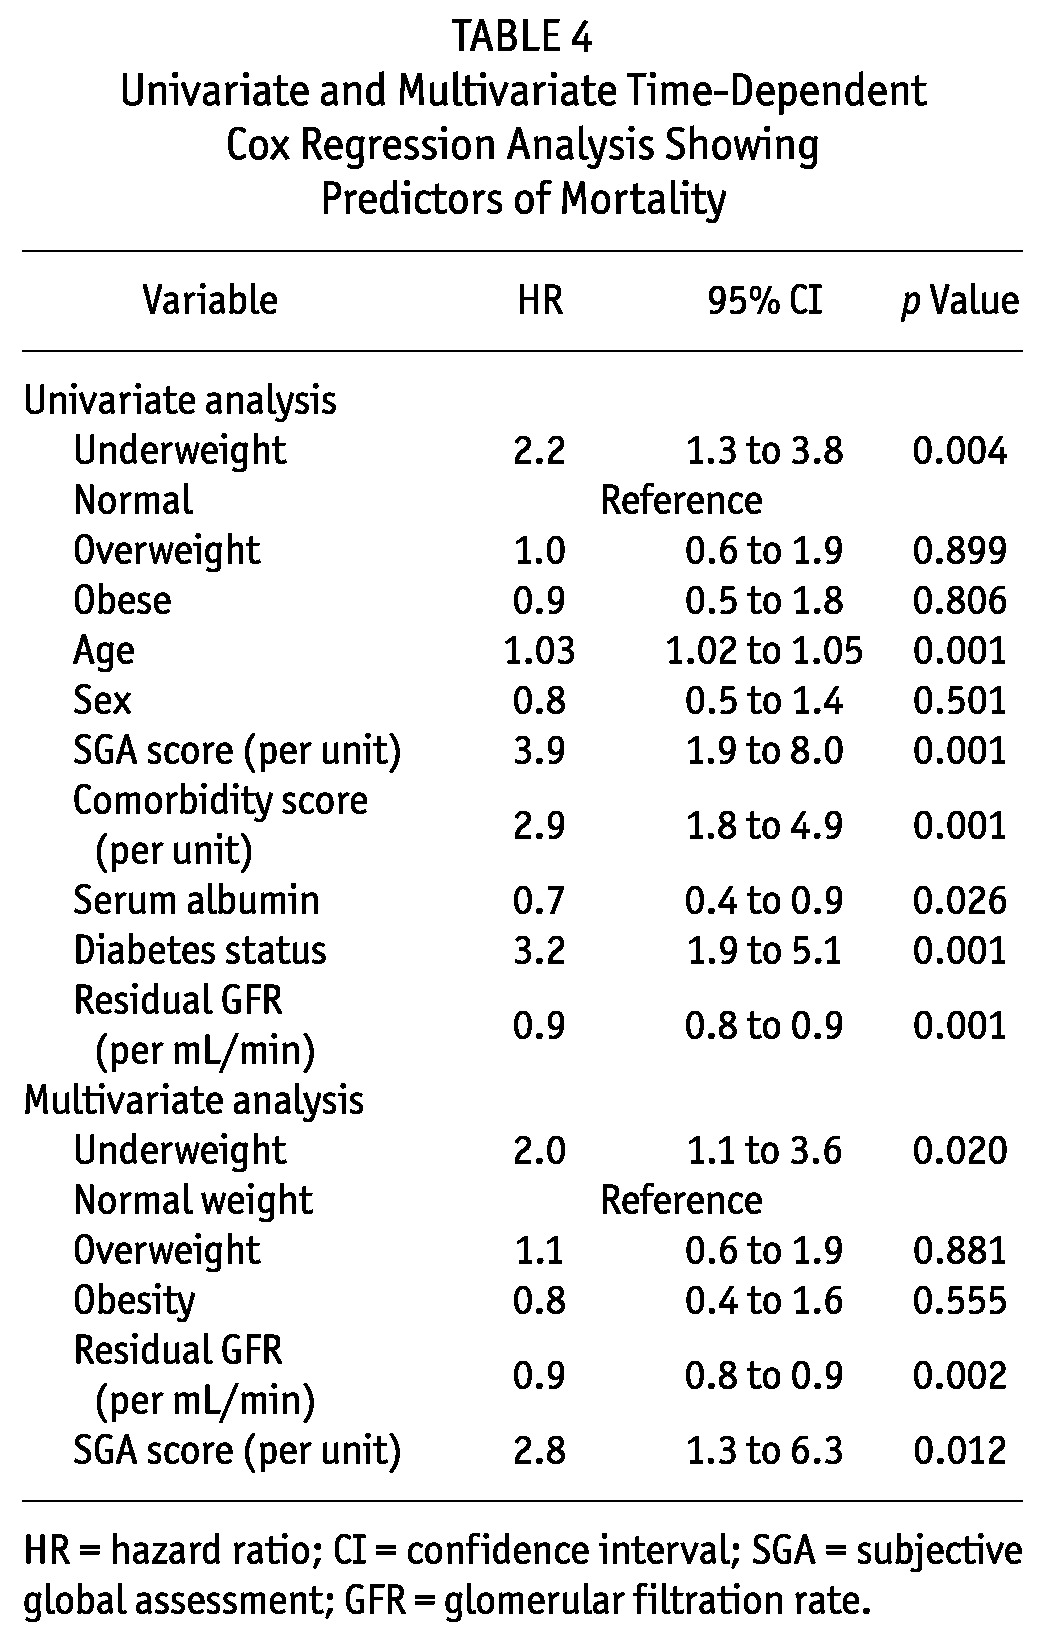
The crude (p = 0.004) and adjusted (p = 0.020) hazard ratios (HRs) for mortality—adjusted for age, SGA, comorbidities, serum albumin, diabetes, and residual GFR—were significantly greater for underweight patients (p = 0.02) than for normal-weight patients, but statistically similar in overweight and obese patients (reference category: normal-weight patients; Table 2). On analyzing the HR for mortality in diabetic and nondiabetic PD patients in the various BMI categories (Table 3), we again observed that the adjusted HR for mortality was significantly greater for underweight PD patients with diabetes [HR: 2.7; 95% confidence interval (CI): 1.5 to 5.0; p = 0.002]. The HR for mortality was statistically similar for nondiabetic PD patients in all BMI categories (reference category: normal BMI; Table 3).
TABLE 2.
Crude and Adjusted Hazard Ratio for Mortality by Body Mass Index (BMI) Category
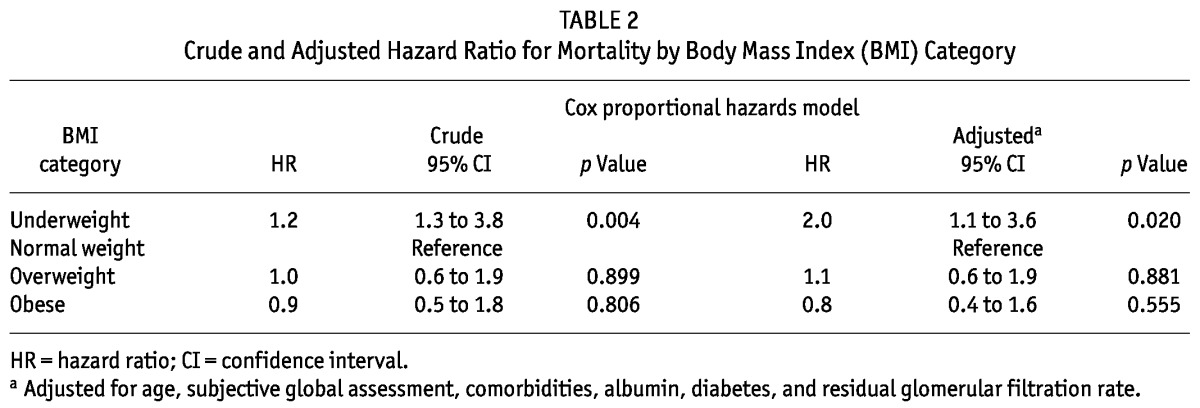
TABLE 3.
Adjusted Hazard Ratiosa for Mortality by Body Mass Index (BMI) Category in Diabetic and Nondiabetic Patients
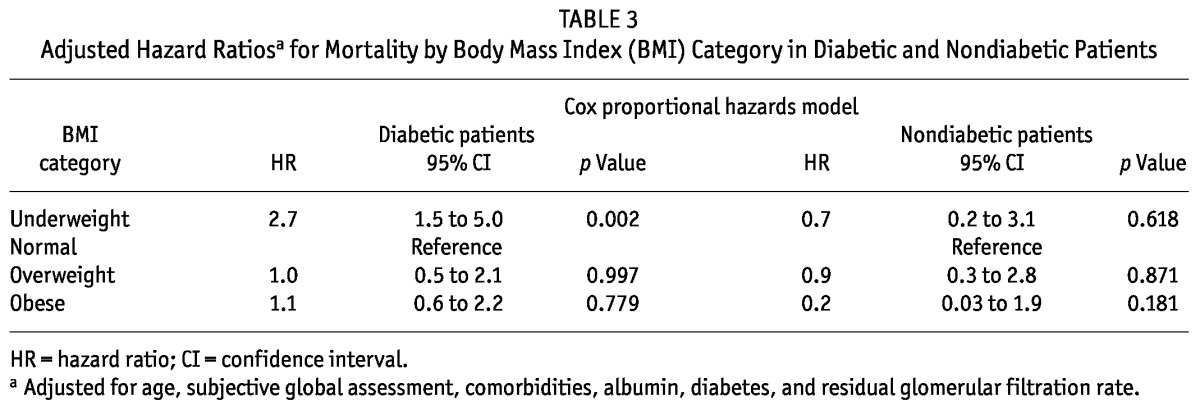
Table 4 shows the HR for mortality in time-dependent univariate and multivariate Cox regression analyses. Underweight, age, diabetes, comorbidities, serum albumin, SGA, and residual GFR were significant factors associated with mortality on univariate analysis; underweight, residual GFR, and SGA were the only factors to remain significant for mortality on multivariate analysis.
TABLE 4.
Univariate and Multivariate Time-Dependent Cox Regression Analysis Showing Predictors of Mortality
On Kaplan-Meier analysis of patient survival, median survival was significantly inferior in underweight patients (p = 0.015) than in patients having a normal BMI. The median patient survival in underweight, normal-weight, overweight, and obese patients was 26 patient-months (95% CI: 20.9 to 31.0 patient-months), 50 patient-months (95% CI: 33.6 to 66.4 patient-months), 57.7 patient-months (95% CI: 33.2 to 82.2 patient-months), and 49 (95% CI: 18.4 to 79.6 patient-months) respectively (p = 0.015). The 1-, 2-, 3-, and 5-year survivals were 88.8%, 56.4%, 31.7%, and 21.0% respectively in underweight patients; they were 93.2%, 78.4%, 63.3%, and 31.1% in normal-weight patients; 92%, 73.9%, 69.5%, and 42.9% in overweight patients; and 96.2%, 76%, 68.4%, and 34.2% in obese patients (Figure 2).
Figure 2 —
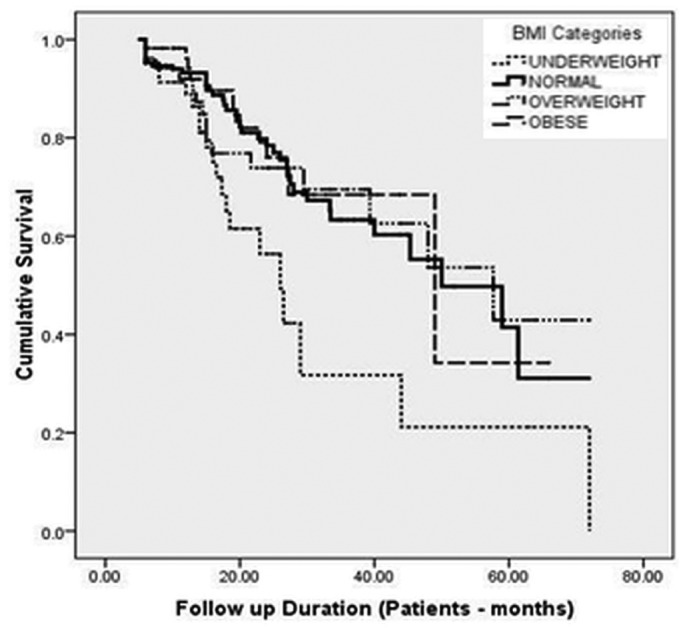
Kaplan-Meier survival analysis showing cumulative patient survival by body mass index (BMI) category.
The mean death-censored technique survival in the overall cohort was 65.3 patient-months (95% CI: 61.5 to 69.0 patient-months). In underweight patients, it was 63.2 patient-months (95% CI: 49.8 to 76.6 patient-months); it was 65.0 patient-months (95% CI: 58.6 to 71.3 patient-months) in normal-weight patients; 65.1 patient-months (95% CI: 58.0 to 72.3 patient-months) in overweight patients; and 59.5 patient-months (95% CI: 53.1 to 65.8 patient-months) in obese patients (p = 0.84). The 1-, 2-, 3-, and 5-year death-censored technique survivals were 98%, 97%, 82%, and 82% respectively in the underweight group; 98%, 96%, 96%, and 57% in the normal-weight group; 96%, 90%, 85%, and 85% in the overweight group; and 98%, 92%, 84%, and 84% in the obese group (Figure 3).
Figure 3 —
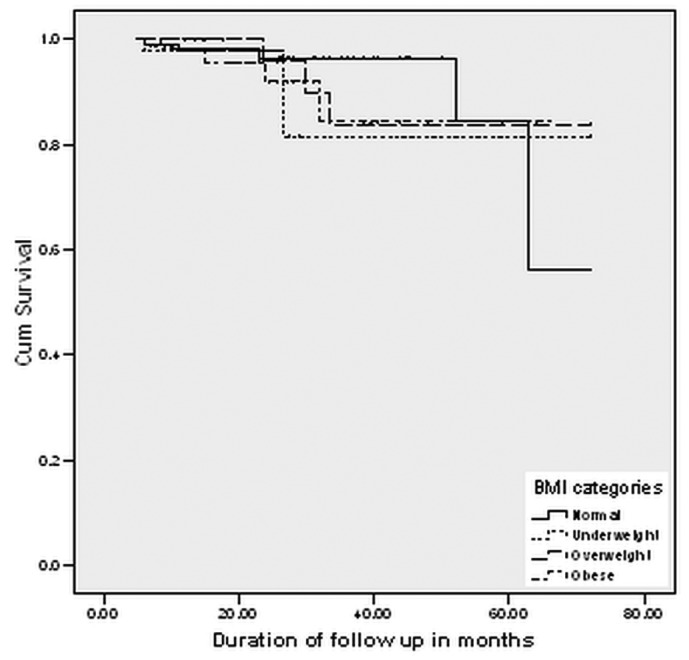
Kaplan-Meier survival analysis showing cumulative death-censored technique survival by body mass index (BMI) category.
BMI and Peritonitis
Table 5 shows the proportions of patients in each group who developed peritonitis, and the odd ratios (ORs) for developing a peritonitis episode. In reference to normal-weight patients, the OR for developing peritonitis was 1.8 (95% CI: 0.9 to 3.4; p = 0.086) in underweight patients, 1.7 (95% CI: 0.9 to 3.2; p = 0.091) in overweight patients, and 3.4 (95% CI: 1.8 to 6.4; p < 0.001) in obese patients. The percentage of patients who developed peritonitis was also significantly greater in the obese group (41 of 57, 71.9%) than in the underweight group (27 of 47, 57.4%), the normal-weight group (74 of 171, 43.3%), and the overweight group (30 of 53, 56.6%; p = 0.002; Table 5).
TABLE 5.
Odds Ratio of Developing Peritonitis, by Body Mass Index (BMI) Category
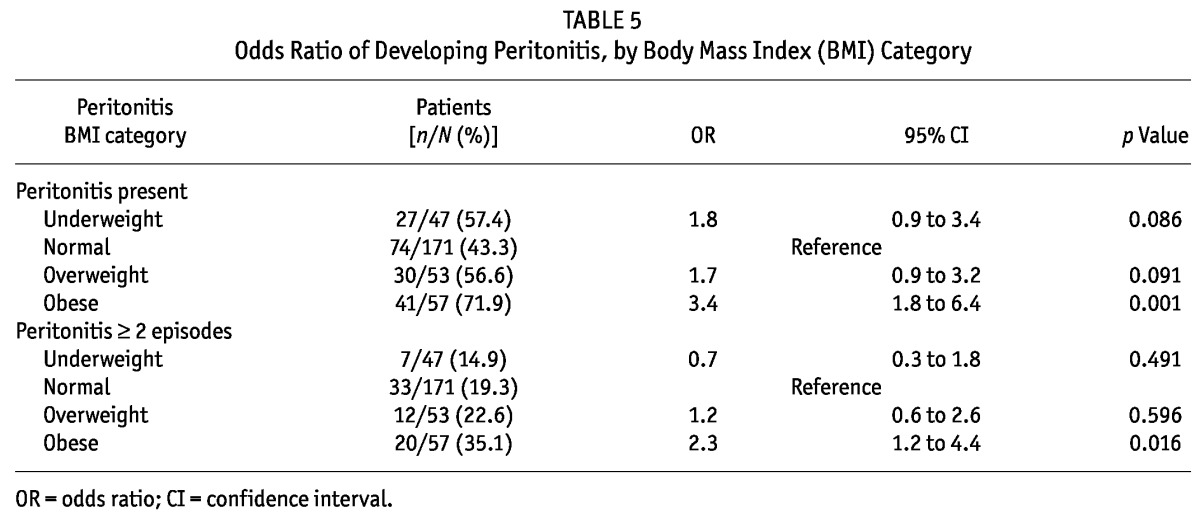
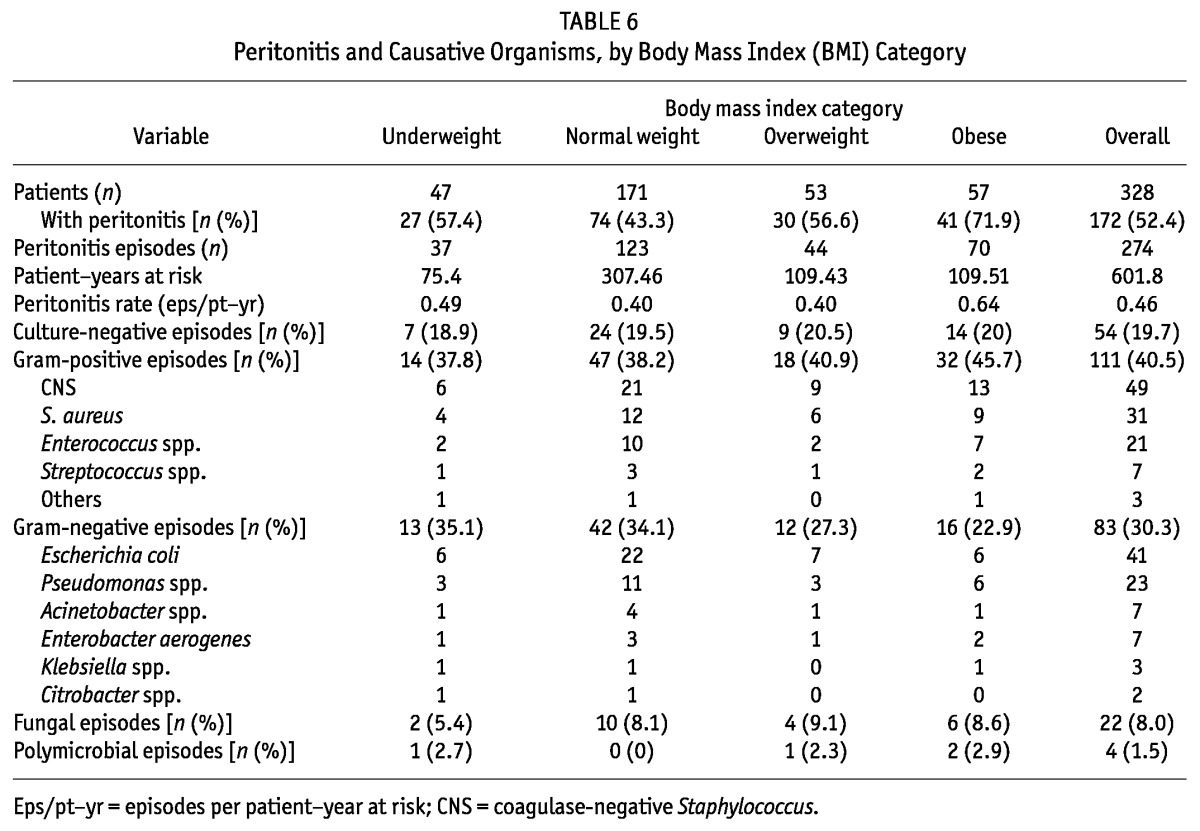
Table 6 shows details of the peritonitis rates in term of episodes per patient-year and the spectrum of organisms in the BMI categories. Peritonitis episodes were significantly more frequent in obese patients than in normal-weight (p = 0.04) and underweight (p = 0.017) patients. Peritonitis episodes per patient-year were similar in the underweight, normal-weight, and overweight patients, but it was significantly higher in obese patients. The significantly greater risk of peritonitis developing in obese patients (risk ratio: 2.97; 95% CI: 1.48 to 5.98; p = 0.002) persisted even after the model was adjusted for age, sex, diabetes, serum albumin, comorbidity score, and nutrition status by SGA.
TABLE 6.
Peritonitis and Causative Organisms, by Body Mass Index (BMI) Category
Discussion
In this study, we observed that, in the underweight category of PD patients, the crude and adjusted HRs for death were significantly worse than they were in the normal BMI categories. The evidence for improved survival in ESRD patients with a greater-than-ideal BMI on maintenance hemodialysis is well established, but such robust evidence is lacking in patients who start RRT on PD. The association of body size and survival in PD patients has been inconsistent in the literature. The results of earlier studies demonstrated beneficial (10), neutral (11,12), and deleterious (34) effects of obesity or increased BMI on PD outcomes.
A study by Johnson et al. (10) from Australia showed that obesity conferred a significant survival advantage in their PD population and that patients with a BMI greater than 27.5 lived more than twice as long as individuals whose BMI lay in the normal range (20 - 27). However, that observation from Australia was contradicted in an analysis of data from the Australia and New Zealand registry (ANZDATA), which revealed that obesity was associated with significantly worse PD patient outcomes with respect to rates of overall and technique survival (34). The authors felt that the disparity in observations might be a result of the fact that the earlier study was small (only 50 patients from a single center) and had shorter follow-up. However, in the ANZDATA study, 17% of patients were obese and 5% were morbidly obese, having BMI values of more than 35 kg/m2, which might be responsible for the poor outcomes (34).
Our study revealed that underweight patients had a greater adjusted risk of mortality, and that greater mortality risk persisted in diabetic PD patients even after adjustment for age, comorbidities, and malnutrition. One possible confounding factor for poor survival in our underweight PD patients might be lower residual renal function at initiation of RRT. As in our study, an analysis of the US Renal Data System by Stack et al. (35) found that the relative risk of death was greater for patients with a BMI less than 21 kg/m2 in his cohort of PD patients, a finding that was true for both diabetic and nondiabetic PD patients. However, those authors did not find any survival advantage associated with greater BMI values. Johnson et al. excluded patients with a BMI of less than 20 kg/m2 in their study and found a survival advantage in obese patients compared with normal-weight patients (10).
The overall mean BMI was 21.9 ± 3.8 kg/m2 in our patients, and only a few patients had a BMI greater than or equal to 30 kg/m2 (10 of 328, 3%). Those findings might be the reason that outcomes in the PD patients in our study differed from those in the ANZDATA patients. The lower BMI of ESRD patients at initiation of RRT has also been observed in another study from India (25).
A neutral effect of BMI on survival was also observed in a few studies. Fried et al. (11) and Aslam et al. (12) did not find any survival benefit with increasing body weight or BMI. After the many conflicting reports about the effect of BMI on survival in PD patients, Ramkumar et al. (16) showed that not only body size but also body composition influenced the survival of incident PD patients. The best survival was observed in PD patients with a high BMI and normal or high muscle mass; the worst survival was observed in patients with a high BMI and low muscle mass. They suggested that, during follow-up, patients on PD should be encouraged to gain muscle mass, rather than fat mass. Our study showed numerically lower median and 5-year patient survivals both in underweight and in obese patients compared with normal-weight patients. Little separation was observed in the survival curve for the initial 2 - 3 years, but the survival curves started to separate after that period (Figure 2). In the ANZDATA study also, a separation in the survival curves for the various BMI categories was apparent only after 2.5 - 3 years (34). In the ADEMEX study, Paniagua et al. (36) stratified patient outcomes using tertiles of 3 different indices of body size, and they found no significant differences in survival rates between the strata. Their subjects were monitored for only slightly more than 2 years, however.
We observed that diabetic PD patients who were underweight at PD initiation had poor outcomes and carried the highest risk of mortality (p = 0.002). The poor survival outcome in underweight PD patients with diabetes was consistent with the findings of Johansen et al., who also observed that diabetic patients had poor physical function and inferior survival and that underweight ESRD patients had a higher incidence of comorbidities, including diabetes (37). The death-censored technique survival was similar in all BMI groups; however non-death-censored technique survival was significantly poorer in the underweight group than in the other BMI groups because of a significantly greater number of deaths in that group.
The other important observation in our study was the association of peritonitis with obesity in PD patients. Of 57 obese patients, 41 (71.9%) experienced at least 1 episode of peritonitis; in patients with a normal BMI, the proportion was 43.3%. Moreover, the percentage of patients experiencing multiple episodes of peritonitis was also significantly higher in obese patients.
Few studies have estimated the influence of BMI on peritonitis. Two small studies—one prospective and one retrospective—failed to find any significant effect of a greater compared with a normal BMI on the incidence of peritonitis in PD patients (17,18). In our study, obese PD patients had a 3.4 times greater risk of developing peritonitis than did normal-weight patients. The ANZDATA analysis similarly showed that obese patients are at greater risk of developing peritonitis and that increasing BMI is associated with earlier and more frequent peritonitis. Contrary to the observations of the ANZDATA study, Piraino et al. found a lower incidence of peritonitis in an underweight group compared with a normal-weight group. We did not find such a benefit in underweight patients in the present study. One reason for the lack of such a benefit might be the lower residual GFR in our underweight patients. Lower residual GFR has been reported to be associated with a greater risk of peritonitis (38). In a recently published study of 938 Canadian PD patients, Nessim et al. (39) reported that obesity was not associated with an increased overall risk of peritonitis, but might be associated with a higher risk of peritonitis caused by coagulase-negative Staphylococcus.
The mechanism of the greater risk of peritonitis in obese patients remains speculative. One possible mechanism might be greater difficulty in exit-site care and assessment because of increased abdominal girth. Other speculative mechanisms are poor wound healing and decreased resistance to infection in fat tissues, a greater tendency toward underdialysis, and a more rapid loss of residual renal function in obese individuals, all of which might possibly lead to a higher incidence of peritonitis (40). Although obese patients experienced a significantly greater incidence of peritonitis in our study, death-censored technique failure did not differ significantly in the BMI groups.
Our study has both strengths and limitations. The patients were categorized as underweight, normal weight, overweight, and obese according to a new classification validated for Asian patients. Accordingly, patients who would be in the normal BMI category by World Health Organization classification (18.5 kg/m2 - 25 kg/m2) were classified as underweight (<18.5 kg/m2), normal-weight (18.5 - 22.9 kg/m2), overweight (23 - 24.9 kg/m2), or obese (≥25 kg/m2) in our study.
Our study is the first to show the effect of initial BMI on survival in Indian PD patients. The study was conducted at one of the largest centers for PD in South Asia and in the most densely populated state in India, Uttar Pradesh, which is truly representative of India. Compared with other study cohorts reported in literature, our study patients had a reasonably longer duration of follow-up. The major limitations of our study are its status as a single-center study, the fact that changes in BMI were not recorded during subsequent follow-up, and the lack of an analysis of how changes in BMI affected PD outcomes. Other major limitations are that data about body composition and C-reactive protein were not available for all the PD patients and that obese and overweight patients were not classified based on their body composition.
Conclusions
Compared with patients having a normal BMI, underweight PD patients are at increased risk for mortality. The HR for mortality was higher in underweight PD patients with diabetes than in patients with a normal BMI; however, for underweight PD patients without diabetes, the HR was similar. On follow-up, we observed no effect of initial BMI on death-censored technique survival in our PD patients. Compared with other BMI categories of patients, obese patients are at increased risk of developing peritonitis.
Disclosures
The authors declare that no financial conflicts of interest exist.
References
- 1. Byers T. Body weight and mortality. N Engl J Med 1995; 333:723–4 [DOI] [PubMed] [Google Scholar]
- 2. Manson JE, Willett WC, Stampfer MJ, Colditz GA, Hunter DJ, Hankinson SE, et al. Body weight and mortality among women. N Engl J Med 1995; 333:677–85 [DOI] [PubMed] [Google Scholar]
- 3. Lysaght MJ. Maintenance dialysis population dynamics: current trends and long-term implications. J Am Soc Nephrol 2002; 13(Suppl 1):37–40 [PubMed] [Google Scholar]
- 4. Xue JL, Ma JZ, Louis TA, Collins AJ. Forecast of the number of patients with end-stage renal disease in United States to the year 2010. J AmSoc Nephrol 2001; 12:2753–8 [DOI] [PubMed] [Google Scholar]
- 5. Leavey SF, McCullough K, Hecking E, Goodkin D, Port FK, Young EW. Body mass index and mortality in “healthier” as compared with “sicker” haemodialysis patients: results from the Dialysis Outcomes and Practice Patterns Study (DOPPS). Nephrol Dial Transplant 2001; 16:2386–94 [DOI] [PubMed] [Google Scholar]
- 6. Leavey SF, Strawderman RL, Jones CA, Port FK, Held PJ. Simple nutritional indicators as independent predictors of mortality in hemodialysis patients. Am J Kidney Dis 1998; 31:997–1006 [DOI] [PubMed] [Google Scholar]
- 7. Fleischmann E, Teal N, Dudley J, May W, Bower JD, Salahudeen AK. Influence of excess weight on mortality and hospital stay in 1346 hemodialysis patients. Kidney Int 1999; 55:1560–7 [DOI] [PubMed] [Google Scholar]
- 8. Kopple JD, Zhu X, Lew NL, Lowrie EG. Body weight-for-height relationships predict mortality in maintenance hemodialysis patients. Kidney Int 1999;56:1136–48 [DOI] [PubMed] [Google Scholar]
- 9. Glanton CW, Hypolite IO, Hshieh PB, Agodoa LY, Yuan CM, Abbott KC. Factors associated with improved short term survival in obese end stage renal disease patients. Ann Epidemiol 2003; 13:136–43 [DOI] [PubMed] [Google Scholar]
- 10. Johnson DW, Herzig KA, Purdie DM, Chang W, Brown AM, Rigby RJ, et al. Is obesity a favorable prognostic factor in peritoneal dialysis patients? Perit Dial Int 2000; 20:715–21 [PubMed] [Google Scholar]
- 11. Fried L, Bernardini J, Piraino B. Neither size nor weight predicts survival in peritoneal dialysis patients. Perit Dial Int 1996; 16:357–61 [PubMed] [Google Scholar]
- 12. Aslam N, Bernardini J, Fried L, Piraino B. Large body mass index does not predict short-term survival in peritoneal dialysis patients. Perit Dial Int 2002; 22:191–6 [PubMed] [Google Scholar]
- 13. Nolph KD, Sorkin M, Rubin J, Arfania D, Prowant B, Fruto L, et al. Continuous ambulatory peritoneal dialysis: three-year experience at one center. Ann Intern Med 1980; 92:609–13 [DOI] [PubMed] [Google Scholar]
- 14. Thomson NM, Atkins RC, Humphery TJ, Agar JM, Scott DF. Continuous ambulatory peritoneal dialysis (CAPD): an established treatment for end stage renal failure. Aust N Z J Med 1983; 13:489–96 [DOI] [PubMed] [Google Scholar]
- 15. Thamer M, Hwang W, Fink NE, Sadler JH, Wills S, Levin NW, et al. US nephrologists’ recommendation of dialysis modality: results of a national survey. Am J Kidney Dis 2000; 36:1155–65 [DOI] [PubMed] [Google Scholar]
- 16. Ramkumar N, Pappas LM, Beddhu S. Effect of body size and body composition in survival of peritoneal dialysis patients. Perit Dial Int 2005; 25:461–9 [PubMed] [Google Scholar]
- 17. Afthentopoulos IE, Oreopoulos DG. Is CAPD an effective treatment for ESRD patients with a weight over 80 kg? Clin Nephrol 1997; 47:389–93 [PubMed] [Google Scholar]
- 18. Piraino B, Bernardini J, Centa PK, Johnston JR, Sorkin MI. The effect of body weight on CAPD related infections and catheter loss. Perit Dial Int 1991; 11:64–8 [PubMed] [Google Scholar]
- 19. McDonald SP, Collins JF, Rumpsfeld M, Johnson DW. Obesity is a risk factor for peritonitis in the Australian and New Zealand peritoneal dialysis patient populations. Perit Dial Int 2004; 24:340–6 [PubMed] [Google Scholar]
- 20. Fried LF, Bernardini J, Johnston JR, Piraino B. Peritonitis influences mortality in peritoneal dialysis patients. J Am Soc Nephrol 1996; 7:2176–82 [DOI] [PubMed] [Google Scholar]
- 21. Johnson DW, Dent H, Hawley CM, McDonald SP, Rosman JB, Brown FG, et al. Associations of dialysis modality and infectious mortality in incident dialysis patients in Australia and New Zealand. Am J Kidney Dis 2009; 53:290–7 [DOI] [PubMed] [Google Scholar]
- 22. Prasad N, Gupta A, Sharma RK, Prasad KN, Gulati S, Sharma AP. The spectrum of bacterial peritonitis in CAPD patients in a developing country: is it different? Perit Dial Int 2003; 23:400–2 [PubMed] [Google Scholar]
- 23. Ghali JR, Bannister KM, Brown FG, Rosman JB, Wiggins KJ, Johnson DW, et al. Microbiology and outcomes of peritonitis in Australian peritoneal dialysis patients. Perit Dial Int 2011; 31:651–62 [DOI] [PubMed] [Google Scholar]
- 24. Abraham G, Pratap B, Sankarasubbaiyan S, Govind P, Nayak KS, Sheriff R, et al. Chronic peritoneal dialysis in South Asia—challenges and future. Perit Dial Int 2008; 28:13–19 [PubMed] [Google Scholar]
- 25. Abraham G, Kumar V, Nayak KS, Ravichandran R, Srinivasan G, Krishnamurthy M, et al. Predictors of long-term survival on peritoneal dialysis in South India: a multicenter study. Perit Dial Int 2010; 30:29–34 [DOI] [PubMed] [Google Scholar]
- 26. WHO Expert Consultation. Appropriate body-mass index for Asian populations and its implications for policy and intervention strategies. Lancet 2004; 363:157–63 [DOI] [PubMed] [Google Scholar]
- 27. World Health Organization, International Association for the Study of Obesity, International Obesity Task Force. The Asia-Pacific Perspective: Redefining Obesity and Its Treatment. Sydney, Australia: Health Communications Australia; 2000. [Google Scholar]
- 28. Anuurad E, Shiwaku K, Nogi A, Kitajima K, Enkhmaa B, Shimono K, et al. The new BMI criteria for Asians by the regional office for the western pacific region of WHO are suitable for screening of overweight to prevent metabolic syndrome in elder Japanese workers. J Occup Health 2003; 45:335–43 [DOI] [PubMed] [Google Scholar]
- 29. Enas EA. Coronary artery disease epidemic in Indians: a cause for alarm and a call for action. J Indian Med Assoc 2000; 98:694-5,697-702 [PubMed] [Google Scholar]
- 30. Misra A, Pandey RM, Devi JR, Sharma R, Vikram NK, Khanna N. High prevalence of diabetes, obesity, and dyslipidaemia in urban slum population in northern India. Int J Obes Relat Metab Disord 2001; 25:1722–9 [DOI] [PubMed] [Google Scholar]
- 31. Prasad N, Gupta A, Sinha A, Singh A, Sharma RK, Kumar A, et al. A comparison of outcomes between diabetic and nondiabetic CAPD patients in India. Perit Dial Int 2008; 28:468–76 [PubMed] [Google Scholar]
- 32. Churchill DN, Taylor DW, Keshaviah PR, and the CANUSA Peritoneal Dialysis Study Group. Adequacy of dialysis and nutrition in continuous peritoneal dialysis: association with clinical outcomes. J Am Soc Nephrol 1996; 7:198–207 [DOI] [PubMed] [Google Scholar]
- 33. Davies SJ, Phillips L, Naish PF, Russell GI. Quantifying comorbidity in peritoneal dialysis patients and its relationship to other predictors of survival. Nephrol Dial Transplant 2002; 17:1085–92 [DOI] [PubMed] [Google Scholar]
- 34. Mcdonald SP, Collins JF, Johnson DW. Obesity is associated with worse peritoneal dialysis outcomes in the Australia and New Zealand patient populations. J Am Soc Nephrol 2003; 14:2894–901 [DOI] [PubMed] [Google Scholar]
- 35. Stack AG, Murthy BV, Molony DA. Survival differences between peritoneal dialysis and hemodialysis among “large” ESRD patients in the United States. Kidney Int 2004; 65:2398–408 [DOI] [PubMed] [Google Scholar]
- 36. Paniagua R, Amato D, Vonesh E, Correa-Rotter R, Ramos A, Moran J, et al. on behalf of the Mexican Nephrology Collaborative Study Group. Effects of increased peritoneal clearances on mortality rates in peritoneal dialysis: ADEMEX, a prospective, randomized, controlled trial. J Am Soc Nephrol 2002; 13:1307–20 [DOI] [PubMed] [Google Scholar]
- 37. Johansen KL, Kutner NG, Young B, Chertow GM. Association of body size with health status in patients beginning dialysis. Am J Clin Nutr 2006; 83:543–9 [DOI] [PubMed] [Google Scholar]
- 38. Singhal MK, Bhaskaran S, Vidgen E, Bargman JM, Vas SI, Oreopoulos DG. Rate of decline of residual renal function in patients on continuous peritoneal dialysis and factors affecting it. Perit Dial Int 2000; 20:429–38 [PubMed] [Google Scholar]
- 39. Nessim SJ, Komenda P, Rigatto C, Verrelli M, Sood MM. Frequency and microbiology of peritonitis and exit-site infection among obese peritoneal dialysis patients. Perit Dial Int 2013; 33:167–74 [DOI] [PMC free article] [PubMed] [Google Scholar]
- 40. Johnson DW, Mudge DW, Sturtevant JM, Hawley CM, Campbell SB, Isbel NM, et al. Predictors of residual renal function decline in new peritoneal dialysis patients. Perit Dial Int 2003; 23:276–83 [PubMed] [Google Scholar]


