Abstract
♦ Background: Fluid overload probably contributes to the cardiovascular risk of peritoneal dialysis (PD) patients. We studied the relationship between over-hydration as determined by bioimpedance spectroscopy and dialysis adequacy, nutritional status, and arterial stiffness in Chinese PD patients.
♦ Methods: We studied 122 asymptomatic prevalent PD patients: bioimpedance spectroscopy, arterial pulse wave velocity, dialysis adequacy and nutritional status were determined.
♦ Results: Of the 122 patients, 88 (72.1%) had over-hydration of ≥ 1 L, while 25 (20.5%) were ≥ 5 L. Over-hydration significantly correlated with total body water (r = 0.474, p < 0.001) and extracellular water (r = 0.755, p < 0.001). Over-hydration was more severe in male and diabetic patients, and significantly correlated with Charlson’s comorbidity score, blood pressure, body mass index, body weight, peritoneal transport characteristics, and carotid-femoral pulse wave velocity. Over-hydration significantly correlated with Kt/V (r = -0.287, p = 0.016), serum albumin level (r = -0.465, p < 0.001) and malnutrition inflammation score (r = 0.410, p = 0.006), but not residual renal function.
♦ Conclusion: Over-hydration is common in asymptomatic Chinese PD patients. The degree of over-hydration is particularly pronounced in patients who are inadequately dialyzed, have multiple comorbid conditions and low serum albumin levels. Over-hydration is associated with high blood pressure and arterial stiffness, and may contribute to the excessive risk of cardiovascular disease in this group of patients.
Keywords: Peritoneal dialysis, fluid overload, body composition monitor
End-stage renal disease (ESRD) is one of the most debilitating chronic medical illnesses. In Hong Kong, there were more than 4,300 patients on long-term dialysis in 2010 (1). Peritoneal dialysis (PD) is the preferred mode of renal replacement therapy in Hong Kong and accounts for 75% of patients requiring dialysis in Hong Kong (1). Cardiovascular disease is the major cause of mortality and morbidity in PD patients (2,3). In addition to the classic risk factors of atherosclerosis such as diabetes, hypertension and hyperlipidemia, uremia and possibly the dialysis procedure per se play important roles in the pathogenesis of accelerated atherosclerosis in renal failure patients (4). For PD patients, chronic intravascular hypervolemia has been implicated as an important contributing factor of cardiovascular disease (5-7).
Unfortunately, there is no simple and reliable method for the evaluation of volume status in PD patients (5). Physical examination for the presence of ankle edema or elevated jugular venous pressure is not absolutely reliable and could only detect grossly abnormal body water volume. Traditionally, body fluid compartment is measured by solute or isotope dilution methods, but the tests are cumbersome and hardly ever used in routine clinical practice. More recently, measurement of vascular pedicle width (VPW) and cardiothoracic ratio (CTR) in chest radiograph (CXR) was found to be a reliable non-invasive surrogate marker of intravascular volume status in critically ill patients (8-10). Our group recently also showed that the change in CTR is an independent predictor of hospitalization-free survival in chronic PD patients (11). Besides intravascular volume, however, VPW and CTR do not assess other body fluid compartments.
In this respect, the use of bioimpedance spectroscopy body composition monitor (BCM) has been proposed. BCM measures at 50 frequencies over a range from 5 to 1,000 kHz to determine the electrical resistance of the total body water (TBW) and the extracellular water (ECW). In essence, while high frequency current passes through the TBW, low frequency current cannot penetrate cell membranes and thus flows exclusively through the ECW. Clinically relevant output parameters, including lean tissue mass, adipose tissue mass and volume of over-hydration, would be measured within a short time. Extensive validation tests in dialysis patients have been performed on BCM (12,13). In the present study, we explored the relation between body composition parameters, dialysis adequacy, nutritional status, and degree of arterial stiffness in an unselected group of stable chronic PD patients.
Patients and Methods
Patient Selection
Consecutive chronic PD patients who were followed up in our dialysis unit for at least three months were invited to join the study. We excluded patients who declined consent, could not achieve an edema-free status, who were unlikely to survive for six months, who planned to have elective living donor transplant or transfer to another renal center within six months. This study was approved by our local clinical research ethics committee.
After informed consent was given, patients underwent clinical assessment, which included checking for the history of myocardial infarction, coronary intervention, stroke, transient ischemic attack, or amputation for peripheral vascular disease, any symptom of angina, heart failure or intermittent claudication. On the date of assessment, we measured blood pressure, body weight (BW), body height, and body mass index (BMI). Blood was taken for the measurement of serum albumin, urea and creatinine. Assessment included bioimpedance spectroscopy BCM, arterial pulse wave velocity, as well as dialysis adequacy and nutritional assessment.
Background Data and Co-Morbidities
A panel of comorbid conditions, including coronary artery disease, heart failure, peripheral vascular disease, cerebrovascular disease, dementia, chronic pulmonary disease, connective tissue disorder, peptic ulcer disease, liver disease, diabetes with and without complications, hemiplegia, malignancy and acquired immunodeficiency syndrome (AIDS), were recorded. The modified Charlson’s Comorbidity Index, which was validated in PD patients (14), was used to calculate a comorbidity score.
Measurement of Body Composition
We used the Body Composition Monitor (Fresenius Medical Care, Germany). Briefly, electrodes were attached to one hand and one foot with the patient in a supine position. After patient cable was connected, the measurement would complete automatically in two minutes. We computed the following parameters from this test: total body water (TBW), intracellular water (ICW), extracellular water (ECW), lean tissue mass (LTM), adipose tissue mass, and volume of over-hydration. Secondary parameters including percentage of LTM and extracellular-to-intracellular (E/I) body water ratio (i.e., ratio between ECW and ICW) were also calculated.
Pulse Wave Velocity Study
Pulse wave velocity (PWV), an index of aortic stiffness, was measured using an automatic computerized recorder and the results were analyzed using the Complior SP program (Artech Medical, France). The method of PWV measurement was described previously (15). Briefly, pressure-sensitive transducers were placed over the neck (carotid artery), wrist (radial artery) and groin (femoral artery) with the patient in the supine position within one week of Peritoneal Equilibrium Test (PET). PWV of the carotid-femoral and carotid-radial territory was calculated by dividing the distance between the sensors by the time corresponding to the period separating the start of the rising phase of the carotid pulse wave and that of the femoral and also the radial pulse waves. All measurements were performed by the same observer.
Dialysis Adequacy and Nutritional Status
Dialysis adequacy was assessed by 24-hour dialysate and urine collections. Total weekly Kt/V was determined by standard methods (16). Residual glomerular filtration rate (GFR) was calculated as the average of 24-hour urinary urea and creatinine clearance (17).
Nutritional status was represented by serum albumin level, subjective global assessment (SGA) comprehensive malnutrition-inflammation score (MIS), normalized protein nitrogen appearance (NPNA), and percentage of fat-free edema-free body mass (FEBM). For SGA, the 4-item 7-point scoring system, which was validated in PD patients (18), was used. The calculation of MIS was described previously (19). Briefly, MIS consists of 4 main parts and 10 components, all scored from 0 (normal) to 3 (very severe). The total score ranged from 0 to 30. NPNA was determined by the Bergstrom’s formula (20). FEBM was measured by creatinine kinetics according to the formula of Forbes and Bruning (21).
Statistical Analysis
Statistical analysis was performed by SPSS for Windows software version 15.0 (SPSS Inc., Chicago). Descriptive data were represented as mean ± SD. Data between groups were compared by Chi square test and Student’s t-test as appropriate. Correlation between continuous variables was explored by Spearman’s rank correlation coefficient and correlated for multiple comparison by the Bonferroni’s method. A p value of less than 0.05 was considered significant. All probabilities were two-tailed.
Results
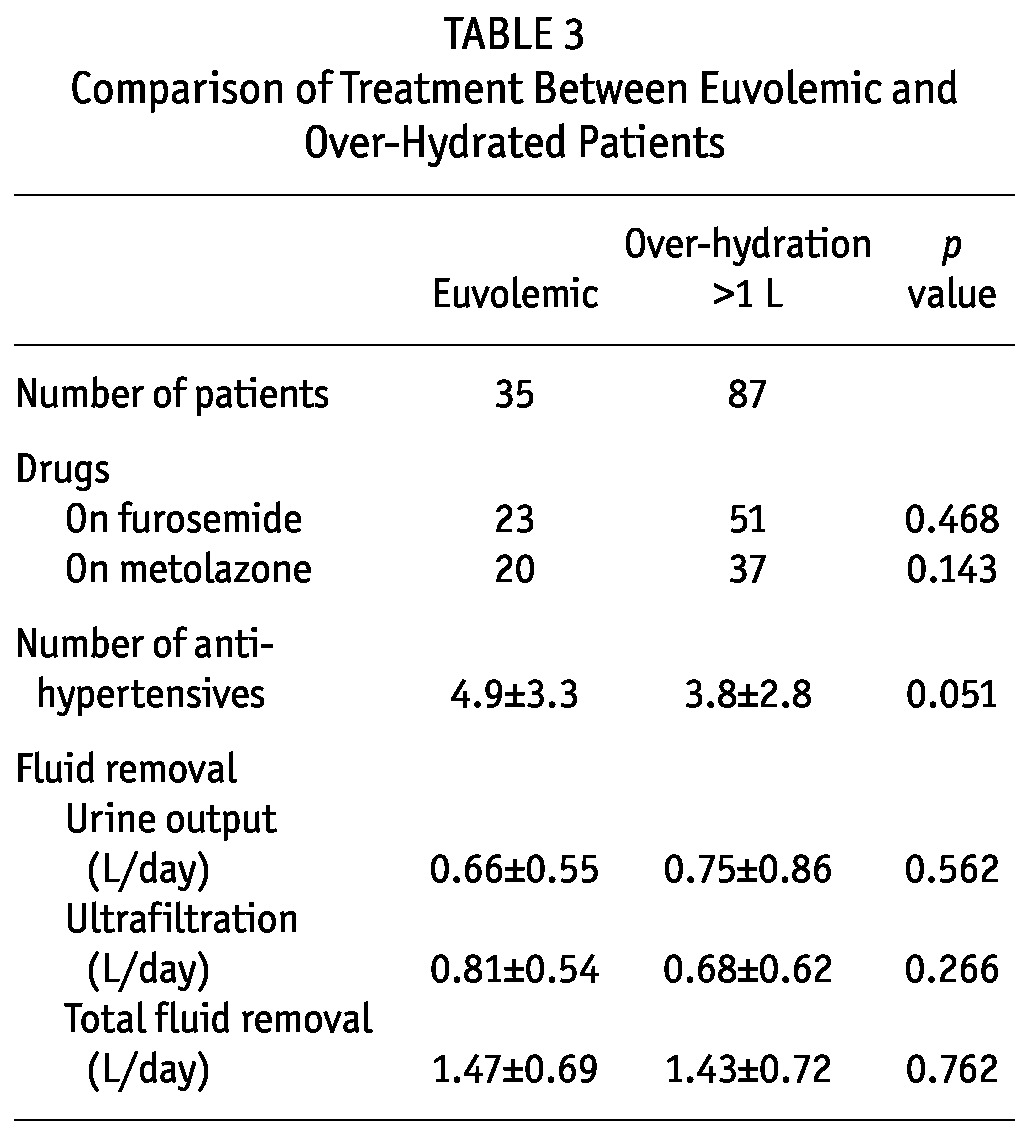
A total of 122 PD patients were recruited for the study. This represents 33% of the PD population in our dialysis unit (total number of PD patients = 366). The baseline clinical characteristics are summarized in Table 1 and baseline biochemical parameters in Table 2. There is no statistically significant difference in the use of diuretics, urine output volume and ultrafiltration from dialysis between the euvolemic and overhydrated patients (Table 3). The mean duration of dialysis was 20.9 ± 33.4 months. Most patients were on continuous ambu latory peritoneal dialysis (CAPD), and only 3 patients were on automated PD at night. The mean carotid-femoral PWV (C-F PWV) was 10.73 ± 2.30 m/s, carotid-radial PWV (C-R PWV) was 10.50 ± 1.76 m/s.
TABLE 1.
Baseline Characteristics of the Patients
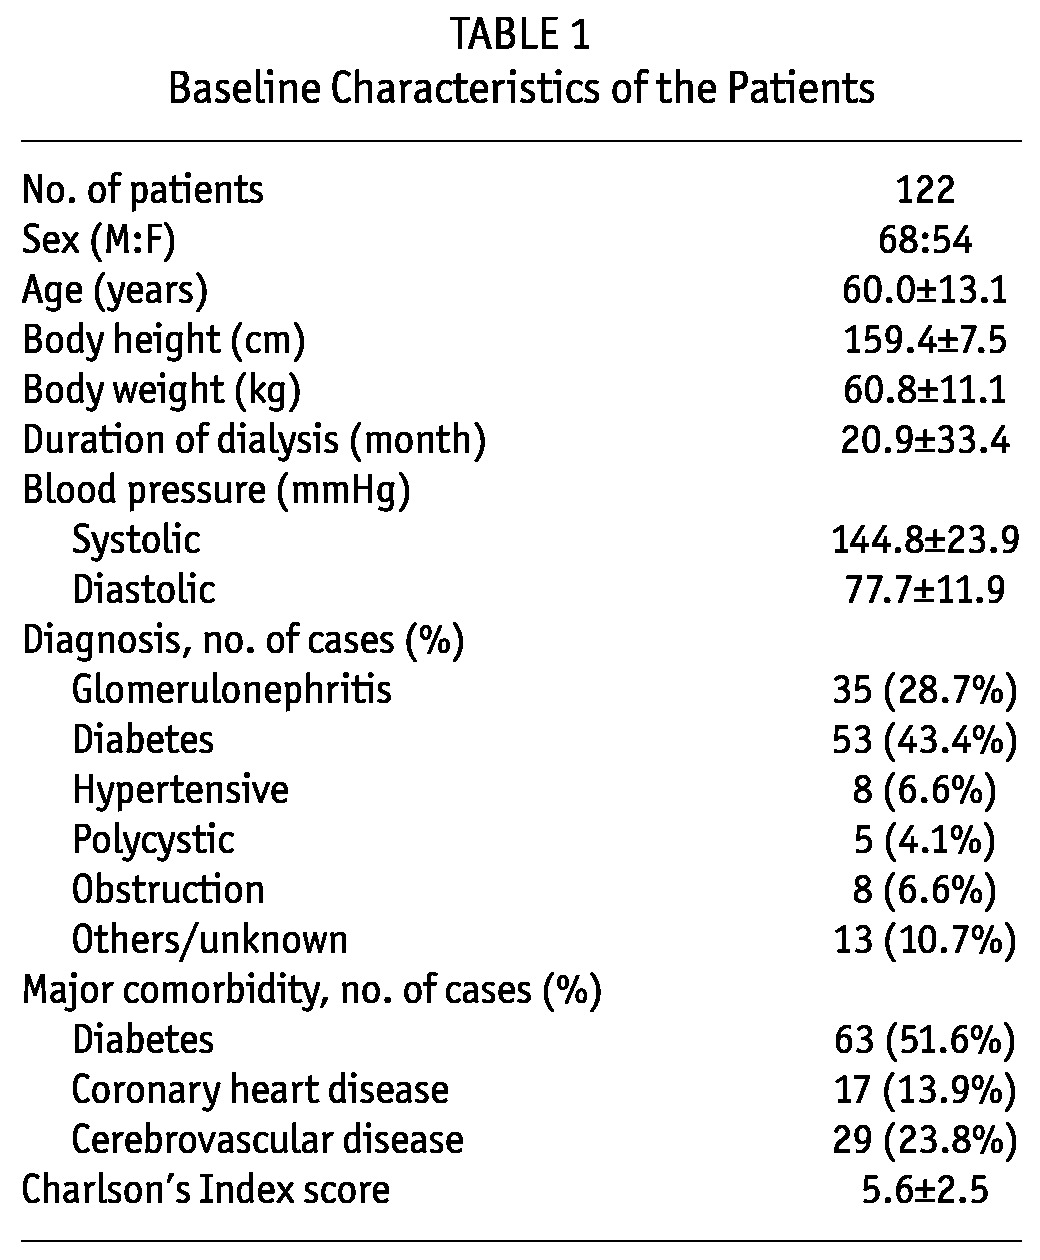
TABLE 2.
Baseline Biochemical Profile of the Patients
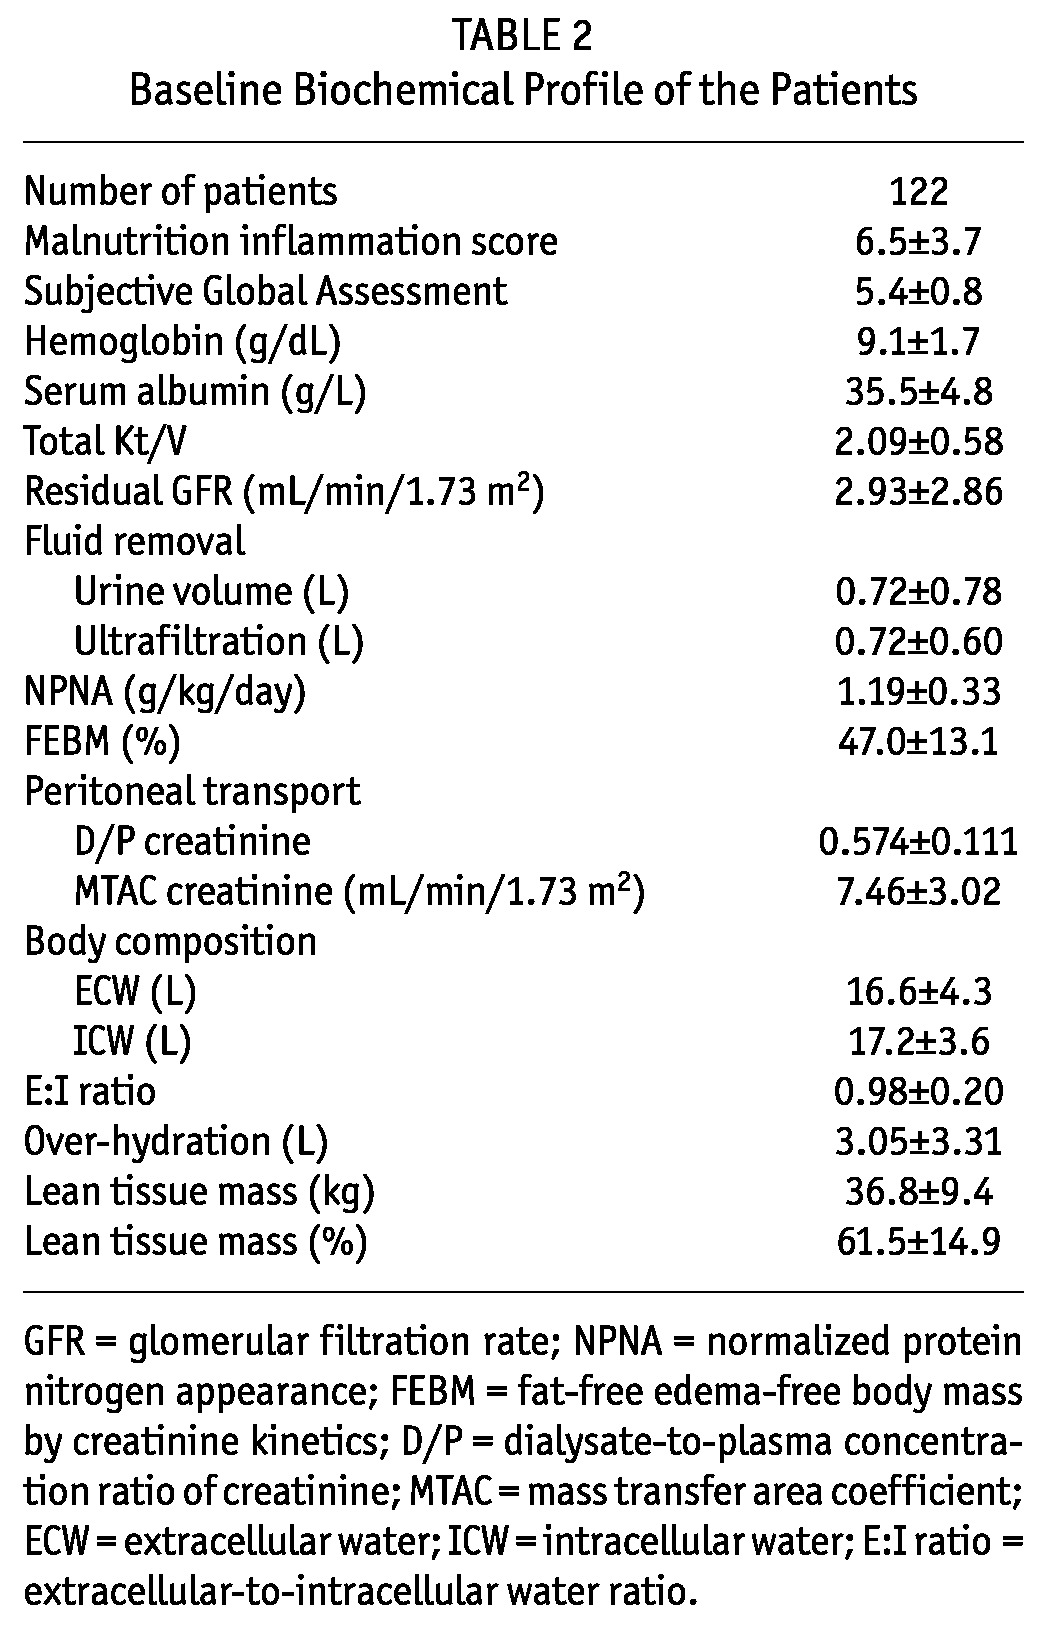
TABLE 3.
Comparison of Treatment Between Euvolemic and Over-Hydrated Patients
Body Composition
The distribution histogram of over-hydration in the 122 patients is summarized in Figure 1. Briefly, 88 patients (72.1%) had over-hydration ≥ 1 L, while 25 (20.5%) were ≥ 5 L. Over-hydration was more severe in male (3.99 ± 3.89 vs 1.86 ± 1.82 L, p < 0.001) and diabetic (4.41 ± 3.72 vs 1.59 ± 1.98 L, p < 0.001) patients. Three patients had over-hydration of more than 10 L; they were excluded from further analysis to avoid skewing of the data analysis.
Figure 1 —
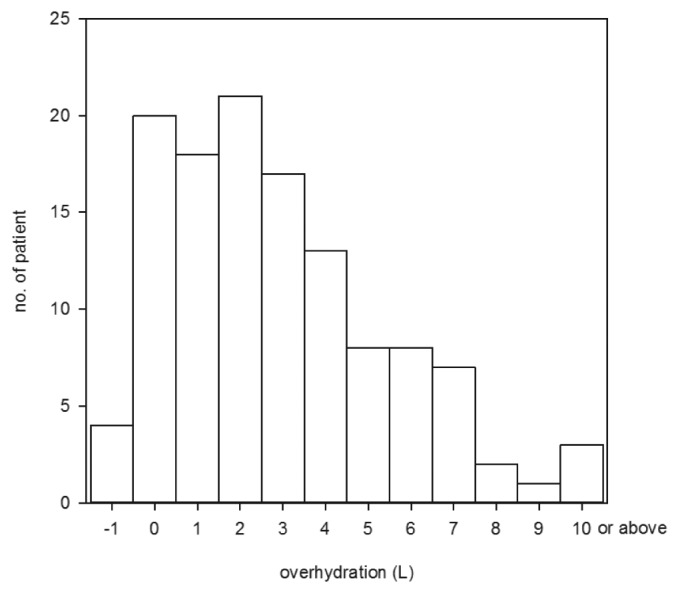
Distribution histogram of over-hydration.
There were substantial internal correlations between various BCM parameters. Notably, over-hydration had significant correlations with TBW (r = 0.474, p < 0.001), ECW (r = 0.755, p < 0.001) and E/I ratio (r = 0.837, p < 0.001). However, over-hydration did not correlate with ICW or adipose tissue mass (details not shown).
Relation with Blood Pressure
Systolic BP had significant correlations with over-hydration (r = 0.582, p < 0.001), ECW (r = 0.479, p < 0.001), and E/I ratio (r = 0.462, p < 0.001). Similarly, diastolic BP correlated with over-hydration (r = 0.182, p = 0.047) and ECW (r = 0.222, p = 0.015), although the correlations were generally less strong than those with systolic BP. Diastolic BP also correlated with LTM (r = 0.337, p < 0.001) and percentage of LTM (r = 0.304, p = 0.001).
The relation between blood pressure and over-hydration is further explored by the hydration reference plot (Figure 2). In essence, 44 patients (36.1%) of our cohort were hypertensive and had over-hydration, 21 (17.2%) were hypertensive but euvolemic, 15 (12.3%) were normotensive but had over-hydration, while only 39 (32.0%) were both normotensive and euvolemic.
Figure 2 —
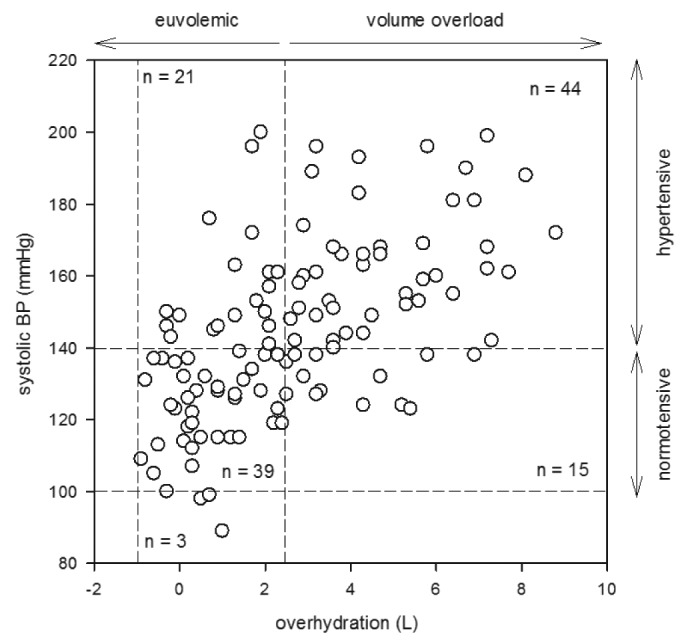
Hydration reference plot depicting the relation between over-hydration and systolic blood pressure (BP).
Correlation with Clinical Parameters
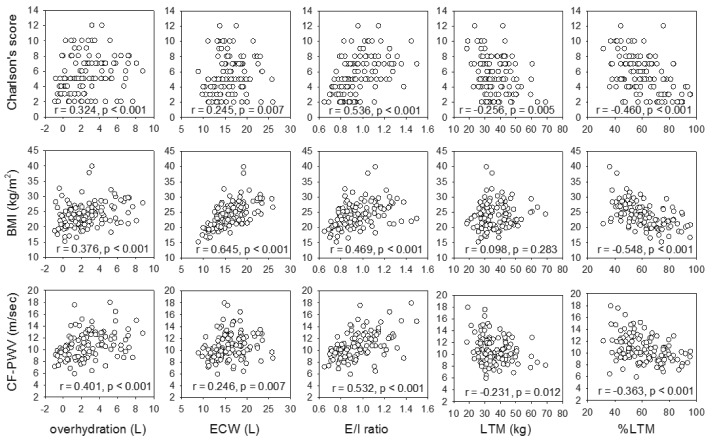
The relation between body composition parameters and clinical parameters is summarized in Figure 3. There were significant correlations between Charlson’s score and over-hydration (r = 0.324, p < 0.001), ECW (r = 0.245, p = 0.007), E/I ratio (r = 0.536, p < 0.001), and inversely with the percentage of LTM (r = -0.460, p < 0.001). There was a modest but statistically significant decline of ICW (r = -0.231, p = 0.011) and percentage of LTM (r = -0.372, p < 0.001) with age. In contrast, there was no significant correlation between age and over-hydration or ECW (details not shown).
Figure 3 —
Relation between body composition parameters and (A) Charlson’s comorbidity score; (B) body mass index (BMI); and (C) carotid-femoral pulse wave velocity (CF-PWV). ECW = extracellular water; E/I ratio = extracellular-to-intracellular water ratio; LTM = lean tissue mass; %LTM = percentage of lean tissue mass. Data were compared by Spearman’s rank correlation coefficient. P values are adjusted for multiple comparison by the Bonferroni’s method.
BMI had significant correlations with over-hydration (r = 0.376, p < 0.001), ECW (r = 0.645, p < 0.001), E/I ratio (r = 0.469, p < 0.001), and inversely with the percentage of LTM (r = -0.548, p < 0.001). Similarly, body weight correlated with over-hydration (r = 0.375, p < 0.001), ECW (r = 0.813, p < 0.001), E/I ratio (r = 0.346, p < 0.001), and inversely with the percentage of LTM (r = -0.358, p < 0.001), but the correlations were often less strong than those with BMI.
Carotid-femoral PWV significantly correlated with over-hydration (r = 0.401, p < 0.001), ECW (r = 0.246, p = 0.007), E/I ratio (r = 0.532, p < 0.001), and inversely with the percentage of LTM (r = -0.363, p < 0.001). On the other hand, carotid-radial PWV had no significant correlation with any parameter of body composition.
Peritoneal Transport, Adequacy and Nutrition
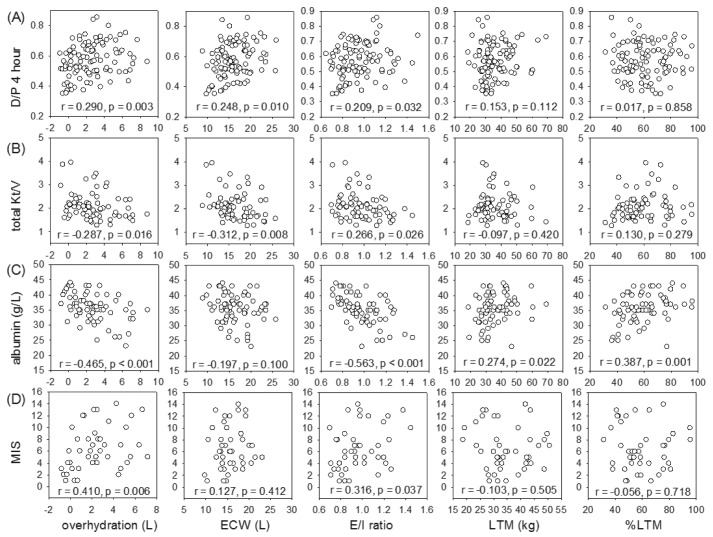
The relation between body composition parameters and peritoneal transport, dialysis adequacy and nutrition indices is summarized in Figure 4. Dialysate-to-plasma creatinine ratio (D/P) at four hours had significant correlations with over-hydration (r = 0.290, p = 0.003), ECW (r = 0.248, p = 0.010), and E/I ratio (r = 0.209, p = 0.032). Similarly, MTAC creatinine correlated with over-hydration (r = 202, p = 0.038), but the correlation was less strong than that with D/P at four hours. Total Kt/V inversely correlated with over-hydration (r = -0.287, p = 0.016), ECW (r = -0.312, p = 0.008), and E/I ratio (r = -0.266, p = 0.026). In contrast, residual GFR had a significant correlation with LTM (r = 0.284, p = 0.017), but did not correlate with over-hydration, ECW, or E/I ratio.
Figure 4 —
Relation between body composition parameters and (A) dialysate-to-plasma (D/P) creatinine ratio at 4 hours; (B) total weekly Kt/V; (C) serum albumin level; and (D) comprehensive malnutrition inflammation score (MIS). ECW = extracellular water; E/I ratio = extracellular-to-intracellular water ratio; LTM = lean tissue mass; %LTM = percentage of lean tissue mass. Data were compared by Spearman’s rank correlation coefficient. P values are adjusted for multiple comparison by the Bonferroni’s method.
Serum albumin level correlated with LTM (r = 0.274, p = 0.022), percentage of LTM (r = 0.387, p = 0.001), and inversely with over-hydration (r = -0.465, p < 0.001) and E/I ratio (r = -0.563, p < 0.001). NPNA had a modest but statistically significant correlation with LTM (r = 0.277, p = 0.020), but not with parameters of fluid overload. In contrast, MIS correlated with over-hydration (r = 0.410, p = 0.006) and E/I ratio (r = 0.316, p = 0.037), but not with LTM. There was no significant correlation between SGA score and any parameter of body composition.
Discussion
Fluid overload has been implicated as an important contributing factor of cardiovascular disease in PD patients (5-7). However, existing methodologies for the evaluation of volume status in PD patients are not entirely reliable (5). For example, dependent edema is sometimes difficult to detect, especially in non-ambulatory patients. Other physical measurements, such as change in body weight or blood pressure, are determined by many factors in addition to body fluid status. In the present study, the use of bioimpedance spectroscopy for the determination of body composition and quantification of fluid overload in PD patients was investigated. By bioimpedance spectroscopy, body composition parameters, including ECW, ICW, LTM, and over-hydration, could be measured. In a normal individual with no excess fluid, lean tissue (mainly muscle) consists of 70% water, while the remaining mass is largely protein, while adipose tissue consists of 20% water, the remaining being lipid. As a result, the proportion of lean and adipose tissue in the body would affect the ratio of ECW to ICW (i.e., the E/I ratio). In this context, over-hydration could be considered a third body compartment.
We found that fluid overload was very common in PD patients: Over 70% of the patients of our cohort had some degree of over-hydration, and 20% had over 5 L of excess fluid in their body. Over-hydration was more pronounced in male and diabetic patients, which was also noted in European PD patients (22). As expected, over-hydration had significant correlations with TBW and BMI. Since excessive body fluid accumulates more in ECW than ICW, it is logical to find a significant positive correlation between over-hydration and E/I ratio. It is interesting to note that BMI and TBW actually had a modest inverse correlation with the percentage of LTM, suggesting that over-hydration and sarcopenia tend to occur together.
But, what is the cause of over-hydration? This is probably related to a multitude of factors. We found that over-hydration inversely correlated with Kt/V, indicating that inadequately dialyzed patients were prone to over-hydration. Contrary to the general expectation, there was no correlation between over-hydration and residual renal function, possibly because residual renal function was often minimal in our cohort of prevalent patients (2.93 ± 2.86 mL/min/1.73 m2). We also found that serum albumin level inversely correlated with the degree of over-hydration. Excessive hydration could result in hemodilution and decrease in serum albumin concentration. On the other hand, hypoalbuminemia and reduction in plasma oncotic pressure could contribute to fluid accumulation in extracellular space. A low serum albumin level may also signify poor nutritional status or the presence of chronic systemic inflammation. This last possibility is further supported by our observation that over-hydration was associated with a high Charlson’s comorbidity score.
We found that over-hydration was positively associated with arterial pulse wave velocity, a marker of arterial stiffness. Our previous study showed that arterial pulse wave velocity is an independent predictor of the number of hospitalizations for cardiovascular events in PD patients (23). Taken together, these results are consistent with the notion that over-hydration contributes to the excessive risk of cardiovascular disease in PD patients.
Similar to a previous study on European PD patients (22), we found that over-hydration had a significant correlation with blood pressure. Further analysis by the hydration reference plot showed that around two-thirds of the hypertensive patients had fluid overload, which is consistent with the previous report (22). It remains unknown whether hypertensive PD patients with and without fluid overload are intrinsically different or have a different prognosis. Further studies are also needed to delineate the cardiac function and prognosis of patients with fluid overload but normal blood pressure.
Our study had several limitations. First, prevalent rather than incident PD patients were used, and there might be selection bias favoring surviving patients. Prolonged peritoneal dialysis and exposure to bioincompatible dialysis solution, on the other hand, may affect the peritoneal function, leading to inadequate ultrafiltration and fluid overload. Second, this is an observational, cross sectional study and all the measurements were taken on one occasion. Since many acute conditions may transiently affect fluid status and other clinical parameters, our results should be interpreted with caution. Repeated measurement and serial monitoring of body composition may both allow a more accurate assessment and provide prognostic information. Third, individual patients may have a variable blood pressure response to a state of fluid overload.
In summary, we found that over-hydration is common in asymptomatic Chinese PD patients. The degree of over-hydration is particularly pronounced in patients who are inadequately dialyzed, have multiple comorbid conditions and low serum albumin levels. Over-hydration is associated with high blood pressure and arterial stiffness, and may contribute to the excessive risk of cardiovascular disease in this group of patients. Further prospective studies are required to determine the long-term effect of over-hydration in PD patients.
Disclosures
Philip Kam-Tao Li and Cheuk-Chun Szeto receive research support from Fresenius Medical Care and Baxter Healthcare Corporation. The authors declare no other potential conflict of interest.
Acknowledgments
This study was supported in part by the CUHK research account 6901031 and the Richard Yu CUHK PD Research Fund.
References
- 1. USRDS 2012 Annual Data Report. [cited October 27, 2012]; Available from: http://www.usrds.org/2012/pdf/v2_ch12_12.pdf
- 2. Szeto CC, Wong TY, Leung CB, Wang AY, Law MC, Lui SF, et al. Importance of dialysis adequacy in mortality and morbidity of Chinese CAPD patients. Kidney Int 2000; 58(1):400–7 [DOI] [PubMed] [Google Scholar]
- 3. Li PK, Chow KM. The clinical and epidemiological aspects of vascular mortality in chronic peritoneal dialysis patients. Perit Dial Int 2005; 25(Suppl 3):S80–3 [PubMed] [Google Scholar]
- 4. Li PK, Kwan BC, Ko GT, Chow KM, Leung CB, Szeto CC. Treatment of metabolic syndrome in peritoneal dialysis patients. Perit Dial Int 2009; 29(Suppl 2):S149–52 [PubMed] [Google Scholar]
- 5. Szeto CC, Li PK. Salt and water balance in PD. In: Molony D, Craig J, eds. Evidence-Based Nephrology. Oxford: Wiley Blackwell (BMJ Books); 2009: 488–99 [Google Scholar]
- 6. Ates K, Nergizoglu G, Keven K, Sen A, Kutlay S, Erturk S, et al. Effect of fluid and sodium removal on mortality in peritoneal dialysis patients. Kidney Int 2001; 60(2):767–76 [DOI] [PubMed] [Google Scholar]
- 7. Paniagua R, Ventura MD, Avila-Diaz M, Hinojosa-Heredia H, Mendez-Duran A, Cueto-Manzano A, et al. NT-proBNP, fluid volume overload and dialysis modality are independent predictors of mortality in ESRD patients. Nephrol Dial Transplant 2010; 25(2):551–7 [DOI] [PubMed] [Google Scholar]
- 8. Milne EN, Pistolesi M, Miniati M, Giuntini C. The vascular pedicle of the heart and the vena azygos. Part I: The normal subject. Radiology 1984; 152(1):1–8 [DOI] [PubMed] [Google Scholar]
- 9. Ely EW, Haponik EF. Using the chest radiograph to determine intravascular volume status: the role of vascular pedicle width. Chest 2002; 121(3):942–50 [DOI] [PubMed] [Google Scholar]
- 10. Martin GS, Ely EW, Carroll FE, Bernard GR. Findings on the portable chest radiograph correlate with fluid balance in critically ill patients. Chest 2002; 122(6):2087–95 [DOI] [PubMed] [Google Scholar]
- 11. Gao N, Kwan BC, Chow KM, Chung KY, Leung CB, Li PK, et al. Longitudinal changes of cardiothoracic ratio and vascular pedicle width as predictors of volume status during one year in Chinese peritoneal dialysis patients. Kidney Blood Press Res 2009; 32(1):45–50 [DOI] [PubMed] [Google Scholar]
- 12. Chamney PW, Wabel P, Moissl UM, Muller MJ, Bosy-Westphal A, Korth O, et al. A whole-body model to distinguish excess fluid from the hydration of major body tissues. Am J Clin Nutr 2007; 85(1):80–9 [DOI] [PubMed] [Google Scholar]
- 13. Moissl UM, Wabel P, Chamney PW, Bosaeus I, Levin NW, Bosy-Westphal A, et al. Body fluid volume determination via body composition spectroscopy in health and disease. Physiol Meas 2006; 27(9):921–33 [DOI] [PubMed] [Google Scholar]
- 14. Beddhu S, Zeidel ML, Saul M, Seddon P, Samore MH, Stoddard GJ, et al. The effects of comorbid conditions on the outcomes of patients undergoing peritoneal dialysis. Am J Med 2002; 112(9):696–701 [DOI] [PubMed] [Google Scholar]
- 15. Li PK, Cheng YL, Leung CB, Szeto CC, Chow KM, Kwan BC, et al. Effect of membrane permeability on inflammation and arterial stiffness: a randomized trial. Clin J Am Soc Nephrol; 5(4):652–8 [DOI] [PMC free article] [PubMed] [Google Scholar]
- 16. Nolph KD, Moore HL, Twardowski ZJ, Khanna R, Prowant B, Meyer M, et al. Cross-sectional assessment of weekly urea and creatinine clearances in patients on continuous ambulatory peritoneal dialysis. Asaio J 1992; 38(3):M139–42 [DOI] [PubMed] [Google Scholar]
- 17. van Olden RW, Krediet RT, Struijk DG, Arisz L. Measurement of residual renal function in patients treated with continuous ambulatory peritoneal dialysis. J Am Soc Nephrol 1996; 7(5):745–50 [DOI] [PubMed] [Google Scholar]
- 18. Enia G, Sicuso C, Alati G, Zoccali C. Subjective global assessment of nutrition in dialysis patients. Nephrol Dial Transplant 1993; 8(10):1094–8 [PubMed] [Google Scholar]
- 19. Cheng TH, Lam DH, Ting SK, Wong CL, Kwan BC, Chow KM, et al. Serial monitoring of nutritional status in Chinese peritoneal dialysis patients by Subjective Global Assessment and comprehensive Malnutrition Inflammation Score. Nephrology (Carlton) 2009; 14(2):143–7 [DOI] [PubMed] [Google Scholar]
- 20. Bergstrom J, Heimburger O, Lindholm B. Calculation of the protein equivalent of total nitrogen appearance from urea appearance. Which formulas should be used? Perit Dial Int 1998; 18(5):467–73 [PubMed] [Google Scholar]
- 21. Forbes GB, Bruining GJ. Urinary creatinine excretion and lean body mass. Am J Clin Nutr 1976; 29(12):1359–66 [DOI] [PubMed] [Google Scholar]
- 22. Van Biesen W, Williams JD, Covic AC, Fan S, Claes K, Lichodziejewska-Niemierko M, et al. Fluid status in peritoneal dialysis patients: The European Body Composition Monitoring (EuroBCM) Study Cohort. PLoS ONE 2011; 6(2):e171148 [DOI] [PMC free article] [PubMed] [Google Scholar]
- 23. Gao N, Kwan BC, Chow KM, Chung KY, Pang WF, Leung CB, et al. Arterial pulse wave velocity and peritoneal transport characteristics independently predict hospitalization in Chinese peritoneal dialysis patients. Perit Dial Int 2010; 30(1):80–5 [DOI] [PubMed] [Google Scholar]


