Abstract
♦ Objectives: Creatinine clearance scaled to body surface area (BSA) and urea KT/V normalized to total body water (TBW) are used as indices for peritoneal dialysis (PD) adequacy. We investigated relationships of indices of dialysis adequacy (including KT/V, KT, clearance, dialysate over plasma concentration ratio) and anthropometric and body composition parameters (BSA, TBW, body mass index (BMI), weight, height, fat mass (FM), and fat-free mass (FFM)) in male and female patients on continuous ambulatory peritoneal dialysis.
♦ Methods: Ninety-nine stable patients (56 males) performed four 24-hr collections of drained dialysate for four dialysis schedules with three daily exchanges of glucose 1.36% and one night exchange of either: 1) glucose 1.36%, 2) glucose 2.27%, 3) glucose 3.86% or 4) icodextrin 7.5%.
♦ Results: KT and dialysate over plasma concentration ratio, CD/CP, for urea and creatinine were similar for males and females and, in general, did not depend on body-size parameters including V (= TBW), which means that the overall capacity of the transport system in females and males is similar. However, after normalization of KT to V or 1.73/BSA yielding KT/V and creatinine clearance, Cl(1.73/BSA), respectively, the normalized indices were substantially higher in females than in males and correlated inversely with body-size parameters, especially in males.
♦ Conclusions: As KT/V depends strongly on body size, treatment target values for KT/V should take body size and therefore also gender into account. As KT is less influenced by body size, body composition and gender, KT should be considered as a potential auxiliary index in PD.
Keywords: Peritoneal dialysis adequacy, KT/V, clearance, urea, creatinine, gender, body composition
The assessment of solute removal by the kidneys in normal subjects and patients with chronic kidney disease is usually based on a reference such as solute distribution volume (typically total, or extracellular body water), mass/concentration of the particular solute in the body (or in a particular body compartment), or body surface area. Whereas most authors agree that renal function (glomerular filtration rate) should be expressed in relation to size-related features, the choice of the relevant reference for solutes removed by dialysis is debated (1-5).
The assessment of dialysis adequacy, which before the 1980s was based on blood solute concentration, is nowadays mostly based on the fractional fluid volume cleared of the solute during the treatment, KT/V. In peritoneal dialysis (PD), two scaling methods have been used: for urea KT/V, urea removal is normalized to total body water (TBW, V = TBW), whereas creatinine clearance, Cl(1.73/BSA), is adjusted to body surface area (BSA). The problem of the choice of scaling of dialysis adequacy indices was widely discussed for hemodialysis (HD), and, in particular, the choice between KT/V, KT/BSA and KT; however, there was no generally accepted consensus (1,2,6-9). Following the observation that both dialysis dose as measured by clearance multiplied by dialysis time (KT) and total body water (V) are independent predictors of patient survival, the question arises as to whether KT/V, i.e., the ratio of those two parameters, is a meaningful index for defining dialysis adequacy. Furthermore, while KT/V initially was thought to be an operational parameter, which could be used to prescribe and monitor dialysis dose independently of patient body size, this may not be the case, at least not in PD. As reported by Tzamaloukas et al. (4), both urea KT/V and creatinine clearance correlate with body mass and BSA in PD. They demonstrated an inverse relationship between KT/V and body mass (and equivalent indices), whereas KT was found to be independent of patient body size.
As previously noted by Tzamaloukas et al. as well as by studies in HD patients (1-4,10), dialysis dose should take body composition into account. Dialysis adequacy indices: urea KT/V and creatinine clearance, Cl(1.73/BSA), approved for assessing PD efficiency, include in their formulas normalization by TBW and BSA, respectively. Body size-and-composition-related features may have an impact on both: normalized and non-normalized (solute plasma concentration, dialysate over plasma concentration ratio, CD/CP, KT) measurements performed in patients on dialysis. This is likely to be of particular importance when prescribing dialysis dose in obese and underweight patients, but also in women and men. Anthropometric indices and body composition are in general different in males and females, as is survival on dialysis (2,4,11,12). As suggested by Lowrie et al. smaller patients may require proportionately greater total dose than larger patients to achieve comparable survival (11). The aim of the current study was therefore to analyze the impact of anthropometric and body composition-related features (BSA, TBW, body mass index (BMI), weight, height, fat mass (FM), and fat-free mass (FFM)) on dialysis adequacy indices and their components (KT/V, KT, plasma concentration, dialysate over plasma concentration ratio, removed mass and clearances for urea and creatinine) in PD patients with special attention to gender differences.
Patients and Methods
The study was performed in 99 patients (56 males) on continuous ambulatory PD with mean age 54 (± 13) years. Four patients were slow transporters, 38 slow average, 48 fast average, and 8 patients were fast transporters according to Twardowski’s peritoneal equilibration test (PET) classification (13) (one patient was not classified because of the lack of data). Forty-six patients were anuric (i.e., with daily urine output less than 100 mL).
Four different dialysis fluid regimens with three daily exchanges of glucose 1.36% solution and one night exchange of: 1) glucose 1.36% (G1 schedule), 2) glucose 2.27% (G2 schedule), 3) glucose 3.86% (G3 schedule) or 4) icodextrin 7.5% (Ico schedule) were investigated in each patient as described previously (14). The nominal infused volume was 7.97 ± 0.22 L daily; however, there was an overfill volume of 75 mL per bag according to the local manufacturer and the patients were told not to use flush-before-fill; thus, the overfill was taken into account in calculating net ultrafiltration, c.f. (15,16). Four daily collections of dialysate and urine were gathered in each patient. Urine and dialysate bags were mixed (separately) and urine and dialysate samples were taken for concentration measurements. Volumes of urine and dialysate (by daily collection) and concentrations of urea and creatinine in plasma were measured. The measured values of solute concentrations and volumes were used to estimate dialysis adequacy indices based on the calculation of solute mass in the patient body and the solute mass removed from the body. The detailed information about the ultrafiltration and dialysis adequacy indices for each of the daily collections separately was presented in Paniagua et al. (14).
In each patient, BSA was calculated according to Du Bois & Du Bois (m2) (17), body mass index (kg/m2) calculated as body weight divided by the square of a person’s height, and TBW, FM and FFM were determined by multi-frequency electrical bioimpedance using the software provided by the manufacturer (QuadScan 4000, Bodystat, Douglas, United Kingdom). Additionally, TBW was calculated using Watson formula (18), as this is the most commonly used method for estimation of TBW in clinical practice. TBW measured by bioimpedance was higher (on average by 8%) but in general agreed with TBW calculated according to Watson formula (r = 0.91, p < 0.001). In this study, TBW measured by bioimpedance was used. The daily dietary protein intake was estimated based on the four-day survey.
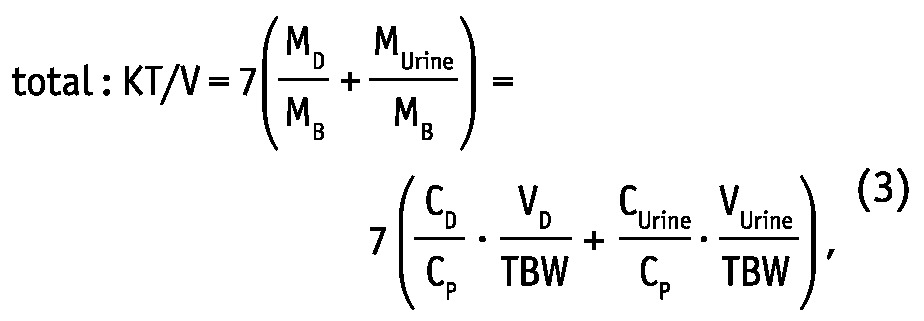
Weekly dialytic (subscript “D”) and total KT/V and KT (L/week) were calculated for urea and creatinine as (19,20):
 |
 |
 |
 |
where MD, MUrine and MB are solute masses in 24-hour dialysate, urine collections, and in the body, respectively, CD, CUrine and CP are solute concentrations in dialysate, urine, and in blood plasma, respectively, and VD, VUrine are volumes of 24-hour dialysate drain volume and urine collections, respectively. The peritoneal and total KT/V measures are analogues to the index KT/V regularly used in clinical practice for assessment of PD efficiency. In the clinic, index KT/V is typically used for urea, whereas for creatinine, weekly creatinine clearance scaled to BSA is often calculated. In this study, weekly clearance was calculated for both creatinine and urea according to:
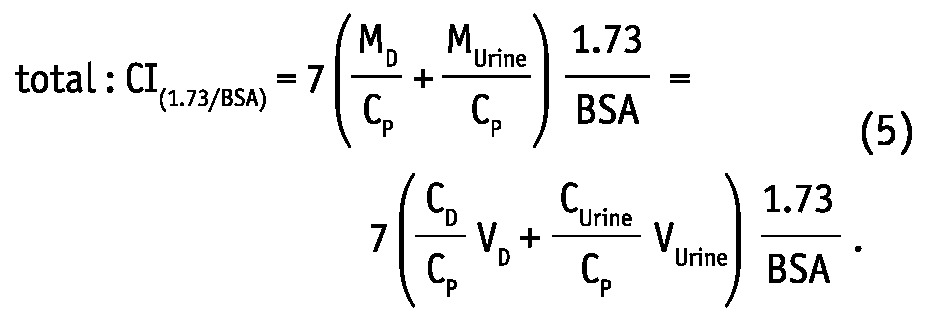 |
There are clear mathematical relationships between Cl(1.73/BSA) and KT, as well as between KT/V and KT: Cl(1.73/BSA) is equal to KT scaled by the factor 1.73/BSA and KT/V is equal to KT divided by TBW. In both normalized adequacy indices: KT/V and Cl(1.73/BSA) as well as in non-normalized index KT, there is a ratio of dialysate to plasma concentrations (CD/CP) that reflects the peritoneal transport type (13).
Statistical Analysis
Statistical significance was set at the level of p < 0.05, unless otherwise indicated. The hypothesis about normal distribution was checked by Shapiro-Wilk test. Comparison between female and male patients was performed using two-sided rank sum test or ANOVA, as appropriate. Each of the potential body size-and-composition predictors (BSA, TBW, BMI, weight, height, FM, FFM) of dialysis adequacy indices (KT/V, KT, clearance, dialysate over plasma concentration ratio, plasma concentration and removed mass) was analyzed using linear multivariate regression analysis for each of the body-and-size parameters, separately, together with some confounding factors, as gender, fluid schedule, age, time on PD and daily protein intake. To compare the relative strength of the various body size-and-composition predictors within the linear multivariate regression model, the β coefficients were calculated for the regression of standardized variables. Adjusted r2 was used as an overall measure of the strength of association of variance in the dependent variable that can be explained by independent variables; this analysis was done also for females and males separately. The statistical analyses were performed using Stata, version 12 (StataCorp LP, College Station, TX, USA).
Results
Body size-and-composition parameters (BSA, TBW, BMI, weight, height, FM and FFM, separately) were checked as potential predictors of dialysis adequacy indices and their components (urea and creatinine: total and dialytic KT/V and KT, clearance, Cl(1.73/BSA), dialysate over plasma concentration ratio, CD/CP, plasma concentration, CP, and total removed mass, MD+MUrine) using a linear multivariate regression model. The model was adjusted for age, gender, time on PD, mean protein intake and fluid schedule. The predictive strength of independent variables was assessed by the calculation of regression coefficients (β coefficients) for the multilinear regression of standardized independent and dependent variables. The ultrafiltration and dialysis adequacy indices for each of the daily collections separately were presented in Paniagua et al. (14).
Anthropometric Parameters, Body Composition, Ultrafiltration and Urine Volume
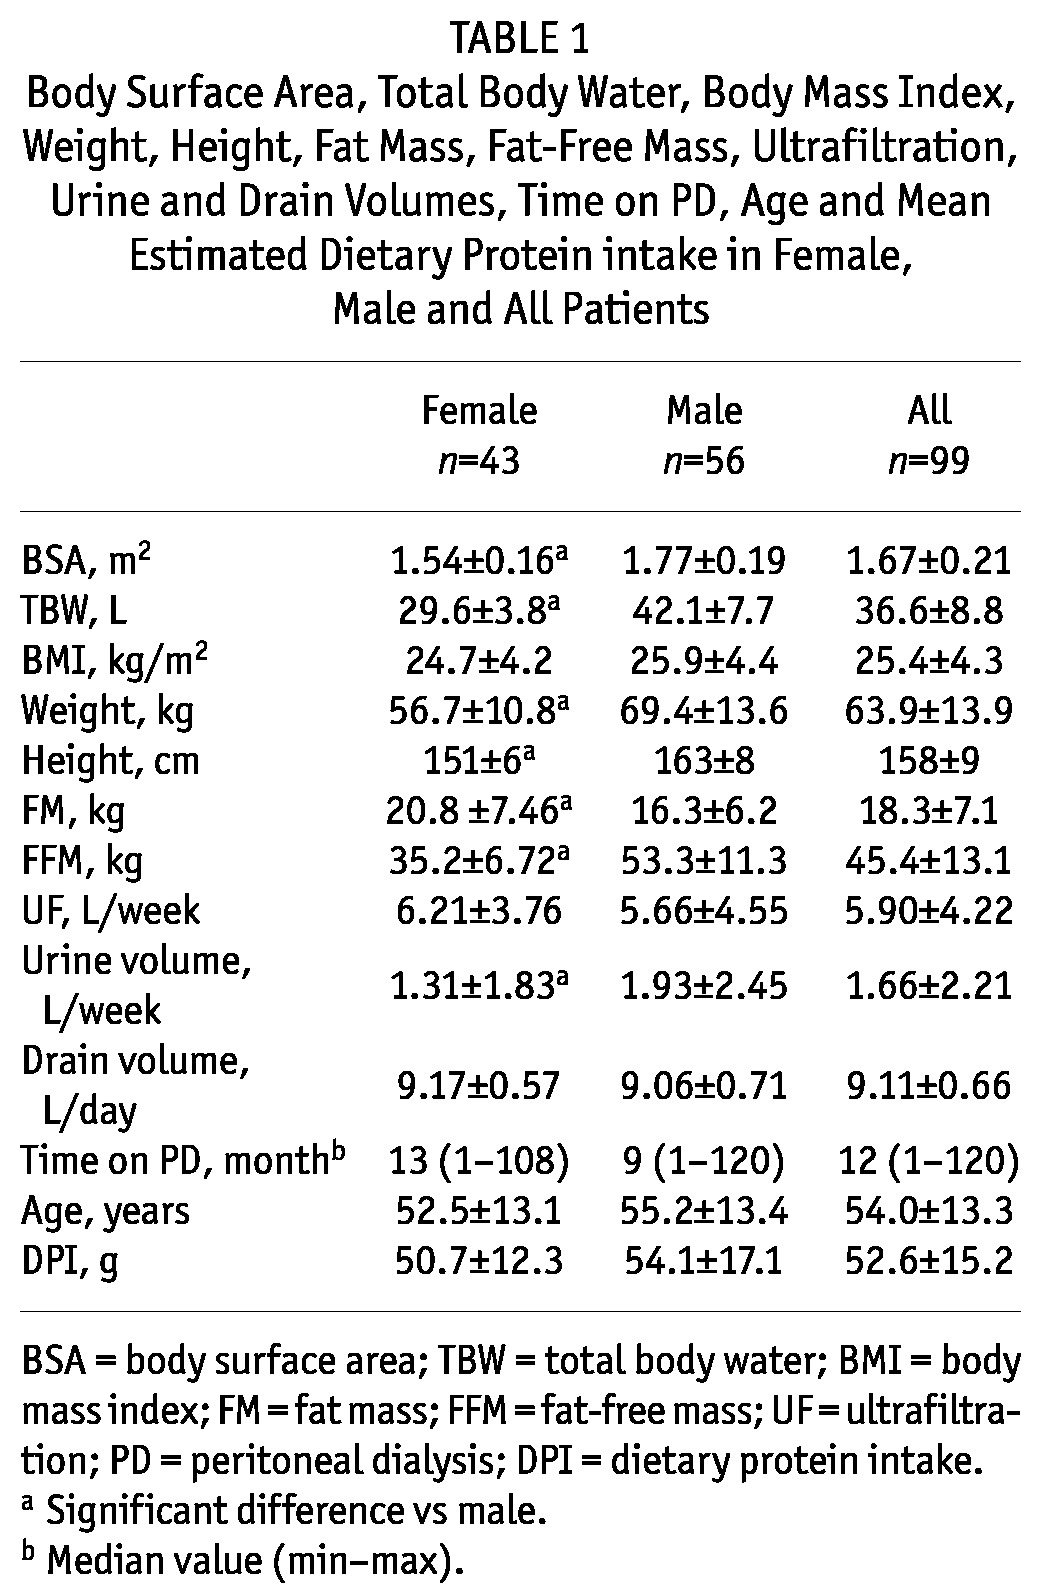
The body weight and height of the females, and therefore also their BSA and TBW, were lower than the respective male characteristics, as expected, but no difference in BMI was found (Table 1). The females had higher FM and lower FFM than males (Table 1). Lower urine volume was observed in females than in males, but there was no difference between genders in ultrafiltration and drain volume (Table 1). Time on PD, age and mean protein intake were similar for both genders (Table 1).
TABLE 1.
Body Surface Area, Total Body Water, Body Mass Index, Weight, Height, Fat Mass, Fat-Free Mass, Ultrafiltration, Urine and Drain Volumes, Time on PD, Age and Mean Estimated Dietary Protein intake in Female, Male and All Patients
Adequacy Indices and their Components
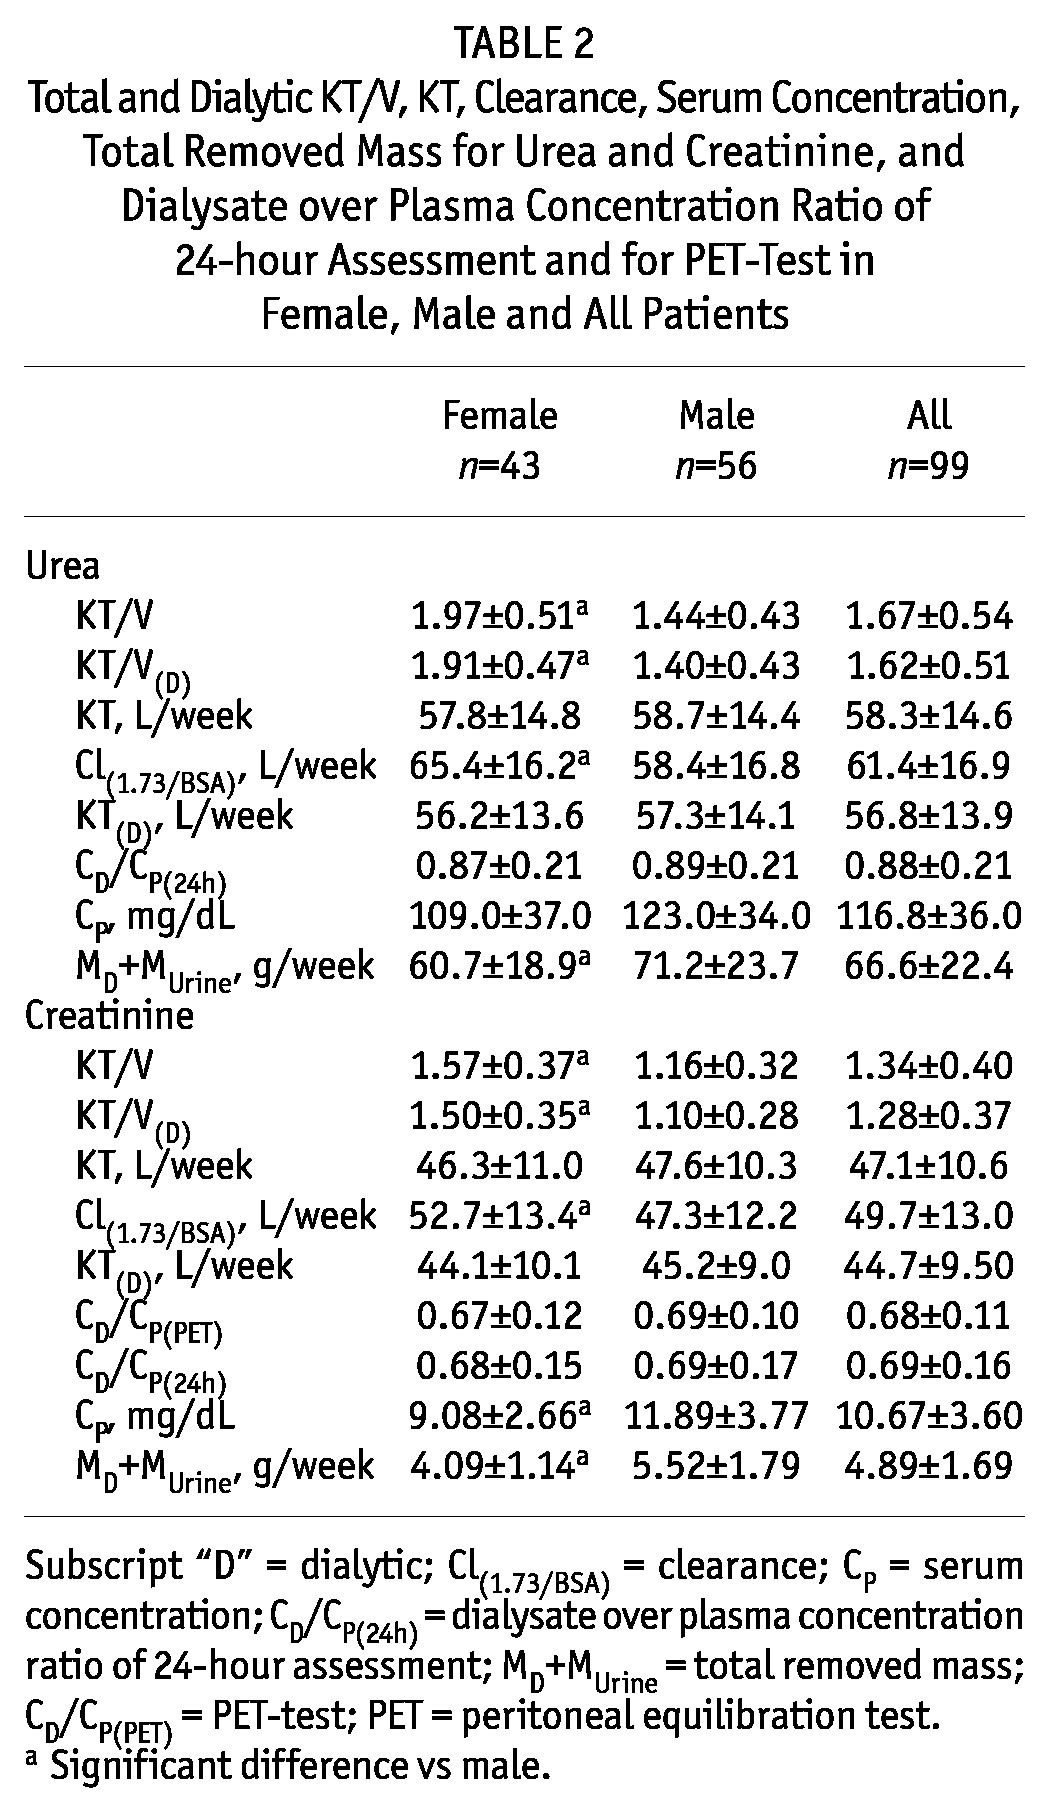
The total removed urea and creatinine masses, MD+MUrine, were lower in females than in males, but the dialysis doses estimated as KT were not different between the genders (Table 2). In contrast, the dialysis doses estimated as KT/V were considerably higher in females than in males for both solutes (total urea KT/V: 1.97 ± 0.51 vs 1.44 ± 0.43, Table 2). The creatinine and urea clearances, parameters that involve scaling to body surface area, Cl(1.73/BSA), were also higher in females (Table 2). The creatinine concentration in plasma was lower in females than in males, and the urea plasma concentration had a similar trend, although the difference was not significant (Table 2). No difference in dialysate over plasma concentration for PET test, CD/CP(PET), and for 24-hour assessment, CD/CP(24h), was found between genders (Table 2).
TABLE 2.
Total and Dialytic KT/V, KT, Clearance, Serum Concentration, Total Removed Mass for Urea and Creatinine, and Dialysate over Plasma Concentration Ratio of 24-hour Assessment and for PET-Test in Female, Male and All Patients
Adequacy Indices and their Components vs Anthropometric and Body Composition Parameters
The removed masses of urea and creatinine (by dialysis and the kidneys: MD+MUrine) correlated in general positively with patient body size (BSA, TBW, BMI, weight) for both genders (β coefficients from 0.16 up to 0.44, Table 3, Table 4). In contrast, the body size scaled index KT/V correlated negatively with body size characteristics, and the correlation was stronger in males (β coefficients for total urea KT/V in males from -0.6 up to -0.3, Table 3, Table 4, Figure 1, Figure 2). KT/V correlated also negatively with FFM and FM, except for no correlation of urea KT/V with FM in females and in all patients (Table 3, Table 4). Values of adjusted r2 showed that in the multivariate regression models the associations between various body size-and-composition predictors (BSA, TBW, BMI, weight, height, FM, FFM) and total weekly urea and creatinine KT/V (Figure 1, Figure 2) are much stronger in males than in females (e.g., average adjusted r2 in models that predict urea KT/V was 0.05 and 0.26 in females and males, respectively). The predictive power (adjusted r2) of the models that describe urea and creatinine KT was much lower than for KT/V and only with a slight difference between genders.
TABLE 3.
Adjusted r2 and Standardized β Coefficients for Total and Dialysis Urea KT/V, KT, Clearance, Plasma Concentration, Total Removed Mass and Dialysate over Plasma Concentration Ratio Predicted by Body Surface Area, Total Body Water, Body Mass Index, Weight, Height, Fat Mass and Fat-Free Mass, Separately, with Adjustment to Age, Gender, Time on PD, Mean Protein Intake and Fluid Schedule, in Female, Male and All Patients
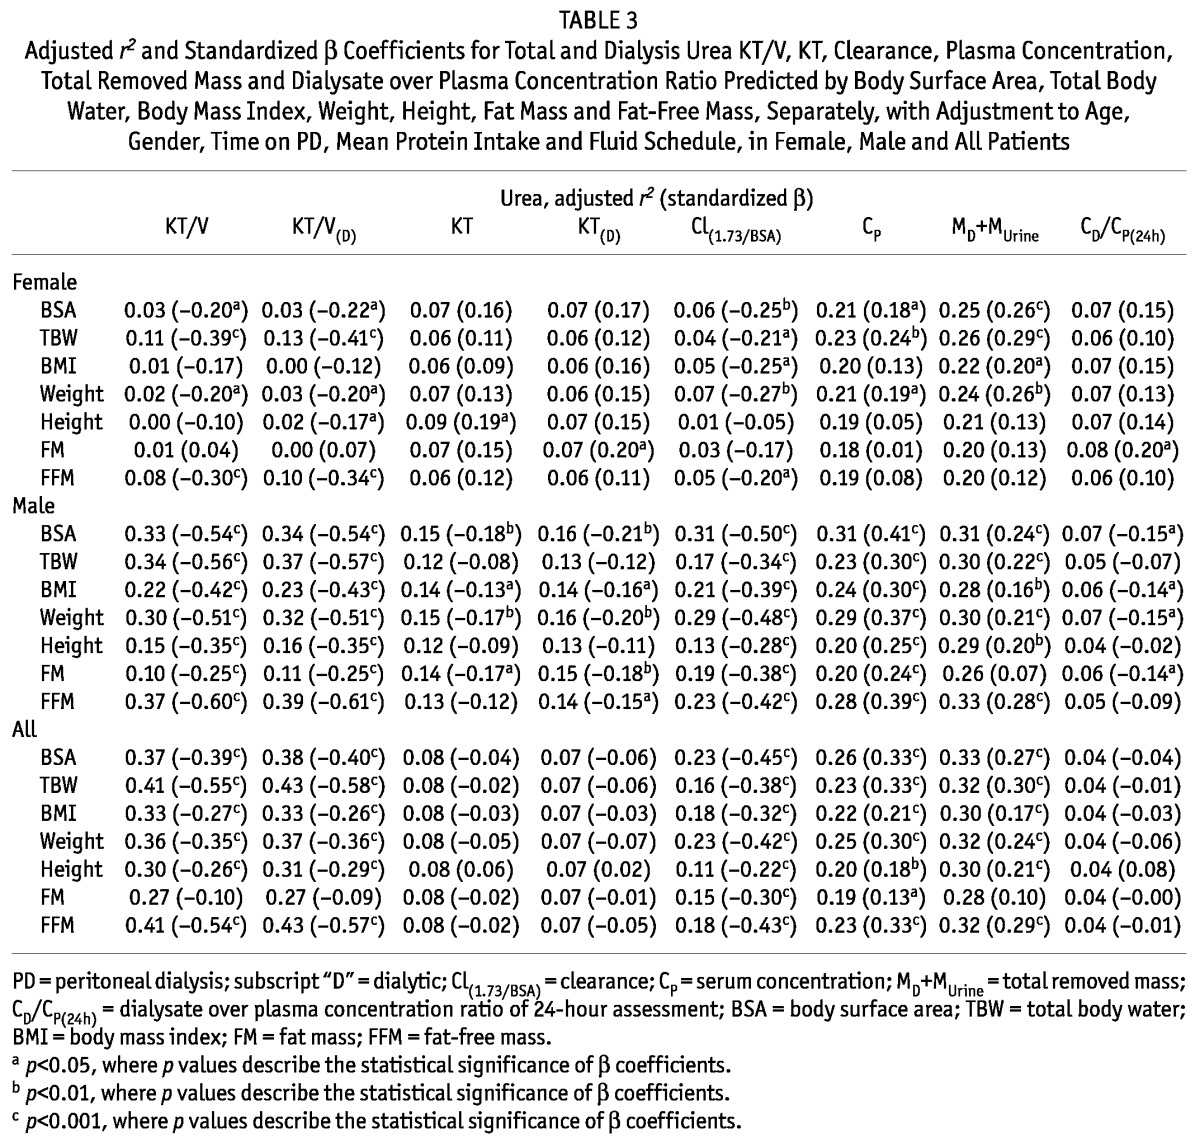
TABLE 4.
Adjusted r2 and Standardized β Coefficients for Total and Dialysis Creatinine KT/V, KT, Clearance, Plasma Concentration, Total Removed Mass and Dialysate over Plasma Concentration Ratio Predicted by Body Surface Area, Total Body Water, Body Mass Index, Weight, Height, Fat Mass and Fat-Free Mass, Separately, with Adjustment to Age, Gender, Time on PD, Mean Protein Intake and Fluid Schedule, in Female, Male and All Patients
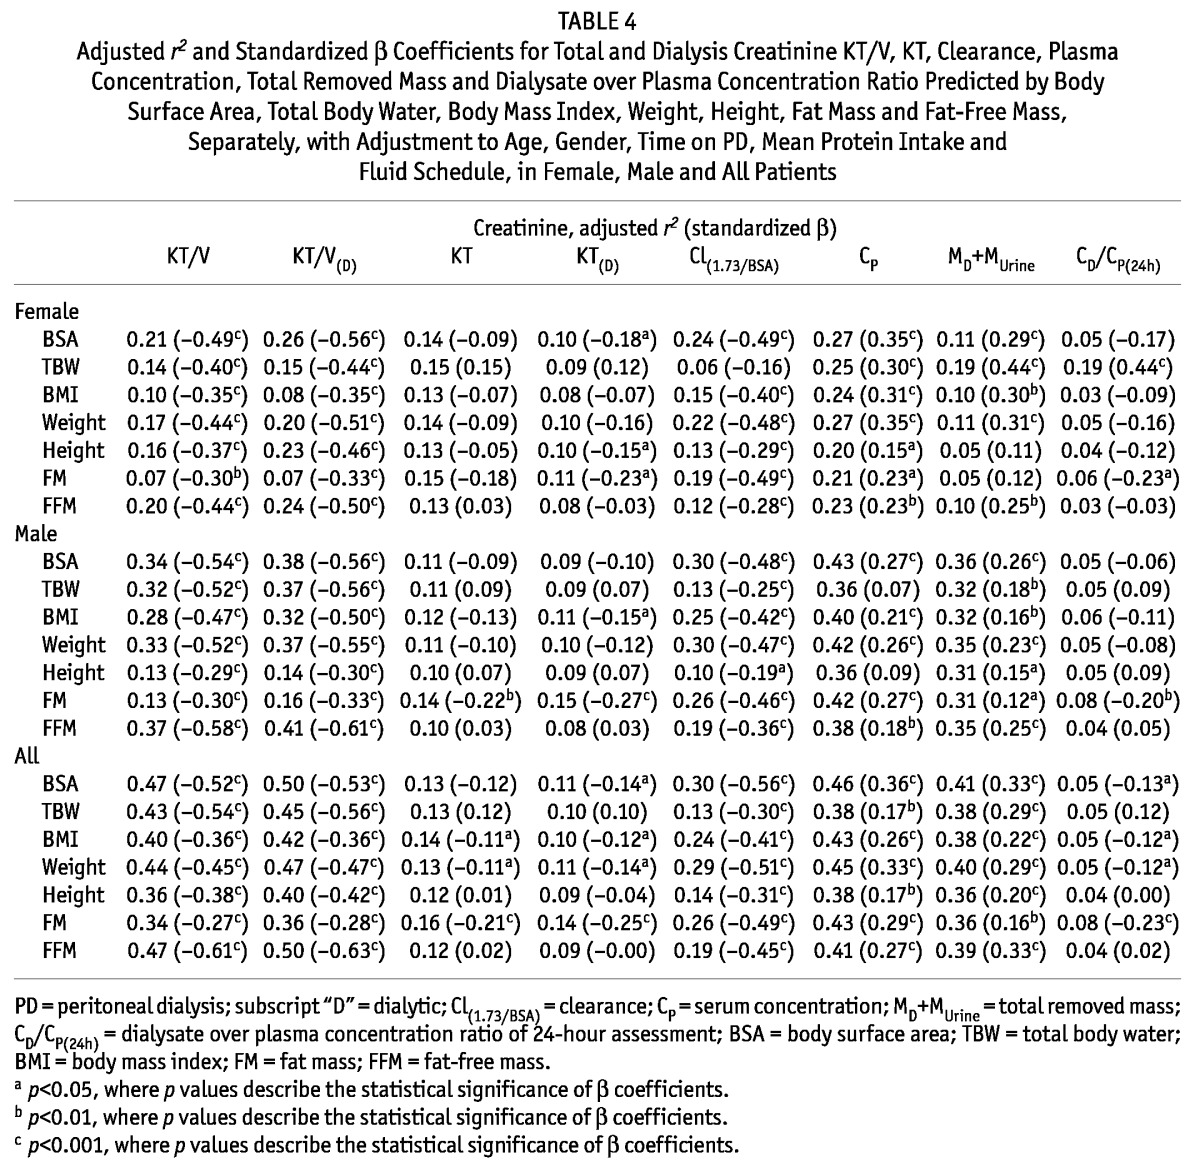
Figure 1 —
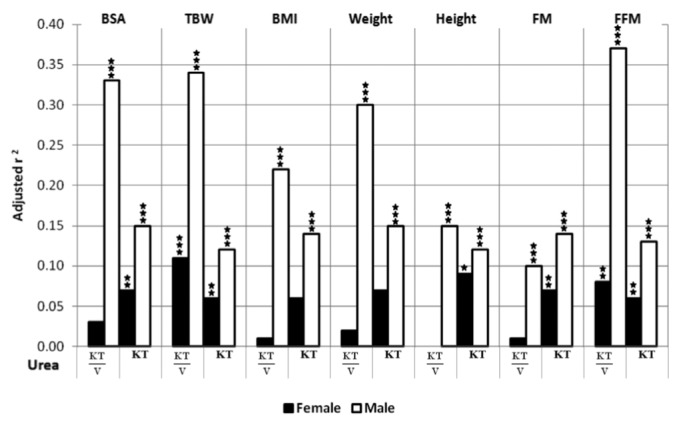
Adjusted r2 of multivariate linear regression for weekly, total urea KT/V and KT predicted by the model containing body surface area (BSA), total body water (TBW), body mass index (BMI), weight, height, fat mass (FM) and fat-free mass (FFM), separately, with adjustment to age, time on PD, mean protein intake and fluid schedule, in female and male patients (* p<0.05, ** p<0.01, *** p<0.001, where p values describe statistical significance of adjusted r2).
Figure 2 —
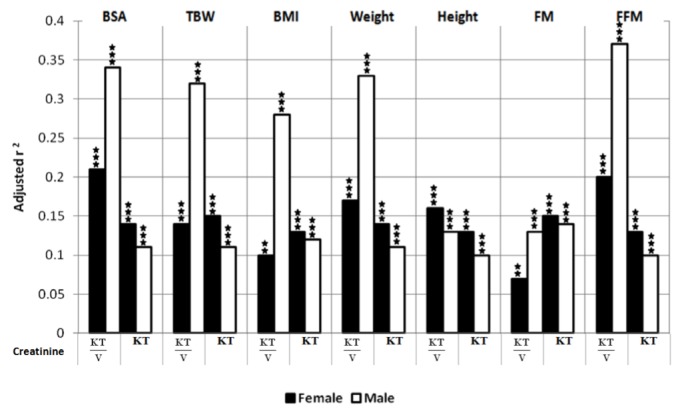
Adjusted r2 of multivariate linear regression for weekly, total creatinine KT/V and KT predicted by the model containing body surface area (BSA), total body water (TBW), body mass index (BMI), weight, height, fat mass (FM) and fat-free mass (FFM), separately, with adjustment to age, time on PD, mean protein intake and fluid schedule, in female and male patients (* p<0.05, ** p<0.01, *** p<0.001, where p values describe statistical significance of adjusted r2).
In general, there were no correlations between KT and anthropometric and body composition parameters and, if any, they were much weaker than those for KT/V (Table 3, Table 4, Figure 1, Figure 2). An exception was the strong negative correlation between creatinine KT and FM in males (for dialytic KT: β = -0.27, Table 4). Some negative correlations were also found between urea KT and BSA, BMI, weight and FM in males.
Normalized urea and creatinine clearances, Cl(1.73/BSA), generally correlated negatively with anthropometric and body composition parameters (the average beta coefficient equaled -0.36 and -0.43 for urea and creatinine, respectively, Table 3, Table 4). Exceptions include the lack of correlations between urea Cl(1.73/BSA) and height and FM and between creatinine Cl(1.73/BSA) and TBW in females.
Plasma levels, CP, of urea and creatinine generally correlated positively with anthropometric and body composition parameters (Table 3, Table 4).
Discussion
In another recent study, using the same patient material, we analyzed ultrafiltration and dialysis adequacy indices in each daily collection separately, and could demonstrate an impact of ultrafiltration and PET transport type on dialysis adequacy indices (14). Another analysis, based on the same clinical data, of fluid transport induced by glucose was described recently in Waniewski et al. (21). The current study was devoted to the analysis of the impact of body size-and-composition on adequacy indices and shows that: 1) the dialysis dose (expressed as KT/V and clearance, Cl(1.73/BSA); both indices estimated for urea and creatinine) is influenced strongly by body size-and-composition, 2) KT/V and Cl(1.73/BSA) differ between men and women (because of their different body size-and-composition), 3) dialysis dose expressed as KT is in general less influenced by body size-and-composition, and therefore, 4) KT could be a useful auxiliary adequacy index in PD, alongside KT/V and normalized clearance, Cl(1.73/BSA). The present study confirms and extends previous observations by Tzamaloukas et al. (4).
The parameter KT (expressed usually in L per week), which is a specific representation of a family of indices called equivalent continuous clearances (ECC, expressed usually in mL per min, (19,22,23)), characterizes directly the dose of dialysis; this index is typically applied for hemodialysis (HD) but less often used in PD. However, for PD, KT depends on the capability of the physiological transport system to respond to the prescribed dialysis schedule. Therefore, with the same schedule, as in our study, KT characterizes directly the peritoneal transport system of the individual patient, which explains the substantial scattering of KT observed in the current study, see Table 2 and (14), whereas in hemodialysis, KT depends mainly on the effective dialyzer clearance and time of dialysis. KT/V has also a more direct definition in PD than in HD. Mainly, KT/V, being a specific way to normalize the dialysis dose per unit volume of the distribution fluid, is in PD, at the same time, the ratio of the removed solute mass to the solute mass in the body, i.e., a parameter of the type of fractional solute removal, FSR (19,24-26). However, as noted above, it depends not only on the prescribed dose of dialysis but also on the response of the individual peritoneal transport system to dialysis, and therefore varies considerably between patients, even when patients are receiving exactly the same dialysis prescription (14).
It is interesting that KT (total) and KT(D) (dialysis only) were similar for males and females (Table 2) and do not depend on V (V = TBW, Table 3, Table 4), which means that the overall capacity of the transport system in females and males is similar. However, after normalization of KT to V, the resulting KT/V index is substantially higher in females than in males and correlates negatively with V (Table 2, Table 3, Table 4). An important finding of the present study was that the body size of men was most likely the reason that their KT/V did not reach the minimal target of KT/V = 1.7 established by international guidelines (27,28).
Body-size parameters accounted for a large part of the variance (adjusted r2) in normalized dialysis adequacy indices as KT/V and Cl(1.73/BSA) (Table 3, Table 4). The impact of body size-and-composition was conspicuously stronger in males than in females (Figure 1, Figure 2). However, whereas a substantial part (up to 50%) of the variance could be explained by the herein investigated factors, it is clear that the large fractions of variance were not due only to body size-and-composition; other factors (not explored here) including peritoneal fluid and small solute transport characteristics appear to be of similar or even greater importance.
The drain volume can be potentially used to decrease the influence of size indicator (TBW, BSA) on normalized adequacy indices. Increased drain volume (VD), equations 1 and 5, enlarges KT/V and Cl(1.73/BSA). Increasing the drain volume in large patients can increase mass transfer solute coefficient K. In general, K correlates positively with CD/CP, however the relationship between K and CD/CP is complex. K is a measure of peritoneal surface area, which may be larger in large individuals. Larger drain volume may increase K, but may cause the drop of CD/CP that deteriorates the dialysis efficiency.
Enlarged TBW or BSA can be due to obesity or high height or both. Obesity could have a different effect on the CD/CP ratio than high height. However, CD/CP ratio did not correlate with almost any size indicator (including height), FM was negatively correlated with creatinine CD/CP. There was also a negative correlation between FM and urea CD/CP in males. One may speculate that, in general, obesity deteriorates CD/CP ratio. Also, higher FM negatively correlated with creatinine KT/V and KT in both genders, as well as with urea KT/V and KT in males.
It should be noted that there are important differences between PD and HD as both the concept of KT/V in PD and in HD, and its relation with survival, are fundamentally different in the two modalities. The current guidelines for KT/V are based on different KT/V targets for HD and PD with considerably lower published targets (or rather recommended minimum values) for weekly urea KT/V for PD (1.7) than for HD (3.6); however, it should be noted that KT/V for different treatment modalities or schedules has different meanings and therefore should not be compared (19,20,23,26,29,30). The survival of patients is similar for both therapies or at least not dramatically different (5,9,11,31,32). The difference between the treatment modalities in target KT/V is considered to be related in part to the quasi-continuous fluid and solute removal during PD, which contrasts with the situation in intermittent HD that is associated with unphysiological oscillations of body water volume and concentrations of uremic toxins. These oscillations are also a practical problem for the selection of adequacy indices for HD because there is no self-evident clear indication which value of plasma urea concentration should be used as a reference value for the definition of adequacy indices (19,20,23).
In contrast to HD, adequacy indices in PD, such as KT, which are based directly on the removed solute amount, are intimately related also to patient characteristics, i.e., the characteristics of the peritoneal transport system and the physiology of the solute production and removal. In PD, solute removal can be influenced by choices regarding, for example, number (and volume) of exchanges of dialysis fluid per day, osmotic agent and dialysis fluid tonicity, but the means by which the dialysis dose can be controlled are more restricted than in HD, which allows a more direct control over dialyzer clearance and KT.
There are some limitations of this study that should be noted when interpreting the results. First, while the most important indicator for choosing a particular dialysis adequacy index for clinical application should be its association with patient mortality and morbidity, we did not investigate the clinical outcome of the patients. However, a cross-sectional study like the current one can be helpful in assessment of the implications and usefulness of different indices. Second, the number of patients was limited; however, each patient was investigated four times with different daily fluid schedules and therefore the results are less dependent on the choice of a particular schedule. It is worth noting that the statistical method applied in this study (multivariate linear regression with fluid schedule as one of the confounding factors) uses the information from different collections separately. Third, the results, based on the concomitant analyses of several different features, may appear to be equivocal and therefore difficult to interpret; however, our study demonstrates the complex nature of the many interconnected relationships when assessing dialysis adequacy.
One may ask whether KT/V index with such pronounced differences between patients with different body size should be used for the prescription of PD dose. A one-size-fits-all approach may lead to unwarranted systematic health care effects in the form of inadequate dialysis regimens in certain groups of the population. However, it should be noted that other dose indicators, such as KT, have not yet been sufficiently explored.
In summary, we could demonstrate that in 99 continuous ambulatory PD patients receiving the same dialysis schedule during the day (glucose 1.36% solution x 3) and four different dialysis fluids (glucose 1.36%, 2,27% and 3.86%, and icodextrin) during the night, the dialysis dose (expressed as dialysis adequacy indices KT/V and clearance) is influenced strongly by body size-and-composition, and therefore these dialysis indices differ between men and women. Furthermore, we found that an alternative index, KT, is less influenced by body size-and-composition, and therefore should be considered as a potential auxiliary index in PD alongside KT/V or normalized clearance; however, further studies are needed to evaluate the mortality predictive role of KT.
Disclosures
Bengt Lindholm is employed by Baxter Healthcare Corporation. Baxter Novum is the result of a grant from Baxter Healthcare Corporation to Karolinska Institutet.
Acknowledgments
We thank all patients who participated in the study.
References
- 1. Daugirdas JT, Depner TA, Greene T, Kuhlmann MK, Levin NW, Chertow GM, et al. Surface-area-normalized Kt/V: A method of rescaling dialysis dose to body surface area-implications for different-size patients by gender. Semin Dial 2008; 21(5):415–21 [DOI] [PMC free article] [PubMed] [Google Scholar]
- 2. Daugirdas JT, Greene T, Chertow GM, Depner TA. Can rescaling dose of dialysis to body surface area in the hemo study explain the different responses to dose in women versus men? Clin J Am Soc Nephrol 2010; 5(9):1628–36 [DOI] [PMC free article] [PubMed] [Google Scholar]
- 3. Twardowski ZJ, Moore HL, Prowant BF, Satalowich R. Long-term follow-up of body size indices, residual renal function, and peritoneal transport characteristics in continuous ambulatory peritoneal dialysis. Adv Perit Dial 2009; 25:155–64 [PubMed] [Google Scholar]
- 4. Tzamaloukas AH, Murata GH, Piraino B, Malhotra D, Bernardini J, Rao P, et al. The relation between body size and normalized small solute clearances in continuous ambulatory peritoneal dialysis. J Am Soc Nephrol 1999; 10(7):1575–81 [DOI] [PubMed] [Google Scholar]
- 5. Rocco MV, Frankenfield DL, Prowant B, Frederick P, Flanigan MJ. Risk factors for early mortality in U.S. peritoneal dialysis patients: Impact of residual renal function. Perit Dial Int 2002; 22(3):371–9 [PubMed] [Google Scholar]
- 6. Daugirdas JT, Levin NW, Kotanko P, Depner TA, Kuhlmann MK, Chertow GM, et al. Comparison of proposed alternative methods for rescaling dialysis dose: Resting energy expenditure, high metabolic rate organ mass, liver size, and body surface area. Semin Dial 2008; 21(5):377–84 [DOI] [PMC free article] [PubMed] [Google Scholar]
- 7. Lowrie EG. The normalized treatment ratio (Kt/V) is not the best dialysis dose parameter. Blood Purif 2000; 18(4):286–94 [DOI] [PubMed] [Google Scholar]
- 8. Lowrie EG, Chertow GM, Lew NL, Lazarus JM, Owen WF. The urea [clearance x dialysis time] product (Kt) as an outcome-based measure of hemodialysis dose. Kidney Int 1999; 56(2):729–37 [DOI] [PubMed] [Google Scholar]
- 9. Lowrie EG, Li Z, Ofsthun N, Lazarus JM. The online measurement of hemodialysis dose (Kt): Clinical outcome as a function of body surface area. Kidney Int 2005; 68 (3):1344–54 [DOI] [PubMed] [Google Scholar]
- 10. McDonald SP, Collins JF, Johnson DW. Obesity is associated with worse peritoneal dialysis outcomes in the Australia and New Zealand patient populations. J Am Soc Nephrol 2003; 14(11):2894–901 [DOI] [PubMed] [Google Scholar]
- 11. Lowrie EG, Li Z, Ofsthun N, Lazarus JM. Measurement of dialyzer clearance, dialysis time, and body size: Death risk relationships among patients. Kidney Int 2004; 66(5):2077–84 [DOI] [PubMed] [Google Scholar]
- 12. Lowrie EG, Ofsthun N, Li Z. Dialysis dose and gender: A different hypothesis. Kidney Int 2004; 66(3):1291–2; author reply 2 [DOI] [PubMed] [Google Scholar]
- 13. Twardowski ZJ. PET-a simpler approach for determining prescriptions for adequate dialysis therapy. Adv Perit Dial 1990; 6:186–91 [PubMed] [Google Scholar]
- 14. Paniagua R, Debowska M, Ventura MD, Avila-Diaz M, Prado-Uribe C, Mora C, et al. Ultrafiltration and dialysis adequacy with various daily schedules of dialysis fluids. Perit Dial Int 2012; 32(5):545–51 [DOI] [PMC free article] [PubMed] [Google Scholar]
- 15. Davies SJ. Overfill or ultrafiltration? We need to be clear. Perit Dial Int 2006; 26(4):449–51 [PubMed] [Google Scholar]
- 16. La Milia V, Pozzoni P, Crepaldi M, Locatelli F. Overfill of peritoneal dialysis bags as a cause of underestimation of ultrafiltration failure. Perit Dial Int 2006; 26(4):503–5 [PubMed] [Google Scholar]
- 17. Du Bois D, Du Bois EF. A formula to estimate the approximate surface area if height and weight be known. Arch Intern Med 1916; XVII(6_2):863–71 [PubMed] [Google Scholar]
- 18. Watson PE, Watson ID, Batt RD. Total body water volumes for adult males and females estimated from simple anthropometric measurements. Am J Clin Nutr 1980; 33(1):27–39 [DOI] [PubMed] [Google Scholar]
- 19. Waniewski J, Debowska M, Lindholm B. Theoretical and numerical analysis of different adequacy indices for hemodialysis and peritoneal dialysis. Blood Purif 2006; 24(4):355–66 [DOI] [PubMed] [Google Scholar]
- 20. Waniewski J, Lindholm B. Fractional solute removal and Kt/V in different modalities of renal replacement therapy. Blood Purif 2004; 22(4):367–76 [DOI] [PubMed] [Google Scholar]
- 21. Waniewski J, Paniagua R, Stachowska-Pietka J, Ventura MD, Avila-Diaz M, Prado-Uribe C, et al. Threefold peri toneal test of osmotic conductance, ultrafiltration efficiency, and fluid absorption. Perit Dial Int pdi2011; [Epub ahead of print] [DOI] [PMC free article] [PubMed] [Google Scholar]
- 22. Casino FG, Lopez T. The equivalent renal urea clearance: A new parameter to assess dialysis dose. Nephrol Dial Transplant 1996; 11(8):1574–81 [PubMed] [Google Scholar]
- 23. Waniewski J, Debowska M, Lindholm B. Can the diverse family of dialysis adequacy indices be understood as one integrated system? Blood Purif 2010; 30(4):257–65 [DOI] [PubMed] [Google Scholar]
- 24. Henderson LW. Critical interpretation of adequacy parameters in peritoneal dialysis and hemodialysis. Perit Dial Int 1999; 19(Suppl 2):S38–44 [PubMed] [Google Scholar]
- 25. Verrina E, Brendolan A, Gusmano R, Ronco C. Chronic renal replacement therapy in children: Which index is best for adequacy? Kidney Int 1998; 54(5):1690–6 [DOI] [PubMed] [Google Scholar]
- 26. Debowska M, Waniewski J, Lindholm B. Bimodal dialysis: Theoretical and computational investigations of adequacy indices for combined use of peritoneal dialysis and hemodialysis. ASAIO J 2007; 53(5):566–75 [DOI] [PubMed] [Google Scholar]
- 27. Clinical practice guidelines for peritoneal adequacy, update 2006. Am J Kidney Dis 2006; 48(Suppl 1):S91–7 [DOI] [PubMed] [Google Scholar]
- 28. Dombros N, Dratwa M, Feriani M, Gokal R, Heimburger O, Krediet R, et al. European best practice guidelines for peritoneal dialysis. 7 adequacy of peritoneal dialysis. Nephrol Dial Transplant 2005; 20(Suppl 9):24–7 [DOI] [PubMed] [Google Scholar]
- 29. Debowska M, Waniewski J, Lindholm B. An integrative description of dialysis adequacy indices for different treatment modalities and schedules of dialysis. Artif Organs 2007; 31(1):61–9 [DOI] [PubMed] [Google Scholar]
- 30. Debowska M, Waniewski J, Lindholm B. Adequacy indices for dialysis in acute renal failure: Kinetic modeling. Artif Organs 2010; 34(5):412–9 [DOI] [PubMed] [Google Scholar]
- 31. Rocco M, Soucie JM, Pastan S, McClellan WM. Peritoneal dialysis adequacy and risk of death. Kidney Int 2000; 58(1):446–57 [DOI] [PubMed] [Google Scholar]
- 32. Rumpsfeld M, McDonald SP, Johnson DW. Peritoneal small solute clearance is nonlinearly related to patient survival in the Australian and New Zealand peritoneal dialysis patient populations. Perit Dial Int 2009; 29(6):637–46 [PubMed] [Google Scholar]


