Summary
Ancient and diverse antibiotic resistance genes (ARGs) have previously been identified from soil1–3, including genes identical to those in human pathogens4. Despite the apparent overlap between soil and clinical resistomes4–6, factors influencing ARG composition in soil and their movement between genomes and habitats remain largely unknown3. General metagenome functions often correlate with the underlying structure of bacterial communities7–12. However, ARGs are hypothesized to be highly mobile4,5,13, prompting speculation that resistomes may not correlate with phylogenetic signatures or ecological divisions13,14. To investigate these relationships, we performed functional metagenomic selections for resistance to 18 antibiotics from 18 agricultural and grassland soils. The 2895 ARGs we discovered were predominantly novel, and represent all major resistance mechanisms15. We demonstrate that distinct soil types harbor distinct resistomes, and that nitrogen fertilizer amendments strongly influenced soil ARG content. Resistome composition also correlated with microbial phylogenetic and taxonomic structure, both across and within soil types. Consistent with this strong correlation, mobility elements syntenic with ARGs were rare in soil compared to sequenced pathogens, suggesting that ARGs in the soil may not transfer between bacteria as readily as is observed in the clinic. Together, our results indicate that bacterial community composition is the primary determinant of soil ARG content, challenging previous hypotheses that horizontal gene transfer effectively decouples resistomes from phylogeny13,14.
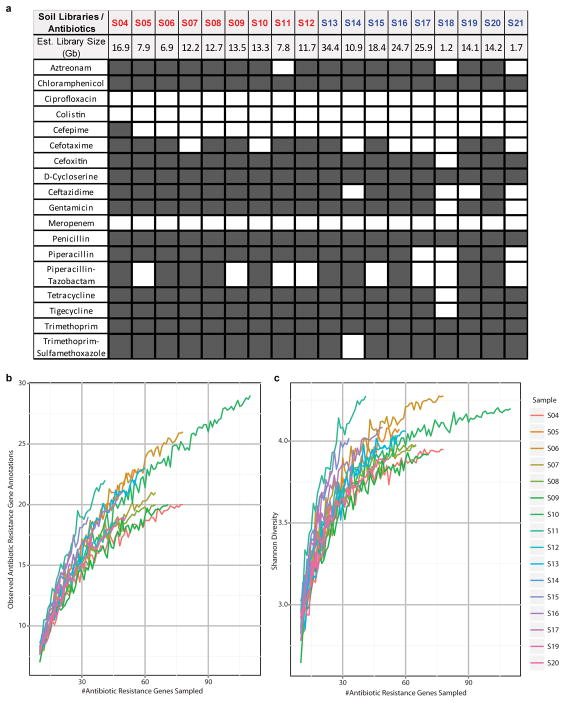
Functional metagenomic selections permit deep interrogation of resistomes and can identify full-length, functionally-verified ARGs independent of sequence-similarity to previously identified genes2–4,16. We constructed metagenomic libraries averaging 13.8 ± 8.3 (mean ± s.d.) Gb by shotgun cloning one- to five Kb DNA fragments from 18 soils (table S1) into Escherichia coli, and screened these libraries for resistance against 18 antibiotics representing 8 drug classes. Resistance was conferred against 15 of the 18 antibiotics tested (Extended Data Fig. 1, table S2), and DNA fragments conferring resistance were sequenced, assembled, and annotated with PARFuMS4 (see online methods).
Extended Data Figure 1.
(a) Results of selections of 18 soil metagenomic libraries for antibiotic resistance to 18 compounds. A dark gray cell means a resistance phenotype was observed whereas white cells indicate the absence of any drug-tolerant transformants. Grassland soils from Cedar Creek (CC) are labeled in red and agricultural soils from Kellogg Biological Station (KBS) in blue. (b to c) Alpha diversity representations. On the left is depicted the number of distinct ARG annotations observed as increasing numbers of ARGs are sampled from each soil. On the right, Shannon diversity scores are shown at each rarefaction step.
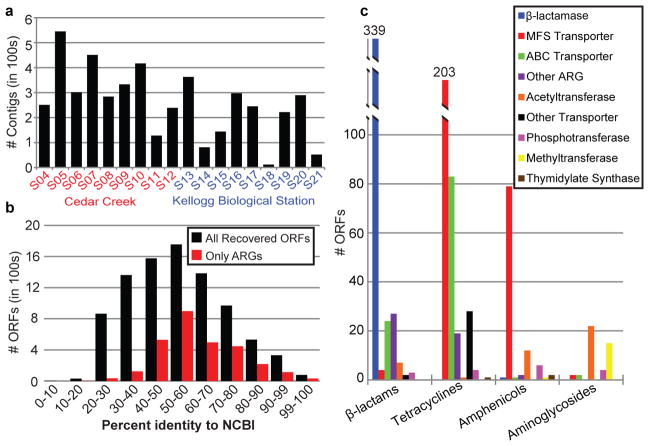
We assembled 4655 contigs over 500bp in length (figure 1A, N50 size = 2.25 Kb) containing 8882 open reading frames (ORFs) larger than 350bp (Supplementary Data 1). Using profile Hidden Markov Models (HMMs), we annotated 2895 of these 8882 ORFs as ARGs (see online methods). Underscoring the immense functional diversity of soil resistomes, the identified soil ARGs were largely dissimilar from ARGs in public repositories (figure 1B). Only 15 soil ARGs (0.5%) have perfect amino acid identity to entries in the NCBI protein database, with just three having >99% nucleotide identity to nucleotide sequences in NCBI. In contrast, the average amino acid identity of all ARGs to their closest homolog in NCBI is only 61.1 ± 15.3%. Although we recently described cultured soil bacteria harboring ARGs with perfect nucleotide identity to those in human pathogens4, this phenomenon appears to be the exception rather than the rule: only one soil ARG from our current dataset shares perfect nucleotide identity with a pathogen (NCBI Accession AY664504).
Figure 1.
Functional selections of 18 soil libraries yields diverse ARGs. (a) Bar chart depicting contigs >500bp across all antibiotic selections from CC (red) and KBS (blue) libraries. (b) Amino acid identity between all ORFs (black) or ARGs only (red) and their top hit in NCBI protein. (c) Total ARGs by antibiotic class; y-axis shows number of ORFs, ARG types are in the boxed legend.
Our sampling depth (Extended Data Fig. 1) surpasses previous functional interrogations of soil metagenomes8–10,16,17, permitting an unparalleled comparison of ARGs across soil types. Emphasizing the diversity recovered by our functional selections, 29% of assembled contigs over 1500bp did not contain an ORF that could be confidently assigned a known resistance function, representing a large repertoire of potentially novel ARGs. The ORFs assigned to known ARG functions represent all classical mechanisms of antibiotic resistance (figure 1C): antibiotic efflux, antibiotic inactivation, and target protection/redundancy15.
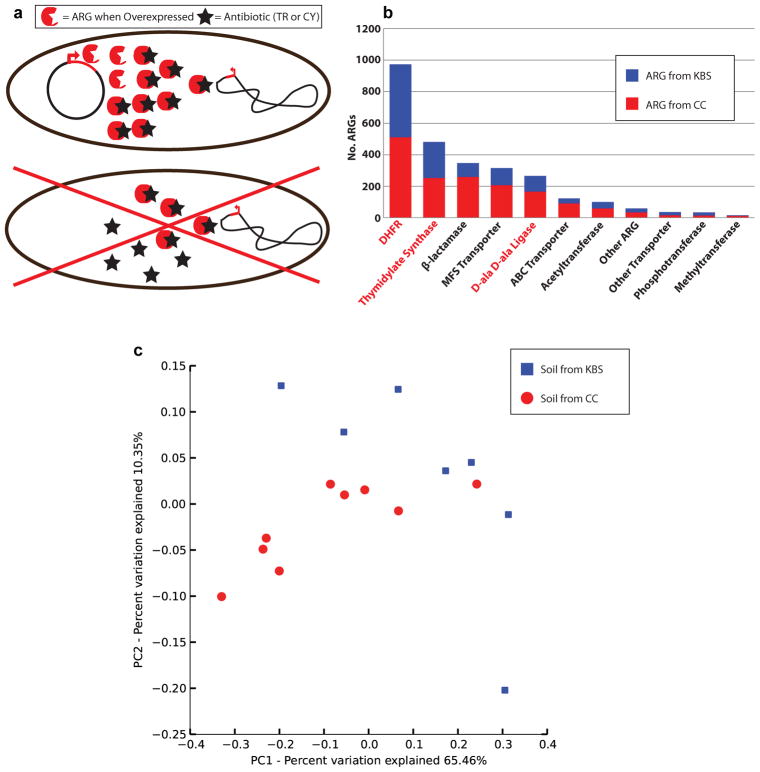
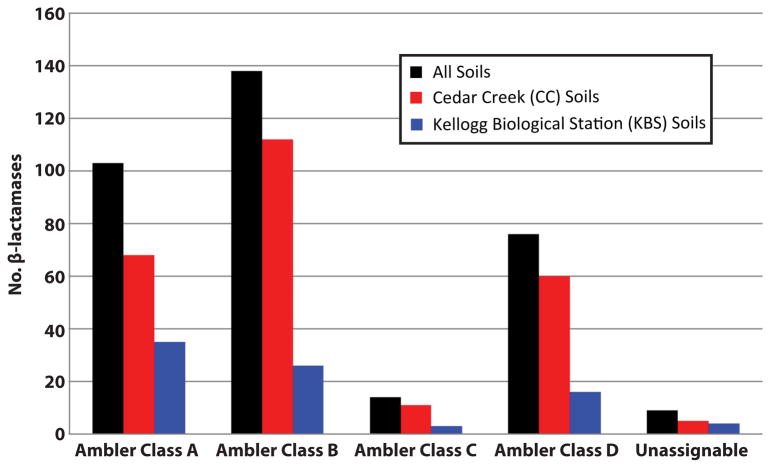
Resistance to amphenicol and tetracycline antibiotics occurred predominantly via the action of drug transporters, of which the majority belonged to the major facilitator superfamily (MFS, figure 1C). In contrast, selections with aminoglycoside and β-lactam antibiotics most frequently uncovered ARGs with antibiotic-inactivating capabilities, via covalent modification of aminoglycosides and enzymatic degradation of β-lactams (figure 1C). Excluding selections with trimethoprim and D-cycloserine (for which the ARGs selected were predominantly overexpressed target alleles from diverse bacterial lineages16, Extended Data Fig. 2), β-lactamases were the most frequently encountered soil ARGs, mirroring observations from hospital settings18. We observed metallo-β-lactamases most frequently, followed by Ambler class A- and class D- enzymes (Extended Data Fig. 3).
Extended Data Figure 2.
Three prominent ARG classes are present in nearly all bacterial genomes and can provide antibiotic resistance when overexpressed. (a) Generalized as red circles are dihydrofolate reductases (DHFRs), D-alanine—D-alanine (Dala-Dala) ligases, which are the molecular targets of the drugs trimethoprim (TR) and D-cycloserine (CY) respectively (black stars), and thymidylate synthases (TSs), which can provide trimethoprim resistance by circumventing the need for an active DHFR. When overexpressed in functional selections, these genes can provide antibiotic resistance. We found substantial diversity in these genes (average pairwise amino acid identity 39.3 ± 12.2%), suggesting that variants were captured from many bacterial lineages. (b) Relative to other ARG mechanisms, large numbers of DHFRs, TSs, and Dala-Dala ligases were found in all soils, with these ARGs representing 92.5% of resistance genes identified from selections containing trimethoprim- or D-cycloserine antibiotics. Therefore, these selections encompass large genetic diversity, but constrained functional diversity, with a broad range of genes encoding limited functional traits. (c) When considered in isolation, these functions were not different between the Kellogg Biological Station (KBS) and Cedar Creek (CC) soils (p>0.05, ANOSIM), indicating that trimethoprim and D-cycloserine resistance function is similarly distributed across the surveyed soil types.
Extended Data Figure 3.
Total counts of β-lactamases recovered from antibiotic selections using all soils (black), CC soils (red), and KBS soils (blue).
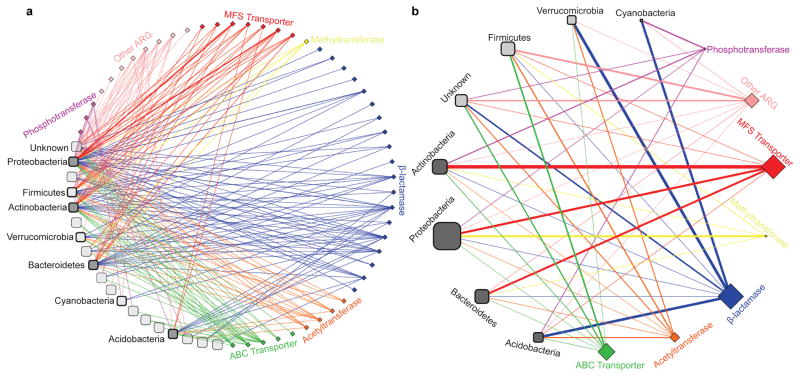
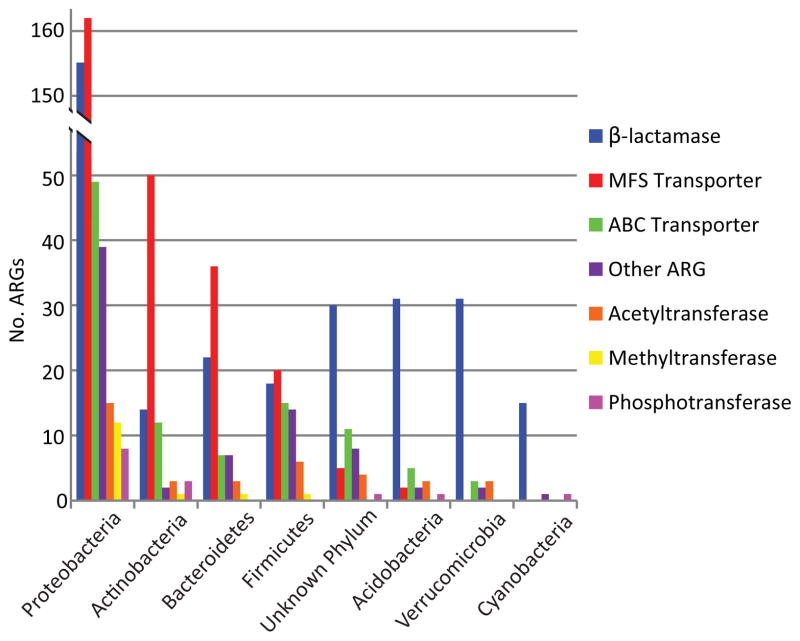
We predicted the source phylum of each functionally-selected resistance contig greater than 500bp using a composition-based, semi-supervised, taxonomic binning algorithm19. Proteobacteria and Actinobacteria were the most prevalent predicted phyla, and each contained ARG families of all major resistance mechanisms15 (figure 2A). MFS transporters and β-lactamases showed the strongest, and most orthogonal, relationships with predicted bacterial phyla (figure 2B, Extended Data Fig. 4, table S3). β-lactamases were enriched within Verrucomicrobia, Acidobacteria, and Cyanobacteria contigs, while MFS transporters were largely absent from Acidobacteria and were enriched among Actinobacteria and Proteobacteria contigs (table S3).
Figure 2.
Resistance is encoded by diverse soil phyla. (a) Network of predicted bacterial phyla for each ARG. Edge thickness indicates number of ARGs within an ARG family (diamonds) from a predicted phylum (rounded squares). Phyla containing >15 ARGs are labeled, and are shaded dark grey at >3% 16S rRNA abundance. (b) Simplified network of general ARG mechanisms; edge thickness represents significance of phylum and ARG mechanism co-occurrence (Fisher’s exact test, line width increases with ranked significance). Node size indicates number of ARGs (diamonds) or contig count (rounded squares).
Extended Data Figure 4.
Total counts of ARGs categorized by their predicted phylogenetic origin. The number of ORFs are indicated on the y-axis and the ARG types in the boxed legend.
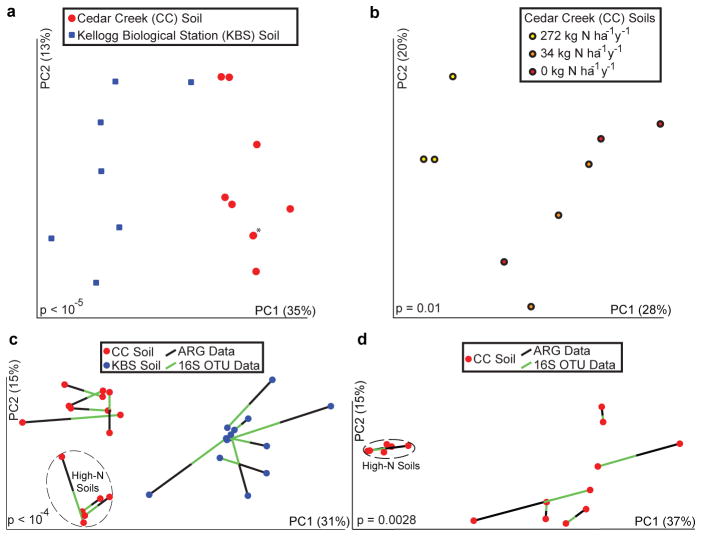
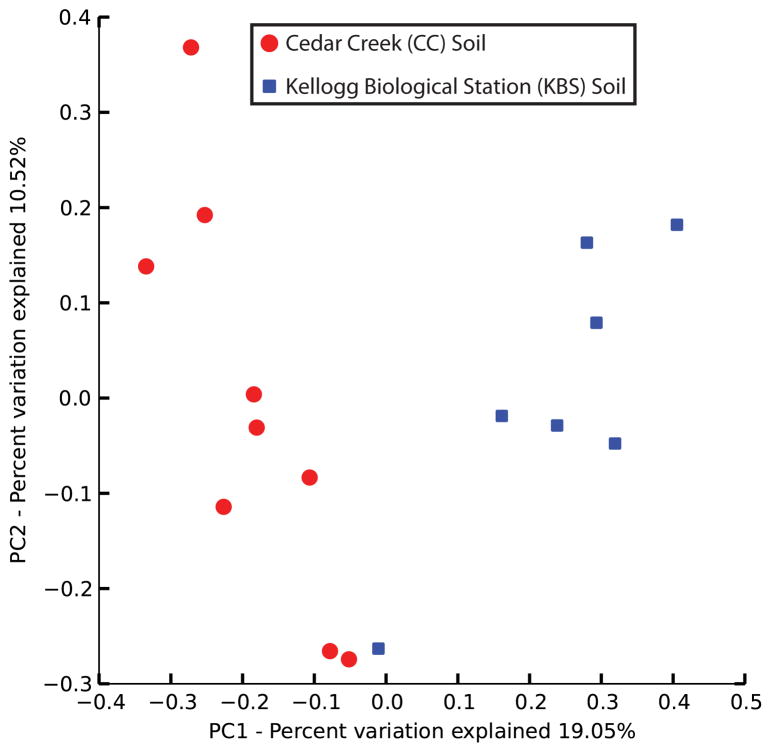
To quantitatively compare soil resistomes at higher resolution, a count matrix of unique gene sequences per functional annotation (i.e. ARG family) was generated by summing across all antibiotic selections per soil and normalizing these counts to metagenomic library size (see online methods). The number of unique ARGs was significantly higher (p<0.01, Wilcoxon rank sum test) in Cedar Creek (CC) grassland soils compared to agricultural soils from Kellogg Biological Station (KBS). Our selections resolved functional differences between CC and KBS soils regardless of whether Bray-Curtis distances were calculated using (i) only ARG families (figure 3A) or (ii) all captured gene functions (Extended Data Fig. 5). MFS transporters and β-lactamases were elevated at CC compared to KBS, and ARG families of these resistance mechanisms best discriminated between these soils (table S4). Only 2.6% of ARGs were shared across at least two soils at ≥99% nucleotide identity (table S5), with significantly more inter-soil sharing at CC versus KBS (p<0.05, Fisher’s exact test). No ARGs were shared between CC and KBS soils (≥99% nucleotide identity), and only two ARG mechanisms were observed in every soil (β-lactamase, MFS transporter).
Figure 3.
Resistomes correlate with phylogeny across soil type and nitrogen amendment. (a to b) PCoA plots depict Bray-Curtis distances between soils, using unique ARG counts. (a) Resistomes from CC (red) and KBS (blue) soils cluster separately (p<10−5, ANOSIM). Asterisk denotes two soils with near-identical coordinates. (b) CC soils amended with high N-levels cluster separately from other CC soils (p=0.01, ANOSIM). (c to d) Procrustes analyses depict significant correlation between ARG content (Bray-Curtis) and bacterial composition (Bray-Curtis) for (c) CC (red) and KBS (blue) soils and (d) only CC soils.
Extended Data Figure 5.
Principal coordinate analysis (PCoA) plots of Bray-Curtis distances between soil resistomes. The PCoA was calculated using all ORFs captured from functional selections without trimethoprim- and D-cycloserine, and shows significant separation between CC (red) and KBS (blue) resistomes (p<10−5, ANOSIM).
We sampled CC soils across an anthropogenic nitrogen (N) gradient. Similar to phylogenetic differences observed in community composition across the N gradient20, we found that ARG composition of soils receiving higher N levels differed from the composition observed in other CC soils (figure 3B). These differences do not arise from a change in the number of unique ARGs between high-N and other soils (p=0.9, Wilcoxon rank sum test), but rather were due to differences in relative proportions of ARG families in these soils (table S6). In high-N soils, β-lactamases were depleted whereas membrane transporters were enriched (table S6). High N levels favor particular organisms (e.g., copiotrophs8,10,20), causing shifts in bacterial abundances, which in turn likely affect resistome composition.
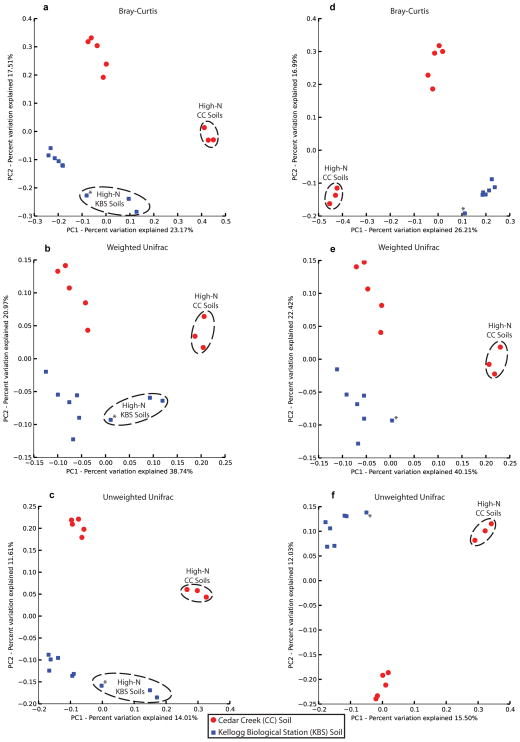
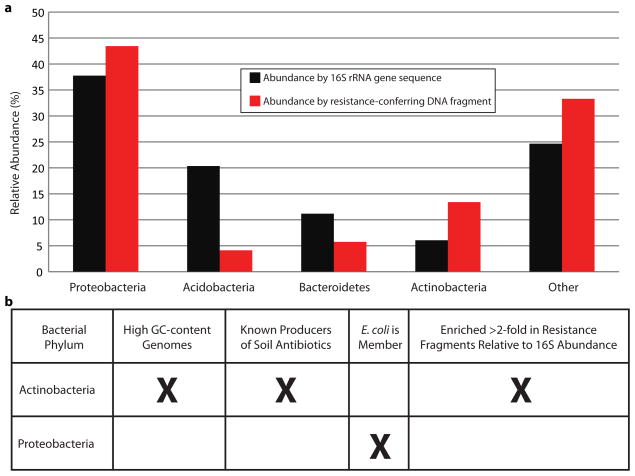
We calculated differences in community structure of these CC and KBS soils using 16S rRNA gene sequences8 (Extended Data Fig. 6). All bacterial phyla that were abundant (>3% relative abundance) in the samples by 16S rRNA gene sequencing were also well-represented (>4% relative abundance) among phyla inferred from resistance-conferring contigs (Extended Data Fig. 7). Actinobacteria (which are characterized by GC-rich genomes and produce antibiotics in the soil21) were most enriched in resistance-conferring contigs relative to 16S rRNA gene abundance, while levels of Proteobacteria were similar in both datasets (Extended Data Fig. 7). Thus, any phylogenetic bias in functional selections due to heterologous expression in E. coli (a Proteobacteria) is minimal compared to the effect of the ARG-content of source bacteria.
Extended Data Figure 6.
PCoA across CC (red, grassland) and KBS (blue, agricultural) soils. (a to c) PCoA generated from all 16S data available from ref. 8, using (a) Bray-Curtis, (b) weighted Unifrac, and (c) unweighted Unifrac dissimilarity metrics. Samples cluster by soil location and N-level, as previously demonstrated. (d to f) The same PCoA plots generated using only samples with sufficient 16S and resistome data (i.e. those used in Procrustes and Mantel analyses). Excluding the two high-N KBS soils with insufficient resistome data eliminates the clustering pattern observed for KBS soils in (a to c). The asterisk denotes the high-N KBS soil common to both sets of analyses.
Extended Data Figure 7.
Phylum level relative abundance of combined Cedar Creek (CC) and Kellogg Biological Station (KBS) datasets for major soil bacteria. (a) 16s rRNA data is depicted in black. Phylogenetic inferences based on the sequence composition of the assembled, resistance-conferring DNA fragments are depicted in red. Actinobacteria and Acidobacteria relative abundance represent the largest discrepancies between datasets. (b) Actinobacteria are most dramatically enriched in resistance-conferring DNA fragments, in accord with their role in producing antibiotics, but despite their high GC-content and predicted transcriptional incompatibilities with E. coli. Levels of Proteobacteria, the phylum to which E. coli belongs, are largely unchanged following functional selection, suggesting that any potential bias introduced to the selections by heterologous expression in E. coli is minimal compared to the effect of ARG-content of the source organisms.
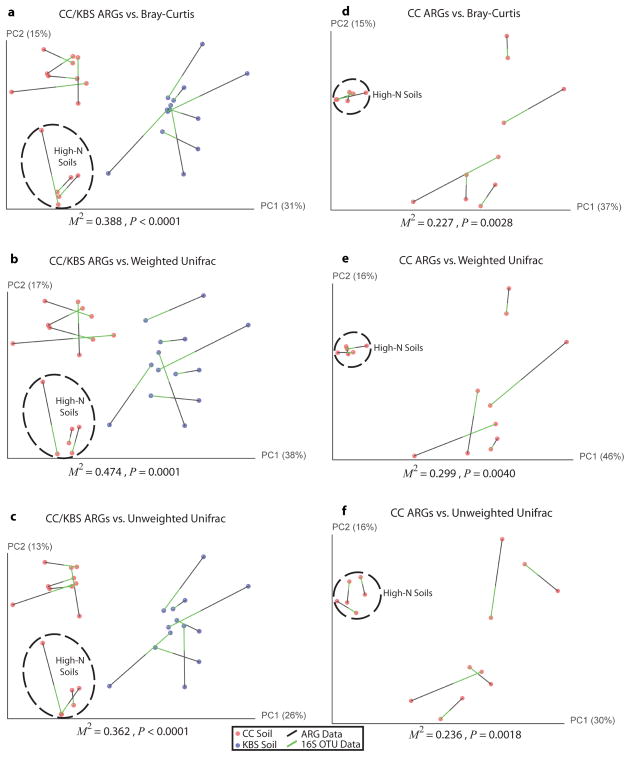
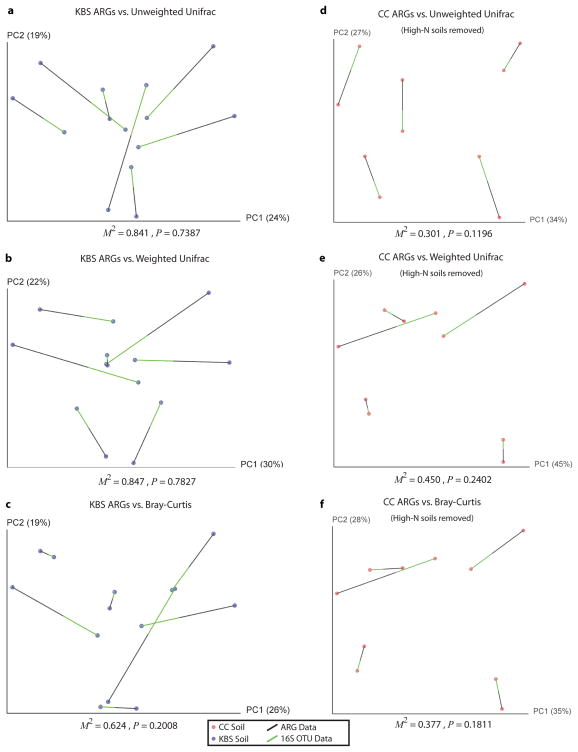
We next tested for correlations between soil resistomes and community composition. When both CC and KBS soils were considered, Bray-Curtis distances calculated from normalized ARG counts significantly correlated with bacterial OTUs inferred from 16S rRNA sequence data, whether taxonomic (Bray-Curtis) or phylogenetic (weighted and unweighted) dissimilarity metrics were used (Mantel tests, p<0.05, table S7). Visualized by Procrustes analyses, both the ARG content and bacterial composition of CC and KBS soils clustered by sampling site, consistently displaying highly significant goodness of fit measures (figure 3C, Extended Data Fig. 8, table S8). Within sampling sites, the variability in phylogenetic community composition differed (table S9): more diversity was observed across CC soils than in KBS soils (Extended Data Fig. 6). Because of this disparity, we observed a significant within-site correlation between ARG content and community composition in CC (tables S7, S8; figure 3D, Extended Data Fig. 8), but not KBS soils (Extended Data Fig. 9).
Extended Data Figure 8.
Procrustes analysis demonstrates that when soils cluster by bacterial composition, resistomes aggregate with phylogenetic groupings. (a to c) Procrustes analysis of the ARG content (Bray-Curtis) of CC (red) and KBS (blue) soils compared to community composition calculated by (a) Bray-Curtis, (b) weighted Unifrac, and (c) unweighted Unifrac dissimilarity metrics. (d to f) The same Procrustes transformations for CC soils only. For a given soil, black lines connect to functional resistome data while the green lines connect to points generated from 16S gene sequence data. The M2 fit reported is from a Procrustes transformation over the first two principal coordinates while the p-value is calculated from a distribution of empirically determined M2 values over 10,000 Monte Carlo label permutations. For M2/p-values calculated using all principal coordinates, refer to table S8.
Extended Data Figure 9.
Procrustes analysis demonstrates that when soils do not form distinct phylogenetic clusters, we are unable to detect significant correlation between ARG content and phylogenetic architecture. See Extended Data figure 6 for the phylogenetic relationships between these soils. (a to c) Procrustes analysis of the ARG content (Bray-Curtis) of KBS (agricultural, blue) soils compared to 16s rRNA gene sequence using (a) unweighted Unifrac, (b) weighted Unifrac, and (c) Bray-Curtis similarity metrics. (d to f) The same Procrustes transformations for the CC soils (grassland, red) without high-N amendment, showing that soil groupings must be distinguishable by bacterial composition to detect correlations with resistome content, regardless of soil type. For a given soil, black lines connect to functional resistome data while the green lines connect to points generated from 16S rRNA gene sequence data. The M2 fit reported is from a Procrustes transformation over the first two principal coordinates while the p-value is calculated from a distribution of empirically determined M2 values over 10,000 Monte Carlo label permutations.
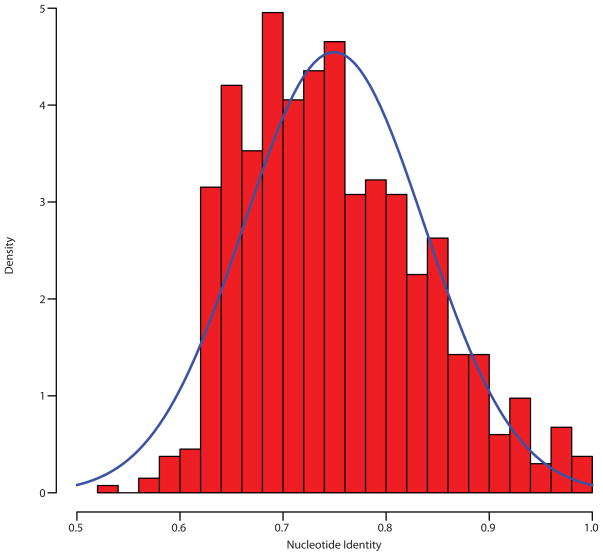
The strong correlation between soil ARG content and bacterial composition suggests that HGT of ARGs is not sufficiently frequent to obscure their association with bacterial genomes. Corroborating this notion, soil ARGs show limited genetic potential for horizontal exchange. Only 0.42% of ORFs from our functional selections were predicted mobility elements (e.g., transposases, integrases, recombinases, Extended Data Fig. 10), and none of these genes were co-localized with an ARG containing >72% amino acid identity to a protein in NCBI. The limited mobility of the soil resistome may explain why ARGs are rarely shared between soil and human pathogens4,22. In contrast to soils, ARGs in pathogens often share near-perfect sequence identity18, with origins that can be traced to the emergence of a single genotype disseminated broadly via HGT23,24.
Extended Data Figure 10.
Histogram of nucleotide percent identity from pairwise alignments of all predicted mobility elements, suggesting assembly does not inappropriately condense mobile DNA elements into too few sequences. The blue trace depicts a normal distribution with the same mean and standard deviation empirically observed across all pairwise comparisons.
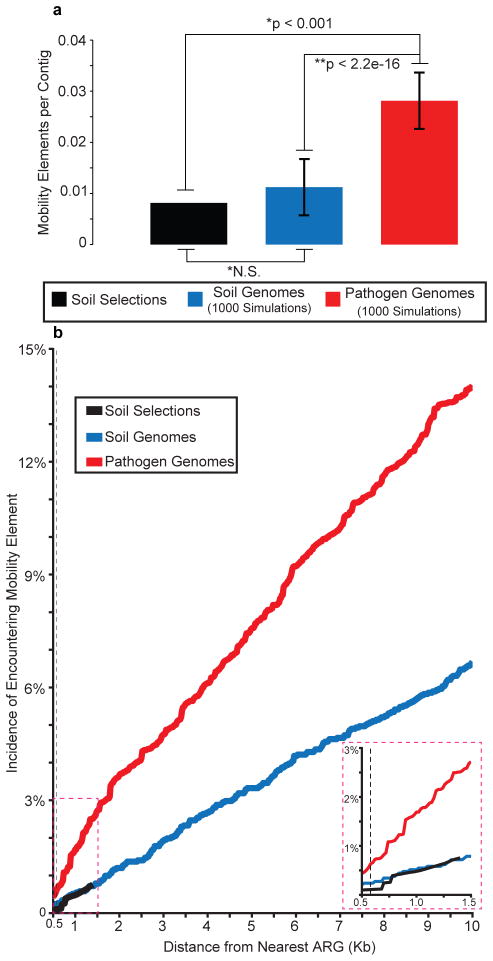
To test the hypothesis that ARGs in the soil have less potential for HGT than those in human pathogens, we compared ARGs from our functional selections to ARGs in fully-sequenced genomes from 433 common human pathogens and 153 non-pathogenic soil organisms13 (Supplementary Data 2). We modeled functional selections from each genome collection based on the fragment-size distribution observed in our soil selections (see online methods), and calculated the proportion of DNA fragments from each simulation that contained a predicted mobility element. Signatures of HGT were significantly more frequent in pathogen genomes than in soil genomes or soil selections (figure 4A). Importantly, we detected no difference in HGT potential of ARGs between the two soil datasets (figure 4A), supporting the generality of the conclusions drawn from our soil functional selections. As the genetic distance from an ARG increased, the incidence of mobility elements in pathogen genomes was always higher than in soil genomes or functionally-selected metagenomes (figure 4B), indicating the higher potential for HGT seen in pathogens is independent of DNA fragment size or the method by which soil resistance is interrogated. Interestingly, enriching for MDR Proteobacteria in the soil4,25 (which are frequently encountered as opportunistic pathogens in hospital settings26) increases the detection of shared resistance between soil and clinic4, suggesting that they may represent a major conduit through which ARGs move between these environments.
Figure 4.
Pathogen ARGs show higher HGT potential than soil ARGs. (a) Mobility elements syntenic with ARGs are proportionally higher in pathogens than soil genomes or soil functional selections. (*) indicates significance determined from 1000 Monte Carlo simulations; (**) indicates significance determined by Student’s T test. Error bars depict two standard deviations from mean. (b) Pathogens show significantly increased HGT potential relative to soil genomes and soil selections at all distances (20bp intervals) greater than 580bp (dashed line, p < 0.05, Fisher’s exact test). Inset depicts mobility elements encountered within 1.5Kb of ARGs, demonstrating that data from soil selections resembles soil genomes.
Unlike most hospital settings, soils contain a huge diversity of ARGs1–3,16,22, and therefore increasing antibiotic exposure (as has occurred over the past 70 years27) may favor preexisting genotypes1 rather than the acquisition of new ARGs4. This key distinction explains our observation that, despite extensive sampling, very little evidence exists for HGT of ARGs across soil communities. Indeed, our evidence points to phylogeny, rather than HGT13,14, as the primary determinant of soil resistome content. Therefore, as bacterial type and diversity change across soils8–10,20, so too do their associated ARGs, resulting in resistomes that may respond to anthropogenic modulations (e.g. nitrogen fertilizer) that do not possess obvious antibiotic-related properties.
Online Methods
Construction of Soil Metagenomic Libraries
For construction of soil metagenomic libraries, bulk community DNA was extracted from 10g of each soil using the PowerMax Soil DNA Isolation Kit (MoBio Laboratories, cat#12988), per suggested protocols (http://www.mobio.com/images/custom/file/protocol/12988-10.pdf). Subsequently, DNA was sheared to a size range of approximately 500 – 5000 bp using the Covaris E210 sonicator with the manufacturer’s recommended settings (http://covarisinc.com/wp-content/uploads/pn_400069.pdf). Sheared DNA was size-selected by electrophoresis through a 1% low-melting point agarose gel in 0.5X Tris-Borate-EDTA (TBE) buffer stained with GelGreen dye (Biotium). A gel slice corresponding to 1000 – 5000 bp was excised from the gel and DNA was extracted using a QIAquick Gel Extraction Kit, eluting in 30ul of warm nuclease-free H2O (Qiagen). We chose this fragment size range because small fragment libraries, while sacrificing the ability to capture large gene clusters or very large genes, typically contain many more unique clones and therefore provide significantly more sampling depth than do large-insert libraries. Given the tremendous genetic diversity in soil, and the fact resistance is often (though not always) encoded by single genes, we favored fragment sizes that typically encode one to three bacterial genes. Purified DNA was then end-repaired using the End-It DNA End Repair kit (Epicentre) with the following protocol:
-
For each volume of 30μl QIAquick eluate, add the following:
5μl dNTP mix (2.5mM)
5μl ATP (10mM)
5μl 10X End-Repair Buffer
1μl End-Repair Enzyme Mix
4μl nuclease-free H2O to a final volume of 50μl
Mix gently and incubate at room temperature for 45 minutes
Heat-inactivate the reaction at 70°C for 15 minutes
End-repaired DNA was then purified using the QIAquick PCR purification kit (Qiagen) and quantified using the Qubit fluorometer BR assay kit (http://tools.invitrogen.com/content/sfs/manuals/mp32850.pdf) and ligated into the pZE21 MCS 1 vector28 at the HincII site. The pZE21 vector was linearized at the HincII site using inverse PCR with the blunt-end PFX polymerase (Life technologies) per the following reaction conditions:
-
Mix the following in a 50μl reaction volume:
10μl of 10x PFX Reaction Buffer
1.5μl of 10mM dNTP mix (New England Biolabs, NEB)
1μl of 50mM MgSO4
5μl of PFX enhancer solution
1μl of 100pg/μl circular pZE21
0.4μl of PFX DNA polymerase
0.75μl Forward Primer (5′ GACGGTATCGATAAGCTTGAT 3′)
0.75μl Reverse Primer (5′ GACCTCGAGGGGGGG 3′)
29.6μl of nuclease-free H2O to a final volume of 50ul
-
Cycle temperature as follows:
95°C for 5 minutes
-
35 cycles of the following:
95°C for 45 seconds
55°C for 45 seconds
72°C for 2 minutes, 30 seconds
72°C for 5 minutes
Linearized pZE21 was then size-selected (~2200bp) on a 1% low-melting point agarose gel (0.5X TBE) stained with GelGreen dye (Biotium) and purified as described above. Pure vector was dephosphorylated using calf intestinal phosphatase (CIP, NEB) by adding 1/10th reaction volume of CIP, 1/10th reaction volume of NEB buffer 3, and nuclease-free H2O to the vector eluate (exact volumes depend on reaction scale) and incubating at 37°C overnight before heat-inactivation for 15 minutes at 70°C. End-repaired metagenomic DNA and linearized vector were then ligated together using the Fast Link Ligation Kit (Epicentre) at a 5:1 mass ratio of insert:vector using the following protocol (as insert and vector were similarly-sized, the mass ratio approximates a molar ratio):
-
Mix the following:
1.5μl 10X Fast-Link Buffer
0.75μl ATP (10mM)
1μl Fast-Link DNA Ligase (2U/μl)
5:1 mass ratio of metagenomic DNA to vector
Nuclease-free H2O to a final reaction volume of 15μl
Incubate at room temperature overnight
Heat inactivate for 15 minutes at 70°C
After heat-inactivation, ligation reactions were dialyzed for 30 minutes using a 0.025 μm cellulose membrane (Millipore cat. #VSWP09025) and the full reaction volume used for transformation by electroporation into 50μl E. coli MegaX (Invitrogen). Electroporation was conducted using manufacturer’s recommendations (http://tools.invitrogen.com/content/sfs/manuals/megax_man.pdf), and cells were recovered in 1ml Recovery Medium (Invitrogen) at 37°C. Libraries were titered by plating out 0.1μL and 0.01μL of recovered cells onto Luria-Bertani (LB) agar (5g Yeast Extract, 5g NaCl, 10g of Tryptone, 12g Agar in 1L H2O) plates containing 50μg/ml Kanamycin. For each library, insert size distribution was estimated by gel electrophoresis of PCR products obtained by amplifying the insert from 12 randomly picked clones using primers flanking the HincII site of the multiple cloning site of the pZE21 MCS1 vector (which contains a selectable marker for kanamycin resistance). The average insert size across all libraries was determined to be 2000 bp, and library size estimates calculated by multiplying the average PCR-based insert size by the number of titered colony forming units (CFUs) after transformation recovery. The rest of the recovered cells were inoculated into 10mL of LB containing 50μg/mL kanamycin and grown overnight. The overnight culture was frozen down with 15% glycerol and stored at −80°C for subsequent screening.
Selection of Antibiotic Resistant Clones from Soil Metagenomic Libraries
For each soil metagenomic library, selections for resistance to each of 18 antibiotics (at concentrations indicated in table S2) was performed using Mueller-Hinton (MH) agar (2g Beef Infusion Solids, 1.5g Starch, 17g agar, 17.5g Casein hydrolysate, pH 7.4, in a final volume of 1L). For each metagenomic library, the number of cells plated on each antibiotic selection represented 10x the number of unique CFUs in the library, as determined by titers during library creation. Depending on the titer of live cells following library amplification and storage, the appropriate volume of freezer stocks were either diluted to 100μl using LB broth or centrifuged and reconstituted in this volume for plating. After plating (using sterile glass beads), antibiotic selections were incubated at 37°C for 18 hours to allow the growth of clones containing an antibiotic-resistant DNA insert. After overnight growth, all colonies from a single antibiotic plate (soil by antibiotic selection) were collected by adding 750μl of 15% LB-glycerol to the plate and scraping with an L-shaped cell scraper (Fisher Scientific cat#03-392-151) to gently remove colonies from the agar. The liquid ‘plate scrape culture’ was then collected and this process was repeated a second time to ensure that all colonies were removed from the plate. The bacterial cells were then stored at −80°C before PCR amplification of antibiotic-resistant metagenomic fragments and Illumina library creation.
Amplification of Antibiotic Resistant Metagenomic DNA Fragments
Freezer stocks of antibiotic-resistant transformants were thawed and 300μl of cells pelleted by centrifugation at 13,000 rpm for two minutes and gently washed with 1ml of nuclease-free H2O. Cells were subsequently pelleted a second time and re-suspended in 30μl nuclease-free H2O. Re-suspensions were then frozen at −20°C for one hour and thawed to promote cell lysis. The thawed re-suspension was then pelleted by centrifugation at 13,000 rpm for two minutes and the resulting supernatant used as template for amplification of resistance-conferring DNA fragments by PCR with Taq DNA polymerase (NEB). A sample PCR reaction consisted of 2.5μl of template, 2.5μl of ThermoPol reaction buffer (NEB), 0.5μl of 10mM dNTPs (NEB), 0.5μl of Taq polymerase (5U/μl), 3μl of a custom-primer mix, and 16μl of nuclease-free H2O to bring the final reaction volume to 25μl. The custom primer mix consisted of three forward and three reverse primers, each targeting the sequence immediately flanking the HincII site in the pZE21 MCS1 vector, and staggered by one base-pair. The staggered primer mix ensured diverse nucleotide composition during early Illumina sequencing cycles and contained the following primer volumes (from a 10μM stock) in a single PCR reaction: [Primer F1, 5′ CCGAATTCATTAAAGAGGAGAAAG, 0.5μl]; [Primer F2, 5′ CGAATTCATTAAAGAGGAGAAAGG, 0.5μl]; [Primer F3, 5′ GAATTCATTAAAGAGGAGAAAGGTAC, 0.5μl]; [Primer R1, 5′ GATATCAAGCTTATCGATACCGTC, 0.21μl]; [Primer R2, 5′ CGATATCAAGCTTATCGATACCG, 0.43μl] ; [Primer R3, 5′ TCGATATCAAGCTTATCGATACC, 0.86μl]. PCR reactions were then amplified using the following thermocycler conditions: 94°C for 10 minutes, 25 cycles of 94°C for 5 minutes + 55°C for 45 seconds + 72°C for 5.5 minutes, and 72°C for 10 minutes. The amplified metagenomic inserts were then cleaned using the Qiagen QIAquick PCR purification kit and quantified using the Qubit fluorometer HS assay kit (http://tools.invitrogen.com/content/sfs/manuals/mp32851.pdf).
Illumina Sample Preparation and Sequencing
For amplified metagenomic inserts from each antibiotic selection, 0.5μg of PCR product was diluted to a total volume of 100μl in Qiagen EB buffer and then sheared to 150–200bp fragments using the BioRuptor XL (http://www.sibcb.ac.cn/cfmb/download/BioruptorManual.pdf). Sonication consisted of nine 10 minute cycles of 30 seconds ON (high power setting), 30 seconds OFF. Between each 10 minute cycle, ice was added to the water bath to prevent overheating. Following sonication, sheared DNA was purified and concentrated using the QIAGEN MinElute PCR Purification Kit and eluted in 20μl pre-warmed nuclease-free H2O. This eluate was then used as input for Illumina library preparation. In the first step of library preparation, sheared DNA was end-repaired by mixing the 20μl of eluate with 2.5μl T4 DNA ligase buffer with 10mM ATP (10X, NEB), 1μl dNTPs (10mM, NEB), 0.5μl T4 polymerase (3U/μl, NEB), 0.5μl T4 PNK (10U/μl, NEB), and 0.5μl Taq Polymerase (5U/μl, NEB) for a total reaction volume of 25μl. The reaction was incubated at 25°C for 30 minutes followed by 20 minutes at 75°C.
Next, to each end-repaired sample, 5μl of 1μM pre-annealed, barcoded sequencing adapters were added (adapters were thawed on ice). Barcoded adapters consisted of a unique 7bp oligonucleotide sequence specific to each antibiotic selection, facilitating the de-multiplexing of mixed-sample sequencing runs. Forward and reverse sequencing adapters were stored in TES buffer (10mM Tris, 1mM EDTA, 50 mM NaCl, pH 8.0) and annealed by heating the 1μM mixture to 95°C followed by a slow cool (0.1°C/second) to a final holding temperature of 4°C. After the addition of barcoded adapters, samples were incubated at 16°C for 40 minutes and then for 10 minutes at 65°C. Before size-selection, 10μl each of adapted-ligated samples were combined into pools of 12 and concentrated by elution through a Qiagen MinElute PCR Purification Kit, eluting in 14μl of Qiagen elution buffer.
The pooled, adapter-ligated, sheared DNA was then size-selected on a 2% agarose gel in 0.5X TBE, stained with GelGreen dye (Biotium). DNA fragments were combined with 2.5uL 6X Fermentas Orange loading dye before loading on to the gel. Adaptor-ligated DNA was extracted from gel slices corresponding to DNA of 300–400bp using a QIAGEN MinElute Gel Extraction kit. The purified DNA was enriched by PCR using 12.5μL 2X Phusion HF Master Mix and 1μL of 10μM Illumina PCR Primer Mix in a 25μL reaction using 2μL of purified DNA as template. DNA was amplified at 98°C for 30 seconds followed by 18 cycles of 98°C for 10 seconds, 65°C for 30 seconds, 72°C for 30 seconds with a final extension of 5 minutes at 72°C. Afterwards, the DNA concentration was measured using the Qubit fluorometer (HS assay) and 10 nM of each sample were pooled for sequencing. Subsequently, samples were submitted for Illumina Hi-Seq paired-end 101bp sequencing using the HiSeq 2000 platform at GTAC (Genome Technology Access Center, Washington University in St. Louis). In total, four sequence runs were performed at concentrations ranging from 7 to 9 pM per lane.
Assembly of Illumina Reads into Causal Resistance Fragments, and Subsequent Annotation
Illumina paired-end sequence reads were binned by barcode (exact match required), such that independent selections were assembled and annotated in parallel. Assembly of the resistance-conferring DNA fragments from each selection was achieved using PARFuMS (Parallel Annotation and Reassembly of Functional Metagenomic Selections); a tool developed specifically for the high-throughput assembly and annotation of functional metagenomic selections4. Assembly with PARFuMS consists of: (i) three iterations of variable job size with the short-read assembler Velvet29, (ii) two iterations of assembly with Phrap30, and (iii) custom scripts to clean sequence reads, remove chimeric assemblies, and link contigs by coverage and common annotation, as described4. In addition to outperforming traditional, Sanger-based methods for characterizing functional selections, PARFuMS has also been successfully applied to the interrogation of both soil4 and fecal31 resistomes. Of the 324 selections performed, 222 yielded antibiotic-resistant E. coli transformants (Extended Data Fig. 1), of which 219 were successfully sequenced and assembled into contigs larger than 500bp. To annotate these assembled contigs, we opted to upgrade the previous implementation of PARFuMS, replacing annotation by BlastX homology to COG32 with a profile Hidden Markov Model (HMM) based approach. Open reading frames (ORFs) were predicted using the gene-finding algorithm MetaGeneMark33 and annotation performed by searching the amino acid sequence against multiple profile HMM databases with HMMER334, including TIGRFAMS35, PFams36, and a collection of custom-built, resistance gene-specific profile HMMs (dantaslab.wustl.edu/resfams). MetaGeneMark was run using default gene-finding parameters while hmmscan (HMMER3) was run with the option “--cut_ga”, requiring genes meet profile-specific gathering thresholds (rather than a global, more permissive, default log odds cutoff) before receiving annotation. An ORF from a resistance-conferring DNA fragment was labeled an antibiotic resistance gene (ARG) if it met one of the following criteria: (i) it surpassed strict, profile-specific gathering thresholds from the custom-built set of profile HMMs, (ii) it matched obvious antibiotic resistance functions from the TIGRFAMS or PFams databases (e.g. metallo β-lactamase, chloramphenicol phosphotransferase, MFS transporter), or (iii) the ORF was sub-cloned from its original context and confirmed to confer antibiotic resistance when expressed in E. coli. In total, 2895 of the 8882 assembled ORFs (32.6%) could be confidently assigned an ARG label through one of these routes, representing 2730 unique sequences. To generate more encompassing counts of general resistance functions (e.g. β-lactamases), gene counts were summed across all annotations that clearly belonged to the parent function (e.g. class A β-lactamases, metallo β-lactamases, TEM β-lactamases), informed by established ARG ontology37. Annotations were categorized as mobility elements based on string matches to one of the following keywords: transposase, transposon, conjugative, integrase, integron, recombinase, conjugal, mobilization, recombination, plasmid.
Percent Identity Comparisons of Recovered Open Reading Frames against NCBI
Percent identity comparisons using (i) all ORFs or (ii) all ARGs were conducted via a BlastX query against the NCBI protein Non-Redundant (NR) database (retrieved August 20th, 2013). For each ORF, the NCBI entry that generated the best local alignment was used to create global alignments with estwise (http://dendrome.ucdavis.edu/resources/tooldocs/wise2/doc_wise2.html). The following options were used in global alignment: “-init global” and “-alg 333”. From this alignment, global percent identities were calculated as the number of matched amino acids divided by the full length of the shorter of the two sequences compared.
Comparison of ARG Content between Soils
To compare the ARG composition of various soils, a count matrix was generated where each row represented a given soil metagenomic library and each column was represented by a specific annotation (i.e. a profile HMM). Before populating each cell of the matrix, genes duplicated as a result of redundant assembly were collapsed into a single sequence with CD-HIT38. For each selection, all genes perfectly identical over the length of the shorter sequence were collapsed into a single sequence using CD-HIT with the parameters: -c 1.0 -aS 1.0 -g 1 -d 0 (the longest gene in the 100% identical cluster was retained for downstream analyses). Subsequently, fasta files of all genes sequences from all antibiotic selections for a given soil were concatenated and perfectly-identical genes again collapsed to a single sequence, using CD-HIT with the same parameters. Thus, the same gene captured on multiple selections from a given soil would be counted only once for that soil. These unique counts (“raw counts”) only considered genes over 350bp and were used in the creation of all figures summarizing the total resistance functions recovered (e.g. figure 1C). Selections containing trimethoprim and D-Cycloserine predominantly recovered dihydrofolate reductases, D-alanine—D-alanine ligases, and thymidylate synthases (these annotations accounted for 92.5% of ARGs from these selections). Because these genes represent target alleles of their respective antibiotics, and are present in nearly all bacterial genomes, their overexpression can provide resistance but the functions themselves do not represent an evolutionary response to overcome toxicity. Thus, we omitted these selections from cross-soil resistome comparisons (Extended Data Fig. 2).
As the size of metagenomic libraries varied stochastically by soil sample (Extended Data Fig. 1), raw ARG counts were normalized to metagenomic library size to account for inconsistent sampling depth, facilitating comparison between soils. Metagenomic libraries from soils S18 and S21 were both under 2 Gb in size, over four-fold smaller than next smallest library (S06), resulting in distinctly fewer selections yielding antibiotic resistance (Extended Data Fig. 1). Thus, these libraries were omitted from cross-soil comparisons and ARG counts normalized to reflect the sampling depth achieved for the smallest remaining library, from soil S06 (library size: 6.9Gb, roughly 3.5 million 2Kb DNA fragments). Both raw and normalized count matrices were created for the following gene-sets: (i) all recovered ORFs (including ARGs and co-selected passenger genes), (ii) only unique ARGs, (iii) ARGs from only CC soils, and (iv) ARGs from only KBS soils. When counts were normalized across only KBS soils, the smallest library from KBS (S14; 10.9 Gb) was used to normalize raw counts. Normalized count matrices were then used to calculate Bray-Curtis distances between soil samples (using the vegan package in R), which in turn were used in cross-soil analyses (e.g. principal coordinate analyses, Procrustes analyses, mantel tests, etc).
The percentage of ARGs shared across any two soils was determined using sequences collected from selections without trimethoprim or D-cycloserine. Unique gene sequences from each soil were then clustered using CD-HIT with the following parameters: -c 0.99 (99% sequence identity) -aS 1.0 (over the full length of the shorter fragment) -g 1 (find the optimal cluster). Any sequences from more than one soil in a given 99% identity sequence bin were counted toward the fraction of shared sequences.
16S rRNA Analysis
Sequencing of the 16S rRNA gene was performed on a Roche 454 GS FLX using Titanium chemistry and described previously8. Briefly, the 16S primers 515F and 906R were used for their ability to generate accurate phylogenetic information with few taxonomic biases8. Primers also included a 454 sequencing adapter and the reverse primer contained a 12bp error-correcting barcode, generating approximately 300bp sequencing reads. All downstream processing was performed with the QIIME (v1.4) software suite39 and was reproduced from previous work8. After sequencing, 16S reads were split by sample, quality-filtered using the QIIME script split_libraries.py with the options: -w 50 -g -r -l 150 -L 350, and then denoised using denoise_wrapper.py with default parameters. All sequence analyses were performed using the QIIME analysis pipeline39, per the usage information found at http://qiime.org/tutorials/tutorial.html. Briefly, operational taxonomic units (OTUs) were picked at 97% sequence identity and taxonomic identity assigned by classification with RDP. For comparisons across soils, samples were rarefied to 1974 reads and both phylogenetic (unweighted Unifrac and weighted Unifrac distances40,41) and taxonomic (Bray-Curtis distance) were calculated. For one sample (soil S08), no 16S rRNA gene sequence data was available. Generally, all three measures of community similarity were used to examine relationships between the ARG content and phylogenetic composition of soil microbial communities, and supported the same conclusion: resistomes and bacterial community composition are correlated.
Taxonomic Assignment of Assembled Resistance-Conferring DNA Fragments
To predict the taxonomic origin of functionally-selected DNA fragments, we used RAIphy, a composition-based classifier that achieves accurate taxonomic prediction without a strict reliance on phylogenetically close sequences in public databases, as compared to similarity-based methods19. Specifically, RAIphy compares the relative abundance of all unique 7-mers within a query sequence to profiles of 7-mer abundance from RefSeq genomes, generating a score for each profile using the log-odd ratios between observed and expected frequency of each 7-mer. Prediction accuracy is then improved through an iterative refinement of genome models based on the 7-mer profiles of clusters of fragments of unknown origin in the query set. RAIphy reportedly performs well for classifying DNA fragments assembled from metagenomic sources19, especially for lower-resolution taxonomic predictions. Thus, we reasoned it may be well-suited for phylum-level predictions of the originating taxa for our assembled contigs.
To convince ourselves of RAIphy’s accuracy, we asked it to predict the source phylum of metagenomic DNA fragments originating from pools of genome-sequenced commensals of the human gut, selected via functional metagenomics for antibiotic resistance and assembled with PARFuMS (in exactly the same manner as soil resistomes were interrogated). Because full genomes existed for these organisms, we could determine with high confidence the true origin for functionally-selected fragments; RAIphy’s predictions of the source bacterial phylum correctly classified the assembled fragment with 95% accuracy (n=2747), indicating the software is well-suited for the phylum-level classification of assembled metagenomic sequences. To predict the source phylum of resistance-conferring soil DNA fragments, we used all assembled fragments longer than 500bp (n=4655), seeded predictions using the RAIphy’s 2012 RefSeq database, and binned DNA fragments with the ‘iterative refinement’ option. For all downstream analyses, only the phylum-level predictions from RAIphy were used as (i) we had higher confidence in these predictions, and (ii) conclusions from these data may be more broadly applicable to different soils and other environments.
Assessing HGT potential for ARGs in Soil and Pathogens
To test the hypothesis that ARGs in the soil have less potential for HGT than those in human pathogens, we compared ARGs from our functional selections to ARGs in fully-sequenced bacterial genomes from 433 common human pathogens and 153 non-pathogenic soil organisms. Genomes were stratified by pathogenicity and habitat according to the metadata presented in a recent paper examining general trends in horizontal gene transfer among bacteria across ecology13. A list of NCBI taxonomy IDs for human pathogens was obtained for all organisms from this publication with an ‘Environment’ label of “Human” and a ‘Pathogenicity’ label of “Pathogen”. Taxonomy IDs for non-pathogenic soil bacteria were collected for all organisms with an ‘Environment’ labeled “non-human” that also contained the term “soil”; bacteria deemed pathogens were also omitted from the soil set. For each set of NCBI taxonomy IDs, all NCBI RefSeq genomes and plasmids were then downloaded. In total, 983 sequences from 433 human pathogens (downloaded January 18, 2014) and 296 sequences from 153 non-pathogenic soil bacteria (downloaded February 3, 2014) were obtained, and are enumerated in Supplementary Data 2.
We next re-annotated each bacterial genome using the same methods use to annotate assembly data from our functional selections. Briefly, ORFs were predicted using the gene-finding algorithm MetaGeneMark33 and annotation performed by searching the amino acid sequence against multiple profile HMM databases with HMMER334, including TIGRFAMS35, PFams36, and a collection of custom-built, resistance gene-specific profile HMMs (dantaslab.wustl.edu/resfams). MetaGeneMark was run using default gene-finding parameters while hmmscan (HMMER3) was run with the option “--cut_ga”, requiring genes meet profile-specific gathering thresholds (rather than a global, more permissive, default log odds cutoff) before receiving annotation. Because our functional selections captured only those DNA fragments that confer antibiotic resistance, we modeled our functional metagenomic dataset using genome collections by seeding mock ‘metagenomic’ DNA fragments at each predicted ARG across our genomes. For our Monte Carlo simulations of each genome set, we mimicked functional metagenomic DNA fragments by moving upstream and downstream from each seed ARG by a chosen genetic distance. These distances were selected from an empirical distribution of distances observed in our functional selections. For each ARG from our functional selections, the distance between the ARG boundary and the end of the assembled DNA fragment was recorded. These distance-pairs were cataloged for all ARGs, and randomly selected to create a DNA fragment centered on each ARG in all bacterial genomes. In this fashion, we modeled a functional selection from each genome set based on the fragment-size distribution observed in our soil selections. Then, for each simulated DNA fragment, the number of mobile DNA elements over 350bp contained within its’ boundaries were counted and ultimately displayed as a proportion of total DNA fragments queried. This sampling procedure was repeated 1,000 times for each genome set, each time with randomly-selected upstream/downstream distance pairs, and the proportion of mobility elements compared to that observed from our soil functional selections was presented (figure 4A). If a single fragment contained multiple ARGs, the additional ARGs were not used to seed future fragments in that simulation. Since ARGs were drawn randomly from simulation to simulation, each member of a co-localized ARG group was equally likely to seed a DNA fragment.
In figure 4B, the same data is plotted as a function of the distance from each ARG across pathogen genomes, non-pathogenic soil genomes, and assembled data from soil functional selections. Because the size of DNA fragments in our functional selections is constrained by the shearing conditions employed, their data could only be evaluated to a genetic distance of approximately 1.5Kb from each ARG. Nonetheless, the incidence of co-occurring ARGs and mobility elements is higher in pathogens than in soil genomes or functionally-selected soil metagenomes, at all genetic distances tested greater than 580bp. Annotations were categorized as mobility elements based on string matches to one of the following keywords: transposase, transposon, conjugative, integrase, integron, recombinase, conjugal, mobilization, recombination, plasmid.
Statistical Analyses
QIIME was used to perform both principal coordinate analyses (PCoA, using principal_coordinates.py) and Procrustes transformations (using the script transform_coordinate_matrices.py, with two PCoA plots as input; one built from 16S rRNA gene sequence data and the other from resistome data, see ref. 11 for detailed description). The significance of any Procrustes transformation was determined by comparing the measure of fit, M2, between matched-sample PCoA plots to a distribution of M2 values empirically determined from 10,000 label permutations. In each of the 10,000 permutations, the M2 value (the sum of squared distances between matched sample pairs) was recalculated and the original M2 value compared to the simulated distribution in order to compute a p-value. Because the M2 value is dependent on the sample size and data structure, it is generally not comparable across Procrustes transformations. Rather, p-values were used to compare different Procrustes plots. Regardless of whether transformations were performed using phylogenetic (unweighted or weighted Unifrac distances) or taxonomic (Bray-Curtis distances) measures of bacterial community composition, or considered only two or all dimensions of the relevant PCoA plots, we observed significant agreement between ARG content and bacterial composition when considering (i) all soils or (ii) CC soils (p < 0.05, table S8).
Alpha-diversity plots (Extended Data Fig. 1) were generated by sampling (without replacement) an increasing subset of ARGs from each soil sample, and tabulating the observed number of unique annotations or Shannon diversity index at each rarefaction depth. Reported values (Extended Data Fig. 1) are the result of averaging ten independent samplings at each rarefaction depth, and were generated using the QIIME scripts multiple_rarefactions.py and alpha_diversity.py. The summary figure was generated in R (v2.15.2). Mantel tests were performed using the PRIMER-E software package 42 while all other statistics (ANOSIM, Fisher’s exact test, Wilcoxon rank sum test, Student’s T test) were performed using the ‘vegan’ package in R.
Supplementary Material
Acknowledgments
We thank M. Pesesky for access to and assistance with the dataset used to benchmark RAIphy’s performance, B. Wang for suggested improvements to Illumina library preparation, the Genome Technology Access Center at Washington University in St. Louis for generating Illumina sequence data, M. Sherman for discussions on modeling pathogen HGT potential, and members of the Dantas lab for thoughtful discussions on the results and analyses presented herein. This work was supported by awards to G.D. through the Children’s Discovery Institute (MD-II-2011-117), the International Center for Advanced Renewable Energy and Sustainability at Washington University, the National Academies Keck Futures Initiatives (Synthetic Biology - SB2), and the NIH Director’s New Innovator Award (DP2-DK-098089). M.K.G. is supported by a Mr. and Mrs. Spencer T. Olin Fellowship for Women in Graduate Study at Washington University. K.J.F. and M.K. G. are NSF graduate research fellows (award number DGE-1143954). Kevin Forsberg was supported by the ‘NIGMS Cell and Molecular Biology Training Grant’ (GM: 007067).
Footnotes
Supplementary Information is linked to the online version of the paper at www.nature.com/nature
Author Contributions N.F., C.L.L., and R.K. provided soils and 16S rRNA gene sequencing data; G.D. conceived functional selections; S.P. created metagenomic libraries, performed functional selections, and prepared sequencing libraries; K.J.F. assembled sequence data from functional selections and annotated ARGs with assistance from M.K.G.; M.K.G. built the custom ARG profile HMM database; K.J.F. performed genomic and ecological analyses and wrote the manuscript with contributions from M.K.G., R.K., N.F., and G.D.
All assembled sequences have been deposited to Genbank with IDs KJ691878 - KJ696532 and raw reads to SRA under the accession SRP041174.
Reprints and permissions information is available at www.nature.com/reprints.
The authors declare no competing financial interests.
Readers are welcome to comment on the online version of this article at www.nature.com/nature.
References
- 1.D’Costa VM, et al. Antibiotic resistance is ancient. Nature. 2011;477:457–461. doi: 10.1038/nature10388. [DOI] [PubMed] [Google Scholar]
- 2.Allen HK, Moe LA, Rodbumrer J, Gaarder A, Handelsman J. Functional metagenomics reveals diverse beta-lactamases in a remote Alaskan soil. The ISME journal. 2009;3:243–251. doi: 10.1038/ismej.2008.86. [DOI] [PubMed] [Google Scholar]
- 3.Allen HK, et al. Call of the wild: antibiotic resistance genes in natural environments. Nature reviews. Microbiology. 2010;8:251–259. doi: 10.1038/nrmicro2312. [DOI] [PubMed] [Google Scholar]
- 4.Forsberg KJ, et al. The shared antibiotic resistome of soil bacteria and human pathogens. Science. 2012;337:1107–1111. doi: 10.1126/science.1220761. [DOI] [PMC free article] [PubMed] [Google Scholar]
- 5.Wright GD. Antibiotic resistance in the environment: a link to the clinic? Current opinion in microbiology. 2010;13:589–594. doi: 10.1016/j.mib.2010.08.005. [DOI] [PubMed] [Google Scholar]
- 6.Benveniste R, Davies J. Aminoglycoside antibiotic-inactivating enzymes in actinomycetes similar to those present in clinical isolates of antibiotic-resistant bacteria. Proceedings of the National Academy of Sciences of the United States of America. 1973;70:2276–2280. doi: 10.1073/pnas.70.8.2276. [DOI] [PMC free article] [PubMed] [Google Scholar]
- 7.Langille MG, et al. Predictive functional profiling of microbial communities using 16S rRNA marker gene sequences. Nature biotechnology. 2013;31:814–821. doi: 10.1038/nbt.2676. [DOI] [PMC free article] [PubMed] [Google Scholar]
- 8.Fierer N, et al. Comparative metagenomic, phylogenetic and physiological analyses of soil microbial communities across nitrogen gradients. The ISME journal. 2012;6:1007–1017. doi: 10.1038/ismej.2011.159. [DOI] [PMC free article] [PubMed] [Google Scholar]
- 9.Fierer N, et al. Cross-biome metagenomic analyses of soil microbial communities and their functional attributes. Proceedings of the National Academy of Sciences of the United States of America. 2012;109:21390–21395. doi: 10.1073/pnas.1215210110. [DOI] [PMC free article] [PubMed] [Google Scholar]
- 10.Fierer N, et al. Reconstructing the microbial diversity and function of pre-agricultural tallgrass prairie soils in the United States. Science. 2013;342:621–624. doi: 10.1126/science.1243768. [DOI] [PubMed] [Google Scholar]
- 11.Muegge BD, et al. Diet drives convergence in gut microbiome functions across mammalian phylogeny and within humans. Science. 2011;332:970–974. doi: 10.1126/science.1198719. [DOI] [PMC free article] [PubMed] [Google Scholar]
- 12.Zaneveld JR, Lozupone C, Gordon JI, Knight R. Ribosomal RNA diversity predicts genome diversity in gut bacteria and their relatives. Nucleic acids research. 2010;38:3869–3879. doi: 10.1093/nar/gkq066. [DOI] [PMC free article] [PubMed] [Google Scholar]
- 13.Smillie CS, et al. Ecology drives a global network of gene exchange connecting the human microbiome. Nature. 2011;480:241–244. doi: 10.1038/nature10571. [DOI] [PubMed] [Google Scholar]
- 14.Stokes HW, Gillings MR. Gene flow, mobile genetic elements and the recruitment of antibiotic resistance genes into Gram-negative pathogens. FEMS microbiology reviews. 2011;35:790–819. doi: 10.1111/j.1574-6976.2011.00273.x. [DOI] [PubMed] [Google Scholar]
- 15.Walsh C. Molecular mechanisms that confer antibacterial drug resistance. Nature. 2000;406:775–781. doi: 10.1038/35021219. [DOI] [PubMed] [Google Scholar]
- 16.Pehrsson EC, Forsberg KJ, Gibson MK, Ahmadi S, Dantas G. Novel resistance functions uncovered using functional metagenomic investigations of resistance reservoirs. Frontiers in microbiology. 2013;4:145. doi: 10.3389/fmicb.2013.00145. [DOI] [PMC free article] [PubMed] [Google Scholar]
- 17.Delmont TO, et al. Structure, fluctuation and magnitude of a natural grassland soil metagenome. The ISME journal. 2012;6:1677–1687. doi: 10.1038/ismej.2011.197. [DOI] [PMC free article] [PubMed] [Google Scholar]
- 18.Jacoby GA, Munoz-Price LS. The new beta-lactamases. The New England journal of medicine. 2005;352:380–391. doi: 10.1056/NEJMra041359. [DOI] [PubMed] [Google Scholar]
- 19.Nalbantoglu OU, Way SF, Hinrichs SH, Sayood K. RAIphy: phylogenetic classification of metagenomics samples using iterative refinement of relative abundance index profiles. BMC bioinformatics. 2011;12:41. doi: 10.1186/1471-2105-12-41. [DOI] [PMC free article] [PubMed] [Google Scholar]
- 20.Ramirez KS, Lauber CL, Knight R, Bradford MA, Fierer N. Consistent effects of nitrogen fertilization on soil bacterial communities in contrasting systems. Ecology. 2010;91:3463–3470. doi: 10.1890/10-0426.1. discussion 3503–3414. [DOI] [PubMed] [Google Scholar]
- 21.Ventura M, et al. Genomics of Actinobacteria: tracing the evolutionary history of an ancient phylum. Microbiology and molecular biology reviews : MMBR. 2007;71:495–548. doi: 10.1128/MMBR.00005-07. [DOI] [PMC free article] [PubMed] [Google Scholar]
- 22.Aminov RI, Mackie RI. Evolution and ecology of antibiotic resistance genes. FEMS Microbiol Lett. 2007;271:147–161. doi: 10.1111/j.1574-6968.2007.00757.x. [DOI] [PubMed] [Google Scholar]
- 23.Davies J, Davies D. Origins and evolution of antibiotic resistance. Microbiology and molecular biology reviews : MMBR. 2010;74:417–433. doi: 10.1128/MMBR.00016-10. [DOI] [PMC free article] [PubMed] [Google Scholar]
- 24.Medeiros AA. Evolution and dissemination of beta-lactamases accelerated by generations of beta-lactam antibiotics. Clinical infectious diseases : an official publication of the Infectious Diseases Society of America. 1997;24 (Suppl 1):S19–45. doi: 10.1093/clinids/24.supplement_1.s19. [DOI] [PubMed] [Google Scholar]
- 25.Dantas G, Sommer MO, Oluwasegun RD, Church GM. Bacteria subsisting on antibiotics. Science. 2008;320:100–103. doi: 10.1126/science.1155157. [DOI] [PubMed] [Google Scholar]
- 26.Boucher HW, et al. Bad bugs, no drugs: no ESKAPE! An update from the Infectious Diseases Society of America. Clinical infectious diseases : an official publication of the Infectious Diseases Society of America. 2009;48:1–12. doi: 10.1086/595011. [DOI] [PubMed] [Google Scholar]
- 27.Knapp CW, Dolfing J, Ehlert PA, Graham DW. Evidence of increasing antibiotic resistance gene abundances in archived soils since 1940. Environmental science & technology. 2010;44:580–587. doi: 10.1021/es901221x. [DOI] [PubMed] [Google Scholar]
- 28.Lutz R, Bujard H. Independent and tight regulation of transcriptional units in Escherichia coli via the LacR/O, the TetR/O and AraC/I1-I2 regulatory elements. Nucleic acids research. 1997;25:1203–1210. doi: 10.1093/nar/25.6.1203. [DOI] [PMC free article] [PubMed] [Google Scholar]
- 29.Zerbino DR, Birney E. Velvet: algorithms for de novo short read assembly using de Bruijn graphs. Genome Res. 2008;18:821–829. doi: 10.1101/gr.074492.107. [DOI] [PMC free article] [PubMed] [Google Scholar]
- 30.de la Bastide M, McCombie WR. Assembling genomic DNA sequences with PHRAP. Chapter 11. John Wiley & Sons, Inc; 2007. 2008/04/23 edn. [DOI] [PubMed] [Google Scholar]
- 31.Moore AM, et al. Pediatric Fecal Microbiota Harbor Diverse and Novel Antibiotic Resistance Genes. PloS one. 2013;8:e78822. doi: 10.1371/journal.pone.0078822. [DOI] [PMC free article] [PubMed] [Google Scholar]
- 32.Tatusov RL, Galperin MY, Natale DA, Koonin EV. The COG database: a tool for genome-scale analysis of protein functions and evolution. Nucleic acids research. 2000;28:33–36. doi: 10.1093/nar/28.1.33. [DOI] [PMC free article] [PubMed] [Google Scholar]
- 33.Zhu W, Lomsadze A, Borodovsky M. Ab initio gene identification in metagenomic sequences. Nucleic acids research. 2010;38:e132. doi: 10.1093/nar/gkq275. [DOI] [PMC free article] [PubMed] [Google Scholar]
- 34.Finn RD, Clements J, Eddy SR. HMMER web server: interactive sequence similarity searching. Nucleic acids research. 2011;39:W29–37. doi: 10.1093/nar/gkr367. [DOI] [PMC free article] [PubMed] [Google Scholar]
- 35.Haft DH, et al. TIGRFAMs: a protein family resource for the functional identification of proteins. Nucleic acids research. 2001;29:41–43. doi: 10.1093/nar/29.1.41. [DOI] [PMC free article] [PubMed] [Google Scholar]
- 36.Bateman A, et al. The Pfam protein families database. Nucleic acids research. 2000;28:263–266. doi: 10.1093/nar/28.1.263. [DOI] [PMC free article] [PubMed] [Google Scholar]
- 37.McArthur AG, et al. The comprehensive antibiotic resistance database. Antimicrobial agents and chemotherapy. 2013;57:3348–3357. doi: 10.1128/AAC.00419-13. [DOI] [PMC free article] [PubMed] [Google Scholar]
- 38.Li W, Godzik A. Cd-hit: a fast program for clustering and comparing large sets of protein or nucleotide sequences. Bioinformatics. 2006;22:1658–1659. doi: 10.1093/bioinformatics/btl158. [DOI] [PubMed] [Google Scholar]
- 39.Caporaso JG, et al. QIIME allows analysis of high-throughput community sequencing data. Nature methods. 2010;7:335–336. doi: 10.1038/nmeth.f.303. [DOI] [PMC free article] [PubMed] [Google Scholar]
- 40.Lozupone C, Hamady M, Knight R. UniFrac--an online tool for comparing microbial community diversity in a phylogenetic context. BMC bioinformatics. 2006;7:371. doi: 10.1186/1471-2105-7-371. [DOI] [PMC free article] [PubMed] [Google Scholar]
- 41.Lozupone C, Lladser ME, Knights D, Stombaugh J, Knight R. UniFrac: an effective distance metric for microbial community comparison. The ISME journal. 2011;5:169–172. doi: 10.1038/ismej.2010.133. [DOI] [PMC free article] [PubMed] [Google Scholar]
- 42.Clarke KR, Gorley RN. PRIMER v6: User Manual/Tutorial. 6. PRIMER-E; Plymouth: 2006. [Google Scholar]
Associated Data
This section collects any data citations, data availability statements, or supplementary materials included in this article.


