

Abstract
Background
Glycated hemoglobin (HbA1c) predicts clinical cardiovascular disease or cardiovascular mortality. However, the relationship between HbA1c and myocardial injury following elective percutaneous coronary intervention (PCI) in patients with type 2 diabetes mellitus (DM) has not been investigated.
Objectives
The study sought to assess the relationship between HbA1c and myocardial injury following elective PCI in patients with type 2 DM.
Methods
We studied a cohort of consecutive 994 diabetic patients with coronary artery disease (CAD) undergoing elective PCI. Periprocedural myocardial injury was evaluated by analysis of troponin I (cTnI). The association between preprocedural HbA1c levels and the peak values of cTnI within 24 hours after PCI was evaluated.
Results
Peak postprocedural cTnI >1×upper limit of normal (ULN), >3×ULN and >5×ULN were detected in 543 (54.6%), 337 (33.9%) and 245 (24.6%) respectively. In the multivariate model, higher HbA1c levels were associated with less risk of postprocedural cTnI >1×ULN (odds ratio [OR], 0.85; 95% confidence interval [CI], 0.76–0.95; P = 0.005). There was a trend that higher HbA1c levels were associated with less risk of postprocedural cTnI >3×ULN (OR, 0.90; 95% CI, 0.81–1.02; P = 0.088). HbA1c was not associated with the risk of postprocedural cTnI elevation above 5×ULN (OR, 0.95; 95% CI, 0.84–1.08; P = 0.411).
Conclusions
The present study provided the first line of evidence that higher preprocedural HbA1c levels were associated with less risk of myocardial injury following elective PCI in diabetic patients.
Introduction
Glycated hemoglobin (HbA1c) is an index of metabolic control of diabetes, and reflects average blood glucose levels over the previous 2–3 months, including postprandial increases in the blood glucose level [1], [2]. There was compelling evidence suggested that the level of HbA1c predicted clinical cardiovascular disease or cardiovascular mortality [3]–[6]. However, the optimal glycemic control of diabetic patients with cardiovascular diseases was not well characterized. ADA, coupled with AHA and ACC just recommend less stringent HbA1c goals for diabetic patients with advanced macrovascular complications [7]. With the introduction of drug-eluting stents, the proportion of diabetic patients with coronary artery disease (CAD) who received percutaneous coronary intervention (PCI) is increasing. However, PCI is frequently accompanied with cardiac marker elevation after procedure or known as myocardial injury or infarction related to PCI [8], [9]. To date, we are not aware of any studies elucidating the impact of preprocedural glycemic control on periprocedural myocardial injury or infarction in patients with type 2 DM who underwent elective PCI. Thus, the aim of this study was to characterize the relation between HbA1c and periprocedural myocardial injury or infarction in patients with type 2 DM undergoing elective PCI.
Methods
Study population
The study complied with the Declaration of Helsinki, and was approved by the hospital ethnic review board (Fu Wai Hospital & National Center for Cardiovascular Diseases, Beijing, China). Informed written consent was obtained from all patients included in this study.
Between December 2010 and December 2012, 1032 consecutive diabetic patients with normal levels of cardiac troponin I (cTnI) and creatine kinase-MB (CK-MB) and without acute myocardial infarction in the past 4 weeks who attempt to undergo elective PCI at our center were eligible for this study. Of these patients, 33 patients were excluded because a total or subtotal chronic occlusion could not be crossed with a wire, 2 patients were excluded because a severely calcified or tortuous lesion could not be crossed with a balloon, 3 patients were excluded because treated with atheroablative, distal protection devices or aspiration thrombectomy. None of the patients died in the hospital. Thus, 994 patients were effectively included in the present study.
Adult patients with type 2 diabetes were identified based on recorded type 2 diabetes diagnosis or a prescription for oral hypoglycemic medication or insulin. Angiographic success of PCI was defined as residual stenosis less than 20% with stenting and residual stenosis less than 50% with balloon angioplasty only by visual estimation. Unstable angina was defined as rest angina, new-onset severe angina and increasing angina within 2 months. Periprocedural myocardial injury was defined as postprocedural cTnI >1×ULN. Secondly, postprocedural cTnI >3×ULN which was the diagnosis criteria of periprocedural myocardial infarction published in 2007 and postprocedural cTnI >5×ULN which was a requirement in the arbitrarily revised diagnosis criteria published in 2012 were also examined in this study [10], [11].
Percutaneous coronary intervention
The indication for PCI was based on the ACC/AHA recommendations and was performed by experienced interventional cardiologists. Before the procedure, all patients without contraindications received aspirin 100 mg daily or a loading dose of 300 mg depending on whether already taken daily aspirin therapy, and received clopidogrel 75 mg daily or a loading dose of 300 mg depending on whether already taken daily long-term clopidogrel therapy prior to intervention. All patients received either 5000 U or 70 U/kg bolus of unfractionated heparin just before procedure and an additional bolus of 2,000 to 3,000 U were given every hour if the procedure lasted for more than an hour. Vascular access and PCI type (angioplasty only, angioplasty and stenting, or primary stenting) were determined by the interventional cardiologist according to patients' characteristics. Total balloon inflation times and inflation pressures were determined by the interventional cardiologist according to the technical properties of the balloon and the stent. After the procedure, all patients continued with aspirin and clopidogrel therapy daily. Use of glycoprotein IIb/IIIa receptor antagonists or anticoagulants was at the discretion of the interventional cardiologist.
Electrocardiogram monitoring
All patients received a 12-lead Electrocardiogram record before, immediately after PCI, and in the case of the occurrence of symptoms which were interpreted as postprocedural ischaemic events. All patients received continuous Electrocardiogram monitoring using wireless technology after PCI during hospitalization.
Biochemical measurements
Fasting venous blood samples were obtained immediately before intervention for measurement of fasting glucose levels, HbA1c, CK-MB activity and lipid profile. Plasma HbA1C and glucose was determined with conventional standard techniques. Cardiac troponin I (cTnI) levels were determined in venous blood samples before PCI, 24 hours after PCI, and in the event of the occurrence of symptoms or signs suggestive of myocardial ischemia. cTnI was analyzed by an immunochemiluminometric assay (Access AccuTnI, Beckman Coulter, California). The upper limit of normal (ULN) was defined as the 99th percentile of normal population with a total imprecision of <10%. The ULN of this test was 0.04 ng/ml. The peak value of cTnI within 24 hours after procedure was used for statistical analysis.
Statistics
The baseline characteristics are presented according to the quartiles of HbA1c. Data are presented as mean ± SD, median with interquartile ranges, or frequencies with percentages, as appropriate. Comparisons among the HbA1c quartiles were made with analysis of variance, chi-square test, Fisher's exact test, Kruskal–Wallis test or Friedman test as appropriate. Univariate linear regression analyses were performed to determine the relation between clinical parameters and postprocedural cTnI levels. Variables with a P value <0.2 in the univariate linear regression were entered into a stepwise multivariable linear model to determine the independent predictive value of clinical parameters for postprocedural cTnI levels. Successful normalization of cTnI after log-transformation was evaluated using Kolmogorov-Smirnov test.
Logistic regression analyses were performed to determine the relationship of HbA1c with the occurrence of postprocedural cTnI elevations above various multiples of ULN. Logistic models were adjusted for variables independently associated with postprocedural cTnI levels. HbA1c was examined in quartiles and as continuous variables. A 2-tailed P value of <0.05 was considered statistically significant. All analyses were performed using SPSS version19.0 software (Chicago,Illinois,USA).
Results
Baseline characteristics according to quartiles of HbA1c
Baseline clinical characteristics according to quartiles of HbA1c were shown in Table 1. Fasting glucose, low-density lipoprotein cholesterol, C-reactive protein and triglycerides increased across the quartiles of HbA1c. Current smoking was more frequent in subjects with high HbA1c. There were no significant differences in distribution of sex, body mass index, hypertension, dyslipidemia, family history of CAD, unstable angina, prior MI, prior PCI, prior coronary artery bypass graft, high-density lipoprotein cholesterol, NT-proBNP, hemoglobin, preprocedural cTnI and medications at study entry among quartiles of HbA1c. Fasting glucose was highly correlated with HbA1c (r = 0.543, P<0.001). Higher quartiles of HbA1c were associated with less incidence of fasting glucose below 5 mmol/L (21.7%, 14.3%, 6.6% and 6.5% respectively; P<0.001).
Table 1. Baseline clinical characteristics.
| HbA1c at baseline | |||||
| Variable | Quartile 1 (n = 258) | Quartile 2 (n = 245) | Quartile 3 (n = 259) | Quartile 4 (n = 232) | P value |
| HbA1c, % | 6.17±0.34 | 6.74±0.12 | 7.38±0.29 | 9.13±1.01 | <0.001 |
| Glucose, mmol/L | 5.74±1.16 | 6.09±1.08 | 6.83±1.42 | 8.76±2.95 | <0.001 |
| Age, years | 59.39±9.49 | 60.84±9.34 | 59.56±8.65 | 58.49±8.31 | 0.039 |
| Male, n (%) | 186 (72.1) | 166 (67.8) | 181 (69.9) | 163 (70.3) | 0.769 |
| BMI, kg/m2 | 26.15±3.09 | 26.65±2.95 | 26.79±3.32 | 26.76±3.30 | 0.080 |
| Hypertension, n (%) | 193 (74.8) | 175 (71.4) | 187 (72.2) | 157 (67.7) | 0.374 |
| Dyslipidemia, n (%) | 227 (88.0) | 211 (86.1) | 218 (84.2) | 198 (85.3) | 0.651 |
| Current smoker, n (%) | 59 (22.9) | 79 (32.2) | 78 (30.1) | 79 (34.1) | 0.034 |
| FH, n (%) | 63 (24.4) | 57 (23.3) | 62 (23.9) | 40 (17.2) | 0.202 |
| UA, n (%) | 136 (52.7) | 144 (58.8) | 136 (52.5) | 125 (53.9) | 0.460 |
| Prior MI, n (%) | 61 (23.6) | 60 (24.5) | 57 (22.0) | 57 (24.6) | 0.898 |
| Prior PCI, n (%) | 80 (31.0) | 69 (28.2) | 76 (29.3) | 72 (31.0) | 0.877 |
| Prior CABG, n (%) | 8 (3.1) | 9 (3.7) | 7 (2.7) | 6 (2.6) | 0.896 |
| LDL-C, mg/dl | 89.78±31.61 | 92.92±29.47 | 94.85±31.18 | 100.12±33.83 | 0.003 |
| HDL-C, mg/dl | 40.36±9.77 | 40.74±9.18 | 41.42±11.97 | 39.59±8.61 | 0.234 |
| Triglyceride, mg/dl | 132.0 (92.8–177.1) | 140.8 (107.2–178.5) | 138.2 (98.3–199.3) | 143.0 (109.8–207.9) | 0.024 |
| hs-CRP, mg/L | 1.42 (0.83–2.66) | 1.76 (1.07–3.92) | 1.76 (0.97–2.96) | 2.26 (1.14–4.09) | <0.001 |
| NT-proBNP, fmol/ml | 515.1 (410.0–683.3) | 533.9 (424.5–699.7) | 513.9 (413.5–683.7) | 564.8 (461.3–732.7) | 0.053 |
| Hemoglobin, g/L | 138.96±15.01 | 138.25±14.65 | 138.81±14.56 | 140.71±14.47 | 0.295 |
| cTnI, ng/ml | 0.005 (0.002–0.009) | 0.004 (0.002–0.009) | 0.005 (0.002–0.009) | 0.006 (0.002–0.010) | 0.097 |
| Medications | |||||
| Statins, n (%) | 256 (99.2) | 242 (98.8) | 254 (98.1) | 228 (98.3) | 0.687 |
| Aspirin, n (%) | 256 (99.2) | 243 (99.2) | 259 (100.0) | 232 (100.0) | 0.270 |
| Clopidogrel, n (%) | 258 (100.0) | 245 (100.0) | 259 (100.0) | 232 (100.0) | - |
| β-Blockers, n (%) | 229 (88.8) | 218 (89.0) | 224 (86.5) | 209 (90.1) | 0.641 |
| Nitrates, n (%) | 244 (94.6) | 240 (98.0) | 249 (96.1) | 224 (96.6) | 0.252 |
| CCBs, n (%) | 138 (53.5) | 135 (55.1) | 133 (51.4) | 114 (49.1) | 0.585 |
| ACEIs, n (%) | 79 (30.6) | 78 (31.8) | 82 (31.7) | 75 (32.3) | 0.981 |
| ARBs, n (%) | 87 (33.7) | 81 (33.1) | 88 (34.0) | 85 (36.6) | 0.854 |
| Trimetazidine, n (%) | 60 (23.38) | 67 (27.3) | 76 (29.3) | 56 (24.1) | 0.368 |
Values are expressed as mean ± SD, median with interquartile range or n (%).
LDL-C = low-density lipoprotein cholesterol; MI = myocardial infarcton; PCI = percutaneous coronary intervention; CABG = coronary artery bypass graft; CAD = coronary artery disease; HDL-C = high-density lipoprotein cholesterol; hs-CRP = high-sensitivity C-reactive protein; NT-proBNP = N-terminal pro-brain natriuretic peptide; cTnI = cardiac troponin I; CCBs = calcium channel blockers; ACE = angiotensin-converting enzyme; ARBs = angiotensin receptor blockers.
Procedural characteristics according to quartiles of HbA1c were shown in Table 2. Patients with higher HbA1c levels were more likely to receive more postdilatation. There were no significant differences in vascular access, target vessel, target lesion site and target lesion type among quartiles of HbA1c. There were also no significant differences in number of stents, total stent length, predilation times, maximum inflation pressure and maximum inflation time among quartiles of HbA1c.
Table 2. Procedural characteristics.
| HbA1c at baseline | |||||
| Variable | Quartile 1 (n = 258) | Quartile 2 (n = 245) | Quartile 3 (n = 259) | Quartile 4 (n = 232) | P value |
| Transradial access, n (%) | 234 (90.7) | 220 (89.8) | 237 (91.5) | 216 (93.1) | 0.622 |
| Target vessel | 0.748 | ||||
| LM | 9 | 16 | 13 | 7 | |
| LAD | 138 | 141 | 153 | 128 | |
| LCX | 90 | 75 | 79 | 76 | |
| RCA | 98 | 103 | 99 | 98 | |
| Grafts | 0 | 2 | 1 | 1 | |
| Lesion location | 0.268 | ||||
| Proximal | 130 | 147 | 151 | 151 | |
| Middle | 195 | 175 | 201 | 173 | |
| Distal | 82 | 79 | 69 | 75 | |
| branch | 78 | 56 | 82 | 58 | |
| Lesion classification | 0.365 | ||||
| ACC/AHA type A/B1 | 84 | 73 | 66 | 69 | |
| ACC/AHA type B2/C | 290 | 288 | 315 | 266 | |
| Bifurcation lesions, n (%) | 108 (41.9) | 97 (39.6) | 117 (45.2) | 97 (41.8) | 0.648 |
| Use with kissing balloon, n (%) | 14 (5.4) | 22 (9.0) | 23 (8.9) | 20 (8.6) | 0.384 |
| Occlusion lesions, n (%) | 32 (12.4) | 36 (14.7) | 51 (19.7) | 28 (12.1) | 0.058 |
| In-stent restenosis, n (%) | 16 (6.2) | 11 (4.5) | 14 (5.4) | 10 (4.3) | 0.759 |
| Number of stents implanted | 1.88±1.01 | 2.05±1.05 | 2.04±1.07 | 2.03±1.03 | 0.178 |
| Total stent length, mm | 40.89±27.20 | 45.99±24.97 | 46.88±29.08 | 46.00±27.09 | 0.051 |
| Maximum pressure, atm | 17.60±3.69 | 18.26±3.89 | 17.76±3.46 | 17.95±3.66 | 0.215 |
| Maximum inflation time, s | 10.58±4.04 | 10.29±4.74 | 10.13±3.65 | 10.03±3.51 | 0.443 |
| Number of predilation | 2 (1–4) | 2 (1–5) | 3 (1–6) | 3 (2–5) | 0.054 |
| Number of postdilatation | 3 (2–6) | 4 (2–6) | 4 (2–6) | 4 (2–7) | 0.042 |
| Postprocedural medication | |||||
| LMWH, n (%) | 170 (65.9) | 167 (68.2) | 176 (68.0) | 159 (68.5) | 0.922 |
| GPI, n (%) | 44 (17.1) | 44 (18.0) | 31 (12.0) | 34 (14.7) | 0.239 |
Values are expressed as n (%), mean ± SD or median with interquartile range.
HbA1c = glycated hemoglobin; LM = left main; LAD = left anterior descending; LCX = left circumflex; RCA = right coronary artery; LMWH = low molecular weight heparin; GPI = glycoprotein inhibitors.
Association between HbA1c levels and postprocedural cTnI levels
There was a similar trend that lower preprocedural HbA1c and fasting glucose levels were associated with higher postprocedural cTnI levels in the simple regression analysis (Table 3). Simple regression analyses revealed that age, prior MI, NT-proBNP, creatinine, preprocedural cTnI, number of target vessels, number of B2/C type lesions, number of bifurcation lesions, number of predilation, number of postdilation, use of kissing balloon, maximum inflation pressure, number of stents and total stent length were positively associated with postprocedural cTnI levels, whereas high hemoglobin levels were associated with low postprocedural cTnI levels.
Table 3. Analysis of factors related to postprocedural cTnI levels (log-transformed).
| Simple Regression | Multiple Regression | |||
| Variable | Standard coefficient | P value | Standard coefficient | P value |
| Age | 0.125 | <0.001 | 0.117 | <0.001 |
| Male | -0.023 | 0.473 | ||
| Unstable angina | -0.058 | 0.065 | ||
| Prior MI | 0.095 | 0.003 | 0.076 | 0.012 |
| Prior PCI | -0.015 | 0.640 | ||
| Prior CABG | 0.008 | 0.791 | ||
| Hypertension | 0.030 | 0.346 | ||
| Current smoking | 0.011 | 0.739 | ||
| Family history of CAD | 0.021 | 0.517 | ||
| HbA1C | -0.053 | 0.097 | -0.071 | 0.018 |
| Glucose | -0.053 | 0.095 | ||
| LDL-C | 0.043 | 0.177 | ||
| HDL-C | 0.005 | 0.866 | ||
| Triglyceride | 0.007 | 0.833 | ||
| hs-CRP | -0.014 | 0.664 | ||
| NT-proBNP | 0.117 | <0.001 | 0.080 | 0.009 |
| Creatinine | 0.069 | 0.030 | ||
| Hemoglobin | -0.064 | 0.043 | ||
| Preprocedural cTnI | 0.124 | <0.001 | 0.086 | 0.005 |
| Number of target vessels | 0.220 | <0.001 | 0.131 | <0.001 |
| Number of B2/C type lesions | 0.201 | <0.001 | ||
| Number of bifurcation lesions | 0.132 | <0.001 | ||
| Number of occlusion lesions | 0.013 | 0.680 | ||
| Number of in-stent restenosis | -0.022 | 0.485 | ||
| Number of predilation | 0.182 | <0.001 | ||
| Number of postdilatation | 0.201 | <0.001 | 0.075 | 0.043 |
| Use of kissing balloon | 0.089 | 0.005 | ||
| Maximum inflation pressure | 0.075 | 0.018 | ||
| Maximum inflation time | 0.045 | 0.157 | ||
| Number of stents | 0.248 | <0.001 | ||
| Total stent length | 0.252 | <0.001 | 0.152 | <0.001 |
MI = myocardial infarcton; PCI = percutaneous coronary intervention; CABG = coronary artery bypass graft; CAD = coronary artery disease; LDL-C = low-density lipoprotein cholesterol; HDL-C = high-density lipoprotein cholesterol; hs-CRP = high-sensitivity C-reactive protein; NT-proBNP = N-terminal pro-brain natriuretic peptide; cTnI, cardiac troponin I.
Stepwise multivariable analysis revealed that factors independently associated with postprocedural cTnI levels were age, prior myocardial infarction, NT-proBNP, preprocedural cTnI, number of target vessels, number of postdilation and total stent length were positively associated with postprocedural cTnI levels, whereas HbA1c levels were inversely associated with postprocedural cTnI levels (Table 3).
Association between HbA1c levels and postprocedural cTnI elevation
Peak postprocedural cTnI >1×ULN, >3×ULN and >5×ULN were detected in 543 (54.6%), 337 (33.9%) and 245 (24.6%) respectively. Calculating HbA1c as a continuous variable, simple logistic regression showed that each increment of 1% in the HbA1c level was associated with less risk of postprocedural cTnI elevation above 1×ULN (Table 4). HbA1c was not significantly associated with postprocedural cTnI elevation above 3×ULN and 5×ULN. After adjusting for covariates, each increment of 1% in the HbA1c level was more strongly associated with less risk of postprocedural cTnI elevation above 1×ULN (Table 4, Figure 1). There was a trend that each increment of 1% in the HbA1c level was associated with less risk of postprocedural cTnI elevation above 3×ULN, but this did not reach a statistical significance (Table 4, Figure 2). HbA1c was not significantly associated with postprocedural cTnI elevation above 5×ULN (Table 4, Figure 3).
Table 4. Odds ratio for postprocedural cTnI elevation associated with 1% increment in the HbA1c.
| cTnI elevation >1×ULN | cTnI elevation >3×ULN | cTnI elevation >5×ULN | ||||
| Variable | OR (95%CI) | P | OR (95%CI) | P | OR (95%CI) | P |
| Unadjusted model | ||||||
| HbA1C | 0.90(0.81–0.99) | 0.034 | 0.92(0.83–1.03) | 0.151 | 0.96(0.85–1.09) | 0.547 |
| Adjusted model | ||||||
| HbA1C | 0.85(0.76–0.95) | 0.004 | 0.90(0.81–1.02) | 0.088 | 0.95(0.84–1.08) | 0.411 |
| Age | 1.02(1.01–1.04) | 0.011 | 1.03(1.01–1.04) | 0.001 | 1.03(1.01–1.05) | 0.001 |
| Prior MI | 1.32(0.96–1.82) | 0.088 | 1.17(0.85–1.62) | 0.344 | 1.41(1.01–1.99) | 0.049 |
| NT-proBNP | 1.00(1.00–1.01) | 0.192 | 1.00(1.00–1.01) | 0.162 | 1.00(1.00–1.01) | 0.075 |
| Preprocedural cTnI | 1.03(1.01–1.06) | 0.002 | 1.01(0.99–1.03) | 0.456 | 1.01(0.98–1.03) | 0.632 |
| Number of target vessels | 1.81(1.35–2.43) | <0.001 | 1.53(1.17–2.01) | 0.002 | 1.25(0.94–1.67) | 0.128 |
| Number of postdilatation | 1.07(1.02–1.12) | 0.008 | 1.02(0.98–1.06) | 0.383 | 1.03(0.99–1.07) | 0.180 |
| Total stent length | 1.01(1.00–1.02) | 0.005 | 1.01(1.00–1.02) | 0.001 | 1.01(1.00–1.02) | 0.004 |
HbA1c = glycated hemoglobin; cTnI = cardiac troponin I; OR = odds ratio; ULN = upper limit of normal; MI = myocardial infarcton; NT-proBNP = N-terminal pro-brain natriuretic peptide.
Figure 1. Odds ratio for postprocedural cTnI elevation above 1×ULN.
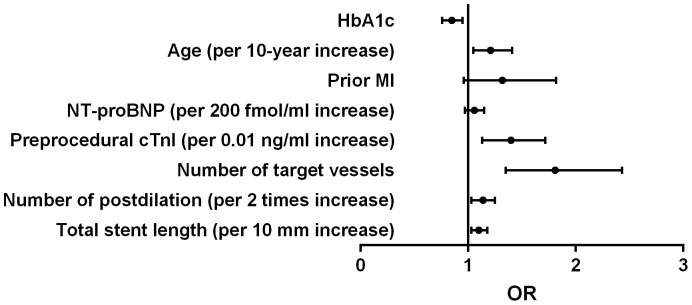
HbA1c = glycated hemoglobin; cTnI = cardiac troponin I; OR = odds ratio; ULN = upper limit of normal; MI = myocardial infarcton; NT-proBNP = N-terminal pro-brain natriuretic peptide.
Figure 2. Odds ratio for postprocedural cTnI elevation above 3×ULN.
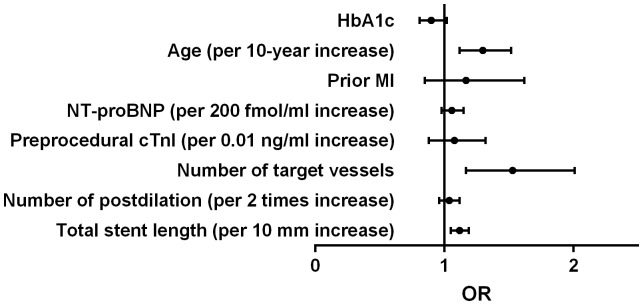
HbA1c = glycated hemoglobin; cTnI = cardiac troponin I; OR = odds ratio; ULN = upper limit of normal; MI = myocardial infarcton; NT-proBNP = N-terminal pro-brain natriuretic peptide.
Figure 3. Odds ratio for postprocedural cTnI elevation above 5×ULN.

HbA1c = glycated hemoglobin; cTnI = cardiac troponin I; OR = odds ratio; ULN = upper limit of normal; MI = myocardial infarcton; NT-proBNP = N-terminal pro-brain natriuretic peptide.
Association between HbA1c quartiles and postprocedural cTnI levels
The interquartile ranges of postprocedural cTnI levels for each quartile of HbA1c were 0.052 (0.018–0.203), 0.063 (0.021–0.184), 0.049 (0.015–0.217) and 0.041 (0.012–0.198) respectively. There is a linear trend that higher quartiles of HbA1c were associated with lower postprocedural cTnI levels. After multivariate adjustment for other factors which were independently associated with postprocedural cTnI levels, higher quartiles of HbA1c were significantly associated with lower postprocedural cTnI levels (Table 5). And higher quartiles of HbA1c were associated with less risk of postprocedural cTnI elevation above 1×ULN. There was a trend that higher quartiles of HbA1c were associated with less risk of postprocedural cTnI elevation above 3×ULN, but this did not reach a statistical significance. The quartiles of HbA1c were not associated with the risk of postprocedural cTnI elevation above 5×ULN (Table 6).
Table 5. Distribution of post-PCI cardiac troponin I.
| HbA1c at baseline | ||||||
| Variable | Quartile 1 (n = 258) | Quartile 2 (n = 245) | Quartile 3 (n = 259) | Quartile 4 (n = 232) | β | P for trend |
| Post-PCI cTnI, ng/ml | 0.052(0.018–0.203) | 0.063(0.021–0.184) | 0.049(0.015–0.217) | 0.041 (0.012–0.198) | −0.073 | 0.014 |
| Post-PCI cTnI elevation | ||||||
| >1×ULN, n (%) | 147 (57.0) | 140 (57.1) | 139 (53.7) | 117 (50.4) | −0.145 | 0.018 |
| >3×ULN, n (%) | 91 (35.3) | 87 (35.5) | 86 (33.2) | 73 (31.5) | −0.088 | 0.166 |
| >5×ULN, n (%) | 66 (25.6) | 56 (22.9) | 65 (25.1) | 58 (25.0) | −0.019 | 0.785 |
Values were expressed as median with interquartile ranges or n (%). The analyses were adjusted for age, prior myocardial infarction, NT-proBNP, preprocedural cTnI, number of target vessels and total stent length.
Table 6. Unadjusted and adjusted OR for periprocedural myocardial injury according to quartiles of HbA1c.
| cTnI elevation >1×ULN | cTnI elevation >3×ULN | cTnI elevation >5×ULN | ||||
| Variable | OR (95%CI) | P | OR (95%CI) | P | OR (95%CI) | P |
| Unadjusted model | ||||||
| Quartile 1 (reference) | ||||||
| Quartile 2 | 1.01(0.71–1.43) | 0.970 | 1.01(0.70–1.46) | 0.955 | 0.86(0.57–1.30) | 0.476 |
| Quartile 3 | 0.88(0.62–1.24) | 0.449 | 0.91(0.63–1.31) | 0.621 | 0.98(0.66–1.45) | 0.899 |
| Quartile 4 | 0.77(0.54–1.10) | 0.147 | 0.84(0.58–1.23) | 0.373 | 0.97(0.65–1.46) | 0.883 |
| Adjusted model | ||||||
| Quartile 1 (reference) | ||||||
| Quartile 2 | 0.86(0.59–1.25) | 0.437 | 0.88(0.60–1.28) | 0.490 | 0.74(0.49–1.13) | 0.167 |
| Quartile 3 | 0.74(0.52–1.08) | 0.116 | 0.82(0.56–1.19) | 0.293 | 0.88(0.59–1.33) | 0.549 |
| Quartile 4 | 0.65(0.44–0.95) | 0.025 | 0.77(0.52–1.14) | 0.184 | 0.90(0.59–1.37) | 0.610 |
| Age | 1.02(1.01–1.04) | 0.009 | 1.03(1.01–1.04) | 0.001 | 1.03(1.01–1.05) | <0.001 |
| Prior MI | 1.31(0.95–1.80) | 0.099 | 1.16(0.84–1.61) | 0.362 | 1.42(1.01–2.00) | 0.047 |
| NT-proBNP | 1.00(1.00–1.01) | 0.201 | 1.00(1.00–1.01) | 0.170 | 1.00(1.00–1.01) | 0.082 |
| Preprocedural cTnI | 1.03(1.01–1.06) | 0.002 | 1.01(0.99–1.03) | 0.471 | 1.01(0.98–1.03) | 0.682 |
| Number of target vessels | 1.79(1.34–2.41) | <0.001 | 1.53(1.17–2.00) | 0.002 | 1.26(0.95–1.68) | 0.114 |
| Number of postdilatation | 1.06(1.02–1.12) | 0.009 | 1.02(0.98–1.06) | 0.381 | 1.03(0.99–1.07) | 0.183 |
| Total stent length | 1.01(1.00–1.02) | 0.004 | 1.01(1.00–1.02) | 0.001 | 1.01(1.00–1.02) | 0.004 |
HbA1c = glycated hemoglobin; cTnI = cardiac troponin I; OR = odds ratio; ULN = upper limit of normal; MI = myocardial infarcton; NT-proBNP = N-terminal pro-brain natriuretic peptide.
Discussion
The present study provided the first line of evidence that higher preprocedural HbA1c levels were associated with less risk of myocardial injury following elective PCI in diabetic patients. Thus, our study provided the novel finding regarding the relationship between preprocedural HbA1c and periprocedural myocardial injury.
PCI has become an important strategy for patients with CAD. Patients with type 2 diabetes mellitus (DM) have a higher prevalence of CAD than the general population. Because of poor outcome, PCI in diabetic patients have been recognized as a complex procedure. With advances in PCI techniques and medications, especially with introduction of drug-eluting stents, more and more diabetic patients receive PCI. However, PCI was still frequently companied with postprocedural cardiac marker elevation. There was a large body of data correlating troponin elevation after elective PCI with adverse clinical outcomes [12]–[15]. Third universal definition of myocardial infarction has raised the diagnostic threshold of PCI-related myocardial infarction from the elevation of troponin above 3 times ULN to the elevation of troponin above 5 times ULN, and suggested that this threshold was arbitrarily chosen, based on clinical judgement and societal implications of the label of PCI-related myocardial infarction. Myocardial injury is used for postprocedural cTn value is >1×ULN and ≤5×ULN [16]. So, we used many different cTnI cut points. Although a number of studies have investigated the risk factors associated with periprocedural myocardial infarction or injury [9], [17], [18], less of them focused on diabetic patients or the impact of glycemic control on periprocedural myocardial infarction or injury in diabetic patients. And elevated HbA1c or poor glycemic control is associated with increased risk of cardiovascular events in diabetic patients [4]–[6], but whether elevated HbA1c is still associated with increased risk of myocardial infarction or injury following elective PCI in diabetic patients is still unknown.
In the present study, we included 994 diabetic patients undergoing elective PCI to determine the relation of preprocedural HbA1c levels with postprocedural cTnI elevation. Univariate analysis showed that some clinical and procedural characteristics were associated with postprocedural cTnI levels. There were almost identical pattern between the inverse associations of HbA1c and fasting glucose with postprocedural cTnI levels. However, after multivariate stepwise analysis, HbA1c was still in the model, but fasting glucose was not. HbA1c reflects both fasting and postprandial blood glucose levels over the previous 2–3 months, has less fluctuation individually than fasting blood glucose level, and can be measured in the nonfasting state. These characteristics may result that HbA1c outperform fasting glucose in prediction of periprocedural myocardial injury. Patients in the highest quartile of HbA1c were likely to receive more predilation and postdilation, and longer total stent length implanted. This maybe reflect high atherosclerotic burden in these patients with high HbA1c levels [19]. However, these patients experienced reduced risk of periprocedural myocardial injury. Regardless of calculating as quartiles or continuous variables, higher HbA1c levels were associated with less risk periprocedural myocardial injury. A U-shaped or J-shape association between HbA1c and periprocedural myocardial injury did not appear. Interestingly, there was also an inverse relationship between HbA1c levels and mortality in diabetic patients with advanced systolic heart failure [20].
The exact reasons for the relationship of lower HbA1c levels with periprocedural myocardial injury were unclear. There were some plausible explanations for this relationship. The energy supply of ischemic myocardium mainly dependents on anaerobic pathways and carbohydrate substrates [21]. Patients with lower HbA1c may have less energy supply for ischemic myocardium during or after procedure. The present study showed that HbA1c was highly correlated with fasting glucose. Libby and colleagues have showed that hypoglycemia increased myocardial damage during acute experimental coronary artery occlusion in dogs [22]. The study by Nusca et al showed that preprocedural glucose levels were inversely associated with periprocedural myocardial infarction in 572 patients of which 198 was diabetic [23]. The study by Madani et al showed that low preprocedural glucose levels were associated with increased incidence of periprocedural myocardial injury in 1012 patients undergoing elective PCI of which 260 was diabetic [24]. Unlike these studies, we examined the relation of fasting glucose and HbA1c with periprocedural myocardial injury in diabetic patients undergoing elective PCI, and found the superiority of HbA1c over fasting glucose for prediction of periprocedural myocardial injury. This was consistent with the study by Nicholls which showed a stronger correlation between plaque characteristics and glycated hemoglobin than fasting glucose [25]. Although high levels of HbA1c were associated with large plaque volume [19], higher HbA1c levels were still associated with less risk of periprocedural myocardial injury in our study. The positive association between HbA1c and glucose might partly explain the inverse relationship between HbA1c and periprocedural myocardial injury. The energy supply of ischemic myocardium mainly dependents on anaerobic pathways with carbohydrate substrates. Patients with hypoglycemia may be under greater energy stress and have less energy supply.
There were also some other reasons accounted for the inverse relationship between HbA1c and periprocedural myocardial injury in diabetic patients. Diabetic patients with high levels of HbA1c have increased coronary plaque calcification despite of large plaque volume [19], [26]. Calcified and hard plaques were difficult to be dilated and less likely to be crushed to debris during balloon dilation. The negative or unexpected results of several clinical trials which were designed to determine the effect of achieving a low HbA1c level on cardiovascular events, could also partly explain our results. Because of increased mortality in participants randomized to intensive glucose control to achieve an HbA1c level below 6%, Action to Control Cardiovascular Risk in Diabetes (ACCORD) was terminated early [27]. Both Action in Diabetes and Vascular Disease–Preterax and Diamicron Modified Release Controlled Evaluation (ADVANCE) and the Veterans Affairs Diabetes Trial (VADT) showed no significant reduction in cardiovascular events with intensive glucose control by which a mean HbA1c level of 6.3% and 6.9% were achieved respectively [28], [29]. To date, the optimal HbA1C target in diabetic patients with coronary artery disease is still a subject of ongoing controversy.
Despite the detailed data collection in this study, we acknowledged several potential limitations of our study. First, although we attempted to adjust for potential confounders, we can not exclude the possibility that unmeasured variables may have confounded results. Second, it has been suggested that CK-MB might have a better predictive value than troponins [30], but we did not measure the CK-MB levels after procedure due to insurance cost. However, troponins are more sensitive and specific biomarkers for myocardium than CK-MB activity and CK-MB mass, and the third universal definition of myocardial infarction has recommended troponin using for diagnosis of PCI-related myocardial infarction and injury. And there was also a large body of data demonstrated that postprocedural troponin elevation was associated with a worse clinical outcome [12]–[15]. Third, we conjectured that hypoglycemia might be one cause of periprocedural myocardial injury for patients with low HbA1c, but hypoglycemic episodes were not monitored in the current study. Fourth, the lack of a control (non-diabetic) group was also a limitation. Finally, a single center study may also be a limitation in our study. However, the present study has revealed a previously unrecognized relationship between HbA1c level and myocardial injury following elective PCI in diabetic patients.
Conclusions
In summary, our prospective study in a large cohort of consecutive diabetic patient with CAD, for the first time, demonstrated that higher preprocedural HbA1c concentrations were linked with less risk of myocardial injury following elective PCI in patients with diabetes mellitus. Further prospective studies are needed to identify whether less stringent HbA1c goals before procedure is appropriate for diabetic patients undergoing elective PCI.
Acknowledgments
The authors thank the staff of the Cardiac Catheterization Laboratory at Fuwai hospital for their assistance in performing the studies. The authors also thank all the study investigators, staff, and patients.
Funding Statement
This study is partly supported by National Natural Scientific Foundation (81070171, 81241121), Specialized Research Fund for the Doctoral Program of Higher Education of China (20111106110013), Capital Special Foundation of Clinical Application Research (Z121107001012015), Capital Health Development Fund (2011400302), and Beijing Natural Science Foundation (7131014) awarded to Dr. Jian-Jun Li, MD, PhD. The funders had no role in study design, data collection and analysis, decision to publish, or preparation of the manuscript.
References
- 1. American Diabetes A (2009) Standards of medical care in diabetes—2009. Diabetes Care 32 Suppl 1: S13–61. [DOI] [PMC free article] [PubMed] [Google Scholar]
- 2. Nathan DM, Kuenen J, Borg R, Zheng H, Schoenfeld D, et al. (2008) Translating the A1C assay into estimated average glucose values. Diabetes Care 31: 1473–1478. [DOI] [PMC free article] [PubMed] [Google Scholar]
- 3. Selvin E, Marinopoulos S, Berkenblit G, Rami T, Brancati FL, et al. (2004) Meta-analysis: glycosylated hemoglobin and cardiovascular disease in diabetes mellitus. Ann Intern Med 141: 421–431. [DOI] [PubMed] [Google Scholar]
- 4. Colayco DC, Niu F, McCombs JS, Cheetham TC (2011) A1C and cardiovascular outcomes in type 2 diabetes: a nested case-control study. Diabetes Care 34: 77–83. [DOI] [PMC free article] [PubMed] [Google Scholar]
- 5. Stratton IM, Adler AI, Neil HA, Matthews DR, Manley SE, et al. (2000) Association of glycaemia with macrovascular and microvascular complications of type 2 diabetes (UKPDS 35): prospective observational study. BMJ 321: 405–412. [DOI] [PMC free article] [PubMed] [Google Scholar]
- 6. Zhao W, Katzmarzyk PT, Horswell R, Wang Y, Johnson J, et al. (2014) HbA1c and coronary heart disease risk among diabetic patients. Diabetes Care 37: 428–435. [DOI] [PMC free article] [PubMed] [Google Scholar]
- 7. Skyler JS, Bergenstal R, Bonow RO, Buse J, Deedwania P, et al. (2009) Intensive glycemic control and the prevention of cardiovascular events: implications of the ACCORD, ADVANCE, and VA diabetes trials: a position statement of the American Diabetes Association and a scientific statement of the American College of Cardiology Foundation and the American Heart Association. Circulation 119: 351–357. [DOI] [PubMed] [Google Scholar]
- 8. Prasad A (2013) Slow but steady progress towards understanding peri-procedural myocardial infarction. Eur Heart J 34: 1615–1617. [DOI] [PubMed] [Google Scholar]
- 9. Herrmann J (2005) Peri-procedural myocardial injury: 2005 update. Eur Heart J 26: 2493–2519. [DOI] [PubMed] [Google Scholar]
- 10. Thygesen K, Alpert JS, White HD, Joint ESCAAHAWHFTFftRoMI (2007) Universal definition of myocardial infarction. Eur Heart J 28: 2525–2538. [DOI] [PubMed] [Google Scholar]
- 11. Thygesen K, Alpert JS, Jaffe AS, Simoons ML, Chaitman BR, et al. (2012) Third universal definition of myocardial infarction. J Am Coll Cardiol 60: 1581–1598. [DOI] [PubMed] [Google Scholar]
- 12. Feldman DN, Kim L, Rene AG, Minutello RM, Bergman G, et al. (2011) Prognostic value of cardiac troponin-I or troponin-T elevation following nonemergent percutaneous coronary intervention: a meta-analysis. Catheter Cardiovasc Interv 77: 1020–1030. [DOI] [PubMed] [Google Scholar]
- 13. Nienhuis MB, Ottervanger JP, Bilo HJ, Dikkeschei BD, Zijlstra F (2008) Prognostic value of troponin after elective percutaneous coronary intervention: A meta-analysis. Catheter Cardiovasc Interv 71: 318–324. [DOI] [PubMed] [Google Scholar]
- 14. Prasad A, Singh M, Lerman A, Lennon RJ, Holmes DR Jr, et al. (2006) Isolated elevation in troponin T after percutaneous coronary intervention is associated with higher long-term mortality. J Am Coll Cardiol 48: 1765–1770. [DOI] [PubMed] [Google Scholar]
- 15. Prasad A, Rihal CS, Lennon RJ, Singh M, Jaffe AS, et al. (2008) Significance of periprocedural myonecrosis on outcomes after percutaneous coronary intervention: an analysis of preintervention and postintervention troponin T levels in 5487 patients. Circ Cardiovasc Interv 1: 10–19. [DOI] [PubMed] [Google Scholar]
- 16. Thygesen K, Alpert JS, Jaffe AS, Simoons ML, Chaitman BR, et al. (2012) Third universal definition of myocardial infarction. Circulation 126: 2020–2035. [DOI] [PubMed] [Google Scholar]
- 17. Cai Q, Skelding KA, Armstrong AT Jr, Desai D, Wood GC, et al. (2007) Predictors of periprocedural creatine kinase-myocardial band elevation complicating elective percutaneous coronary intervention. Am J Cardiol 99: 616–620. [DOI] [PubMed] [Google Scholar]
- 18. Park DW, Kim YH, Yun SC, Ahn JM, Lee JY, et al. (2013) Frequency, causes, predictors, and clinical significance of peri-procedural myocardial infarction following percutaneous coronary intervention. Eur Heart J 34: 1662–1669. [DOI] [PubMed] [Google Scholar]
- 19. Yang DJ, Lee MS, Kim WH, Park HW, Kim KH, et al. (2013) The impact of glucose control on coronary plaque composition in patients with diabetes mellitus. J Invasive Cardiol 25: 137–141. [PubMed] [Google Scholar]
- 20. Eshaghian S, Horwich TB, Fonarow GC (2006) An unexpected inverse relationship between HbA1c levels and mortality in patients with diabetes and advanced systolic heart failure. Am Heart J 151: 91. [DOI] [PubMed] [Google Scholar]
- 21. Neely JR, Morgan HE (1974) Relationship between carbohydrate and lipid metabolism and the energy balance of heart muscle. Annu Rev Physiol 36: 413–459. [DOI] [PubMed] [Google Scholar]
- 22. Libby P, Maroko PR, Braunwald E (1975) The effect of hypoglycemia on myocardial ischemic injury during acute experimental coronary artery occlusion. Circulation 51: 621–626. [DOI] [PubMed] [Google Scholar]
- 23. Nusca A, Patti G, Marino F, Mangiacapra F, D'Ambrosio A, et al. (2012) Prognostic role of preprocedural glucose levels on short- and long-term outcome in patients undergoing percutaneous coronary revascularization. Catheter Cardiovasc Interv 80: 377–384. [DOI] [PubMed] [Google Scholar]
- 24. Madani M, Alizadeh K, Ghazaee SP, Zavarehee A, Abdi S, et al. (2013) Elective percutaneous coronary intervention: the relationship between preprocedural blood glucose levels and periprocedural myocardial injury. Tex Heart Inst J 40: 410–417. [PMC free article] [PubMed] [Google Scholar]
- 25. Nicholls SJ, Tuzcu EM, Kalidindi S, Wolski K, Moon KW, et al. (2008) Effect of diabetes on progression of coronary atherosclerosis and arterial remodeling: a pooled analysis of 5 intravascular ultrasound trials. J Am Coll Cardiol 52: 255–262. [DOI] [PubMed] [Google Scholar]
- 26. Anand DV, Lim E, Darko D, Bassett P, Hopkins D, et al. (2007) Determinants of progression of coronary artery calcification in type 2 diabetes role of glycemic control and inflammatory/vascular calcification markers. J Am Coll Cardiol 50: 2218–2225. [DOI] [PubMed] [Google Scholar]
- 27. Action to Control Cardiovascular Risk in Diabetes Study G, Gerstein HC, Miller ME, Byington RP, Goff DC Jr, et al. (2008) Effects of intensive glucose lowering in type 2 diabetes. N Engl J Med 358: 2545–2559. [DOI] [PMC free article] [PubMed] [Google Scholar]
- 28. Group AC, Patel A, MacMahon S, Chalmers J, Neal B, et al. (2008) Intensive blood glucose control and vascular outcomes in patients with type 2 diabetes. N Engl J Med 358: 2560–2572. [DOI] [PubMed] [Google Scholar]
- 29. Duckworth W, Abraira C, Moritz T, Reda D, Emanuele N, et al. (2009) Glucose control and vascular complications in veterans with type 2 diabetes. N Engl J Med 360: 129–139. [DOI] [PubMed] [Google Scholar]
- 30. Moussa ID, Klein LW, Shah B, Mehran R, Mack MJ, et al. (2013) Consideration of a new definition of clinically relevant myocardial infarction after coronary revascularization: an expert consensus document from the Society for Cardiovascular Angiography and Interventions (SCAI). J Am Coll Cardiol 62: 1563–1570. [DOI] [PMC free article] [PubMed] [Google Scholar]