Abstract
In this paper we present a novel approach for the intrinsic mapping of anatomical surfaces and its application in brain mapping research. Using the Laplace-Beltrami eigen-system, we represent each surface with an isometry invariant embedding in a high dimensional space. The key idea in our system is that we realize surface deformation in the embedding space via the iterative optimization of a conformal metric without explicitly perturbing the surface or its embedding. By minimizing a distance measure in the embedding space with metric optimization, our method generates a conformal map directly between surfaces with highly uniform metric distortion and the ability of aligning salient geometric features. Besides pairwise surface maps, we also extend the metric optimization approach for group-wise atlas construction and multi-atlas cortical label fusion. In experimental results, we demonstrate the robustness and generality of our method by applying it to map both cortical and hippocampal surfaces in population studies. For cortical labeling, our method achieves excellent performance in a cross-validation experiment with 40 manually labeled surfaces, and successfully models localized brain development in a pediatric study of 80 subjects. For hippocampal mapping, our method produces much more significant results than two popular tools on a multiple sclerosis study of 109 subjects.
Index Terms: Laplace-Beltrami embedding, metric optimization, surface mapping, cortex, hippocampus
I. Introduction
The automated mapping and analysis of the surface representation of neuroanatomy is critical in brain mapping research [1]–[5]. By accurately aligning corresponding anatomical regions, surface mapping techniques allow the localization of subtle perturbations to brain morphometry in population studies. While many promising techniques were developed, there is still a lack of general, yet feature sensitive, methods that can be applied to various anatomical structures. By representing surfaces with their feature-aware Laplace-Beltrami (LB) eigen-functions, we propose in this work a novel approach for intrinsic surface mapping in the LB embedding space via the optimization of the conformal metric on the surface. We demonstrate the robustness and generality of our method by applying it to map both the relatively smooth hippocampal surface and the convoluted cortical surface in population studies.
To compare different brain surfaces, previous methods typically rely on the mapping of surfaces to a canonical domain such as the unit sphere [2], [6]–[11]. After that, a customized warping process can be applied to obtain the final map [2], [3], [12], [13]. To map a surface to the canonical domain, conformal maps are among the most popular tools because they have the mathematical guarantee of being diffeomorphic and the angle-preserving property [7]–[9], [14], but large metric distortions in these maps could affect the computational efficiency and mapping quality of the downstream warping process. During the customized warping on the canonical domain, different choices were made in previous works according to the specific brain structure under study. For cortical surfaces, sulcal lines or curvature features were often used to guide the surface warping in the canonical domain [2], [3], [12]. For sub-cortical structures without obvious anatomical landmarks, many different strategies were developed that include the use of orientation in atlas spaces [4], the minimization of groupwise shape variability [13], and the incorporation of features derived from the Reeb graph of LB eigen-functions [15], [16].
The eigen-system of the LB operator recently becomes increasingly popular as a general and powerful tool for intrinsic surface analysis [16]–[28]. Because the LB eigen-system is isometry invariant, which is more general than typically desired pose invariance in shape analysis, they are naturally suited to shape analysis with intrinsic geometry. The LB eigenvalues and the nodal counts of eigen-functions were successfully applied to shape classification [17], [23], [28]. The LB eigen-functions as orthonormal basis on surfaces have been valuable for signal denoising [18], the construction of multi-scale shape representation [29], and the detection of spurious outliers in mesh reconstruction [25]. As intrinsic feature functions, the LB eigen-functions have also been used to construct intrinsic Reeb graphs for the analysis of geometric and topological properties of MR images [22], [26]. One of the most valuable properties of the LB eigen-functions is their effectiveness in intrinsically describing the global geometric feature of anatomical shapes. This capability was successfully demonstrated in the development of novel descriptors of cortical surfaces and hippocampal surfaces [16], [29]. By viewing these feature-aware LB eigen-functions as intrinsically defined coordinates, an embedding of the surface into an infinity dimensional space was proposed, which naturally has the property of being isometry invariant and provides a general framework for intrinsic shape analysis [19]. As a first application, a histogram feature was developed in [19] from the embedding for shape classification. In this embedding space, a novel distance measure was proposed that allows the rigorous comparison of similarity between surfaces in terms of their intrinsic geometry [24]. Eigen-functions from the Laplacian operator on weighted graphs were also proposed for the mapping of cortical surfaces [27]. The main innovation of this method is to build a single graph that connects the vertices on two different surfaces and use the Laplacian embedding of this graph to establish detailed maps. State-of-the-art cortical labeling results comparable with FreeSurfer [30] were reported with significantly improved computational efficiency.
By warping the LB embedding of surfaces and minimizing their distance in the embedding space, we develop in this work a novel approach for surface mapping that can be applied to general anatomical structures. Unlike surface deformation in the Euclidean space that directly modifies surface geometry, our method iteratively changes the conformal metric on the surface to realize its deformation in the high dimensional embedding space. This is also different from previous works that directly warp the high dimensional embeddings with affine or nonlinear transformations to minimize the distance between surfaces [31]–[33]. Our method ensures that the embedding is a valid manifold during the deformation process and the final maps between surfaces satisfy the condition of conformal maps. Related to our work is the Ricci flow method that also warps the metric on a surface to map it to canonical spaces such as the unit sphere [34]. Guided by the feature-aware LB embedding, our method computes the conformal maps directly between anatomical surfaces that have much more uniform metric distortion than spherical conformal maps. Compared with the method in [27], where the focus is on improving the diffeomorphic correspondences of cortical maps, our method takes a mathematically different approach that produces a novel way of computing conformal maps with much improved metric preserving property.We also demonstrate the generality of our method with applications of mapping both cortical and sub-cortical brain structures. Besides applying it to compute pairwise surface maps, we also extend our method to build a group-wise atlas in the embedding space, which can be useful in population studies. To demonstrate the application of our method in brain mapping research, we developed an automated cortical labeling method by fusing the labels derived from the maps to a set of labeled atlases that were computed in the LB embedding space. Results from two population studies will be presented to illustrate the effectiveness of our mapping method in modeling brain development and detecting hippocampal changes in patients with multiple sclerosis (MS) and depression.
A preliminary version of this work was presented in a conference paper [35]. Here we present more complete descriptions of the algorithm, extensive comparisons with previous surface mapping methods, and demonstrate the generality of our method with the mapping of both cortical and sub-cortical structures. More extended explanations about the mathematical and algorithmic details of the proposed method have also been added. Applications to two brain mapping studies will also be presented: cortical thickness changes in pediatric development and hippocampal atrophy in multiple sclerosis patients with depression. The rest of the paper is organized as follows. In section II, we develop the general framework of surface mapping in the LB embedding space with metric optimization. The numerical algorithm to compute the optimized metric is developed in section III. After that, the extension of the metric optimization algorithm to compute group-wise atlas in the embedding space and its application for cortical label fusion will be described in section IV. Experimental results will be presented in section V to demonstrate the application of our method in mapping brain surfaces with varying complexity. Finally, conclusions are made in section VI.
II. Surface Mapping via Metric Optimization
Instead of processing surfaces in the Euclidean space where they are defined, we develop in this section a novel surface mapping technique in the high dimensional LB embedding space. The key idea in our method is that deformation in the embedding space is realized by modifying the metric on the surface. By minimizing a distance measure in the embedding space, we can obtain optimized surface maps for general anatomical structures.
Let (ℳ, g) be a genus-zero Riemannian surface where the metric g is the standard metric induced from ℝ3. For a function f : ℳ → ℝ, the LB operator on ℳ with the metric g is defined as:
| (1) |
where (gij) is the inverse matrix of g = (gij) and G = det(gij). Because the spectrum of is discrete, its eigen-system is defined as
| (2) |
where λn and fn are the n-th eigenvalue and eigen-function, respectively. The set of eigen-functions Φ = {f0, f1, f2,⋯,} form an orthonormal basis on the surface. Using the LB eigen-system, an embedding was proposed in [36]:
| (3) |
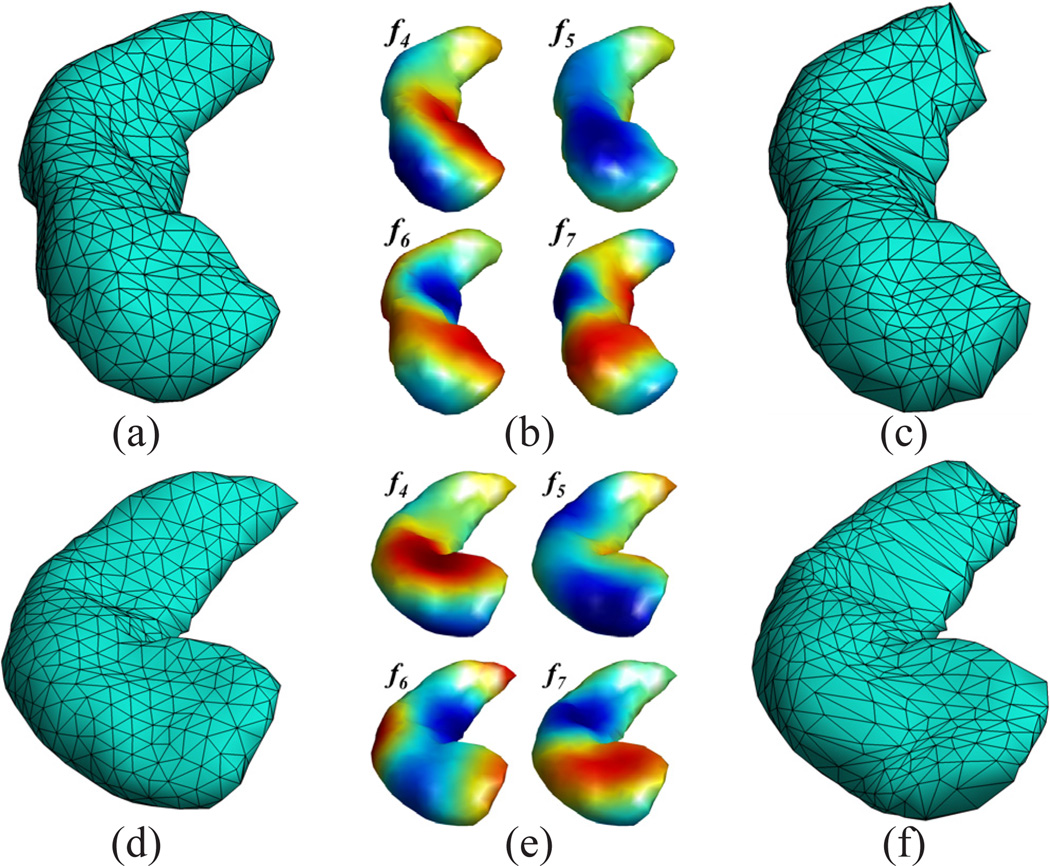
For the mapping of anatomical surfaces, the most critical property of this embedding is that it is isometry invariant. By finding the proper embedding after factoring out sign ambiguities of the eigen-functions, we can capture the intrinsic characteristics of the surface geometry. This robustness has been demonstrated to be valuable in the identifications of landmark features on anatomical structures such as the vervet and human brain cortical surfaces [24], [29]. From the point of view of creating detailed, and high quality surface maps, however, there are still important differences across surfaces that need to be addressed even after this isometry invariant embedding. For example, we show in Fig. 1 the eigen-functions of two hippocampal surfaces where the second surface has a stronger bending. This non-isometric difference results in major differences in the eigen-functions as shown in Fig. 1(b) and (e). Using the nearest point maps in the embedding space, we can project the originally regular mesh of each surface onto the other surface as plotted in Fig. 1(c) and (f). From the large metric distortions in the projected meshes, we can easily see that the maps are unsatisfactory.
Figure 1.
Impact of non-isometric shape differences of two surfaces ℳ1 (a) and ℳ2 (d). The 4,5,6,7-th eigen-functions on ℳ1 and ℳ2 are plotted in (b) and (e), respectively. The projection of ℳ2 onto ℳ1, and ℳ1 onto ℳ2 using the nearest point map in the embedding space are plotted in (c) and (f), respectively.
For surface mapping with LB embedding, the challenge is thus to overcome the non-isometric differences of surfaces and increase their similarity in the embedding space. To achieve this goal, we propose in this work to compute an optimized metric on the surface because its LB eigen-system is completely determined by the metric on the surface. Let ĝ = wg denote a new metric on the surface ℳ, where w : ℳ → ℝ+ is a positive function on ℳ. For the regular metric, we have w = 1. By iteratively perturbing the new metric w on the surface, we can deform the LB embedding of ℳ to remove its non-isometric differences to other surfaces.
To optimize the metric and minimize differences between surfaces in the LB embedding space, we need a distance measure in the embedding space. Given two surfaces and their LB embeddings, a rigorous distance measure called the spectral l2-distance was proposed in [24].
Definition 1 (spectral l2-distance)
Let (ℳ1, g1) and (ℳ2, g2) be two surfaces. For any given LB orthonormal basis Φ1 of ℳ1 and Φ2 of ℳ2, let
| (4) |
The spectral l2-distance d(ℳ1, ℳ2) between ℳ1 and ℳ2 independent of the choice of eigen-systems is defined as:
where ℬ(ℳ1) and ℬ(ℳ2) denote the set of all possible LB basis on ℳ1 and ℳ2, and dℳ1(x), dℳ2 (y) are normalized area elements, i.e., ∫ℳ1 dℳ1 (x) = 1 and ∫ℳ2 dℳ2 (y) = 1.
Because the definition of the spectral l2-distance includes the max and inf operations, it is non-differentiable with respect to the weight w. To find the optimal weight w that minimizes the spectral l2-distance of two surfaces (ℳ1, wg1) and (ℳ2, g2), we instead minimize a more tractable energy function defined as follows:
| (5) |
where w is metric on ℳ1, Φ1 and Φ2 are the basis used for the LB embedding of (ℳ1, wg1) and (ℳ2, g2). When the energy equals zero, we can see that both energy terms have to be zero, thus the minimizer of the energy also minimizes the spectral l2-distance. For simplicity, we focus here on the development of the metric optimization algorithm and only introduce the unknown metric on one surface. The same numerical algorithm, however, can be easily extended to optimize the metrics on both surfaces. This could have potential applications in symmetric surface registration and atlas construction. More details about this possibility will be discussed in section VI.
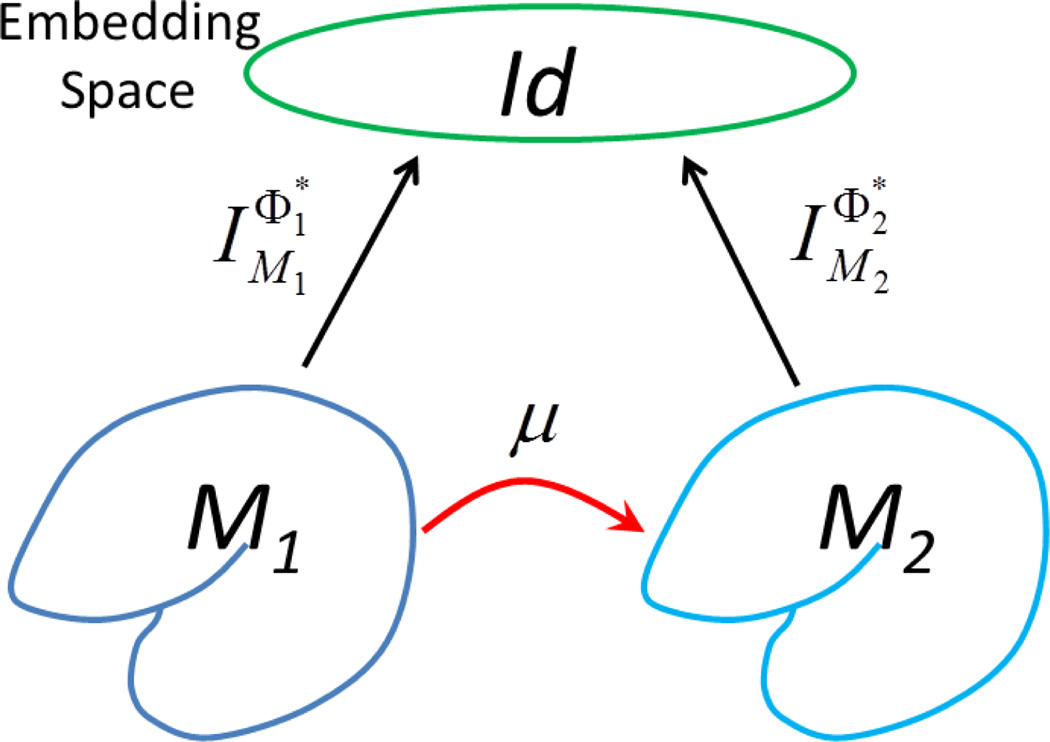
For two genus-zero surfaces, the existence of the minimizer is guaranteed because all such surfaces are conformally equivalent and the LB embedding is completely determined by their metric. Let (w, denote the solution that minimizes the energy. Given the optimized metric w and assuming no multiplicity in the eigenvalues [37], the optimal basis and of (ℳ1, wg1) and (ℳ2, g2) are selected from all possible sign combinations that minimize the energy. Note that multiplicity could occur for symmetric shapes such as the sphere, so our assumption of no multiplicity is for anatomical shapes with no obvious global symmetry. The two manifolds (ℳ1, wg1) and (ℳ2, g2) are isometric when the metric w is chosen so that the spectral l2-distance is zero [24]. Because the LB eigen-system is isometry invariant, the identity maps between the embeddings give the isometric maps between the surfaces when the spectral l2-distance is zero. Since isometry is a subset of conformal maps and the weighting w introduced in the metric is conformal, we have a conformal map from (ℳ1, g1) to (ℳ2, g2) when we combine these maps as illustrated in Fig. 2. Let Id denote the identity map from to , the conformal map μ :ℳ1 → ℳ2 from ℳ1 to ℳ2 is thus
| (6) |
where is the inverse map of the embedding .
Figure 2.
An illustration of the composition of three maps to form the direct conformal map between two surfaces.
One important point to note is that the metric optimization approach is not limited to pair-wise surface maps. The energy in (5) can be generalized to incorporate multiple surfaces and used for the computation of group-wise atlases in the embedding space, which we will discuss in section IV-A. Next we develop numerical techniques to minimize the energy that are also general and can be applied to group-wise applications.
III. Numerical Optimization
In this section, we develop the numerical algorithm for metric optimization and the computation of surface maps in the LB embedding space. As a first step, we describe the numerical scheme to compute the LB eigen-system given the weighted metric. After that, an energy minimization scheme will be developed to find the optimal metric.
Let (ℳ, wg) denote a manifold ℳ with the weighted metric ĝ = wg. The LB operator with the new metric is then and its eigen-system is:
| (7) |
For numerical computation, we use the linear finite element method [38] and represent the surface as a triangular mesh ℳ = (𝒱, 𝒯) with K vertices, where 𝒱 and 𝒯 are the set of vertices and triangles. At each vertex υi, we denote its barycentric coordinate function as ϕi, and represent the weight function as , and , where wj and βk are the coefficients of the basis functions. By choosing ϕi as the test function, the weak form of (7) is:
| (8) |
Using this weak form, we can solve a generalized matrix eigen problem to find the eigen-system under the weighted metric:
| (9) |
where the entry of the matrix Q and U on the i-th row and k-th column are defined as:
| (10) |
where is the angle in the triangle 𝒯l opposite to the edge (υi, υk), |·| denotes the area of a triangle, 𝒩(·) and 𝒩(·, ·) denote the neighborhood of vertices, and 𝒯i,j,k denotes the triangle formed by three vertices: υi, υj, υk. Because Uik = ∑j wj ∫ℳ ϕiϕjϕkdℳ, the coefficients in (10) are derived from the integral ∫ℳ ϕiϕjϕkdℳ of the barycentric coordinate functions.
To minimize the energy in (5) with respect to the metric w, we represent the two surfaces as triangular meshes ℳm = (𝒱m, 𝒯m)(m = 1, 2) and develop an iterative algorithm. For numerical approximation of the LB embedding of the surfaces, we choose the first N eigen-functions for both surfaces. For the target surface ℳ2, we compute its LB eigen-system by solving (9) with the uniform weight and fix its embedding by picking Φ2 randomly from ℬ(ℳ2), which is the set of LB basis with all possible sign combinations. For the surface ℳ1, we start with the uniform weight w = 1 and iteratively update Φ1 and w to minimize E.
At each iteration, we first compute the eigen-system of ℳ1 by solving (9) given the current weight and search Φ1 from ℬ(ℳ1) to minimize E. With the current basis Φ1 and Φ2 for embedding, we denote Id1(𝒱1) = A𝒱2 and Id2(𝒱2) = B𝒱1 as the nearest point maps from to , and vice versa. In each triangle of , the nearest point to the embedding of a vertex 𝒱1,i in ℳ1 is calculated and the one achieved the minimum distance is defined as the projection of onto . Thus this projection relation Id1 can be represented as the linear interpolation from the vertices of the corresponding triangle in ℳ2 and the interpolation coefficients are saved in the matrix A. Similarly, the projection from the embedding of ℳ2 to ℳ1 is represented as the matrix B. Given these two maps, we write the energy in discrete form as:
| (11) |
where S(ℳ1) and S(ℳ2) are the surface area of ℳ1 and ℳ2, the matrices U1 and U2 are defined in (10) with uniform weight, i.e., the standard metric induced from ℝ3. Using the eigen-derivatives with respect to the weight functions, we can update the weight function w in the gradient descent direction as in (12) at the bottom of the page, where and are the derivatives of the eigen-system with respect to the conformal metric. By updating w according to (12), we iteratively move w in the direction of minimizing the differences of corresponding eigen-functions of the two surfaces, and thus their distance in the embedding space. Numerical details about the computation of the eigen-derivatives are summarized in the Appendix. By repeating the above steps for searching Φ1 and updating w, we minimize the energy function until convergence. The final conformal map is then obtained by the composition of the embedding , the nearest point map Id1 and the inverse map as defined in (6). Because is an embedding, its inverse is one-to-one and onto. Numerically we carry the same interpolation represented in A and B to the Euclidean space to obtain the inverse map.
| (12) |
When a large number of eigen-functions are used, the search for the optimal embedding from B(ℳ1) becomes computationally expensive. We not only need to search from 2N possible sign combinations of the eigen-functions, but also have to consider possible switching of the order of the eigenfunctions between different surfaces [31]–[33]. Histogram features were used in previous work to search for matched eigen-functions across surfaces [32]. While true multiplicities are rare, numerically it is possible for near multiplicities to cause the eigen-spaces to split in different directions, which would make the direct matching of eigen-functions a difficult task. In our algorithm, we mainly focus on resolving the sign ambiguities and the change of the ordering of eigen-functions. The detection and analysis of high-dimensional eigen-spaces with multiplicity greater than one will be the work of future research. In our algorithm, we take a multi-scale approach to alleviate some of these challenges and will show that our method can produce excellent results for many surface mapping problems. We first optimize the embedding with low-order eigen-functions, and progressively increase the dimension of the embedding until the maximum order of embedding is achieved, which greatly reduces the search space for sign ambiguities. With this strategy, the final metric optimization algorithm is summarized in Table I. In this algorithm, we start the metric optimization at the order of N = Ninit. Convergence of the iterative process is determined by the oscillation of the energy to be minimized. While there is currently no theoretical guarantee about convergence, we find this criterion provides a satisfactory solution in all our experiments. Once convergence is reached for this process, we increase the order by a number Nincr, which is typically chosen as 5 in our experiments. The algorithm stops when the process stops at the highest order Nmax. Note that different search strategies for the optimal embedding of ℳ1 are used in step 2.1 of the algorithm. When N = Ninit, we only search from the 2N sign combinations of the eigen-functions for the optimal embedding at the first iteration. In subsequent iterations, for every eigen-function computed with the updated w, we find its best match with eigen-functions in the previous iteration to establish its order and sign in the embedding, which only involves N(N +1)/2 comparisons. This not only removes the sign ambiguity, but also accounts for possible switching of the ordering of eigen-functions. When the order is increased by Nincr, we keep the eigen-functions optimized previously and search from the 2Nincr sign combinations of the latest Nincr high-order eigen-functions for the optimal embedding. This only needs to be done once in the first iteration. After that, the same correlation operations are used to establish the optimal embedding in subsequent iterations, where the sign and ordering of all N eigen-functions are reestablished in each iteration.
TABLE I.
Metric Optimization Algorithm
Inputs:ℳ1, ℳ2, Ninit, Nincr, Nmax. Outputs: optimized metric w on ℳ1.
|
With the numerical algorithm in Table I, we have a novel way of computing surface maps in the embedding space. At the core of this algorithm is the computation of the gradient of the energy with respect to the metric to be optimized. This technique is general and could be useful in other surface analysis problems in the embedding space. In the next section, we will apply it to compute a group-wise atlas in the LB embedding space.
IV. Brain Mapping Applications
For population studies, it is desirable to take a group-wise perspective for atlas construction [13], [39]–[41]. This has the advantage of reducing bias and speeding up convergence. In this section, we develop a group-wise atlas construction approach in the LB embedding space with the metric optimization technique developed in the previous section. Based on this atlas construction method, a cortical label-fusion method is developed in the embedding space.
A. Group-wise Atlas Construction
Given a set of genus-zero surfaces ℳp(p = 1,⋯, P), our goal is to compute a group-wise atlas (ℳ*, w* g) that has the smallest average distance to all individual surfaces in the embedding space. Theoretically we can choose the geometric representation of the atlas ℳ* as any genus-zero surface because they are conformally equivalent. In practice, we choose ℳ* as the surface that has the smallest distance to all other surfaces in the set to speed up convergence. Our goal is to find the optimized metric w* g that minimizes the following energy function:
| (13) |
where Φ* and Φp are the LB embeddings of ℳ* and ℳp(p = 1,⋯, P). To avoid potential bias, multiple surfaces could be used as ℳ* and the optimized energy of each choice can be compared to find the group-wise atlas with the smallest distance to all the surfaces.
| (14) |
To numerically compute the group-wise atlas, we follow a similar approach as in section 2 for metric optimization. While the multi-scale approach in Table I could be extended to the group-wise atlas construction, we focus here on using only the low-order eigen-functions for computational efficiency. Practically this also makes sense as the goal is to use the atlas to capture low frequency variability across the population without over-fitting the data. Let N denote the number of eigen-functions used for embedding. At initialization, we first compute the eigen-system for ℳ* with w = 1 and denote them as (λn, fn). By fixing this initial embedding, we remove sign ambiguities in all surfaces as follows. For each surface ℳp, we compute its eigen-system and search through 2N sign combinations to obtain the embedding that minimizes the distance to the embedding of ℳ*. We denote the eigen-system for this embedding of ℳp as (λp,n, fp,n). Note that they are fixed in subsequent iterations. After that, we iteratively optimize the weight to find the group-wise atlas. At each iteration, we compute the eigen-system of (ℳ*, w* g). The sign ambiguities are removed by comparing with the eigen-system computed in the previous iteration as in Table I. Given the embedding, the gradient of the energy with respect to the metric w* can then be computed as defined in (14) at the bottom of the page, where S(·) denote the area of surface, U and Up are defined as in (10) for ℳ* and ℳp, respectively. The interpolation matrix Ap, and Bp are used to represent the nearest point maps between ℳ* and ℳp in the embedding space. We update w* in the gradient descent direction and continue this process until convergence to obtain the groupwise atlas (ℳ*, w* g). Note there is no averaging of surfaces in the group for the computation of the atlas, and it has exactly the same mesh structure as the initial surface ℳ*.
B. Fusion of Cortical Labels
Anatomically cortical surfaces are composed of a set of relatively well-defined regions, and their automated parcellation can help ROI-based analysis for features such as gray matter thickness [11], [30], [42]. Based on the group-wise atlas and conformal surface maps, we develop here a novel approach for automated cortical labeling by fusing the manually delineated labels on a set of surfaces [43]–[45].
Given a set of surfaces ℳp(p = 1,⋯, P) and their manually delineated label Lp : ℳp → 𝒵, where 𝒵 is a set of discrete labels, we first construct their group-wise atlas (ℳ*, w* g). Let denote the LB embedding of the group-wise atlas. For each surface, we then compute its optimized embedding using the pair-wise surface mapping algorithm in Table I that minimizes the distance to . For an unlabeled, subject surface ℳS, we compute its optimal metric wS such that the distance between its LB embedding and is minimized. With all the embeddings, the conformal maps μp : ℳS → ℳp from the subject surface to the labeled surfaces can be defined easily:
| (15) |
where Idp denote the nearest point map from to .
Using these maps, we calculate the label on the subject surface ℳS by fusing the labels from ℳp(p = 1,⋯, P) with weighted voting [43]–[45]. At every point of ℳS, the weight of ℳp are computed according to the similarity of mean curvature between the labeled and subject surface. Let υi ∈ ℳS be the i-th vertex, and 𝒩Γ(υi) be its Γ-ring neighborhood. The map of this set of points onto ℳp is μp(𝒩Γ(υi)). The similarity between ℳS and ℳp at this vertex υi is defined as the Pearson’s correlation coefficient between the mean curvature of the two set of points 𝒩Γ(υi) and μp(𝒩Γ(υi)):
| (16) |
where κ(·) denote the mean curvature. Following the label fusion approach, we calculate the weight for each label 𝒵q ∈ 𝒵 as Wq = ∑Lp(μp(𝒱i))==𝒵q Cp by summing up the similarity measure from surfaces with the same label 𝒵q at the corresponding point μp(𝒱i). The final label L(υi) at the vertex υi is derived as the one with the maximal weight:
| (17) |
By applying the label fusion approach to all vertices on ℳS, we obtain the label map for the whole cortical surface.
V. Experiments
In this section, we demonstrate our metric optimization approach for surface mapping by applying it to map cortical and hippocampal surfaces in brain imaging studies. We will first illustrate the detailed property of our method in individual mapping experiments. After that, both the cortical labeling and hippocampal mapping methods derived from our metric optimization approach will be compared with previous surface mapping methods and applied to two population studies to demonstrate their potential in large scale brain mapping research.
A. Mapping Cortical and Hippocampal Surfaces
In this experiment, we apply our algorithm to the mapping of cortical and hippocampal surfaces extracted from MR images. We will show that our method can achieve high quality mapping results on brain surfaces of varying complexity and demonstrate its applicability in studying general neuroanatomical structures.
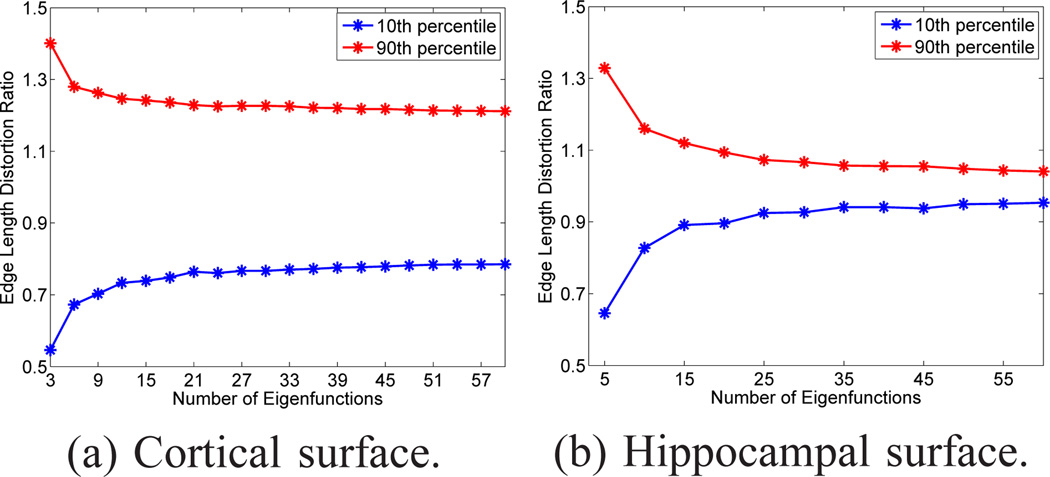
Before we perform surface mapping with our method, we need to determine the number of eigen-functions Nmax to use for different surfaces. Ideally we want the embedding to be as isometric as possible to minimize numerical errors of all the interpolation operations in the embedding space, but computational cost should also be considered for large meshes. For this purpose, we calculate the metric distortion during the embedding process. Given a triangular mesh ℳ = (𝒱, 𝒯), its embedding is also a triangular mesh , where denotes the coordinates of the vertices in the embedding space. The metric distortion during embedding is calculated as the ratio of the length of corresponding edges in ℳ̂ and ℳ after normalization with respect to surface areas. For a cortical and hippocampal surface, we plotted in Fig. 3 the 90th and 10th percentile of edge length distortion ratio as a function of the number of eigenfunctions. With the increase of Nmax, the metric distortion decreases as the two curves move toward each other. For the cortical surface, we can see the largest drop in metric distortion happens when we increase Nmax from 3 to 6. For the hippocampal surface, the largest drop in metric distortion occurs when we increase Nmax from 5 to 10. The two curves in Fig. 3(b) also move much rapidly toward each other as compared with the curves in Fig. 3(a). Guided by the plots in Fig. 3, we typically choose Nmax = 6 for cortical surfaces as a trade-off between embedding quality and computational cost. For hippocampal surfaces, the mesh size is much smaller, so we can afford to pick a higher Nmax = 30 in our experiments.
Figure 3.
Metric distortions of a cortical and hippocampal surface during the LB embedding process. For each surface, the 10th and 90th percentile of edge length distortion ratio with respect to the dimension of the embedding space are plotted.
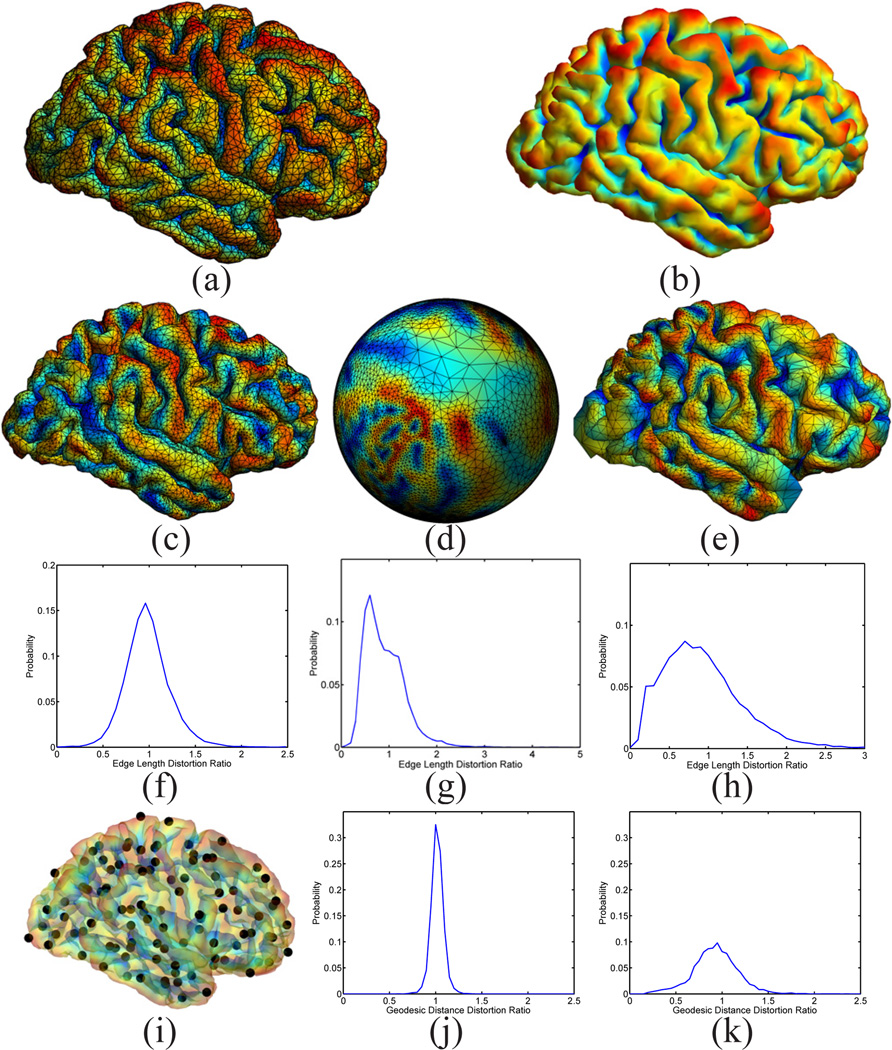
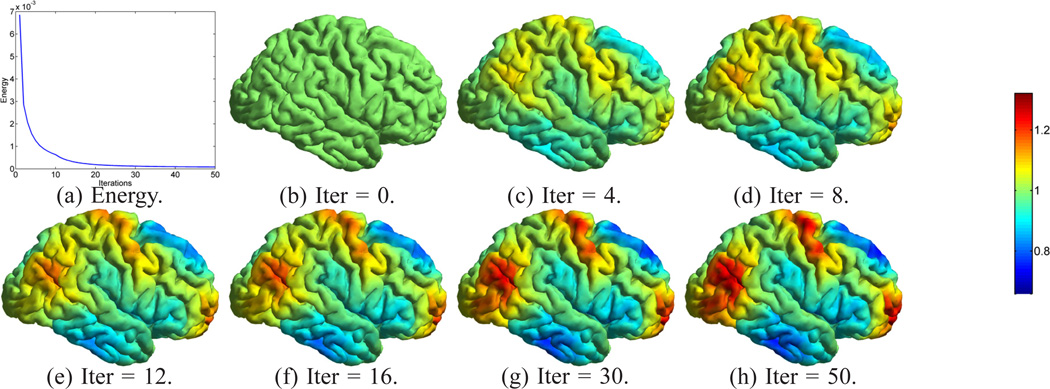
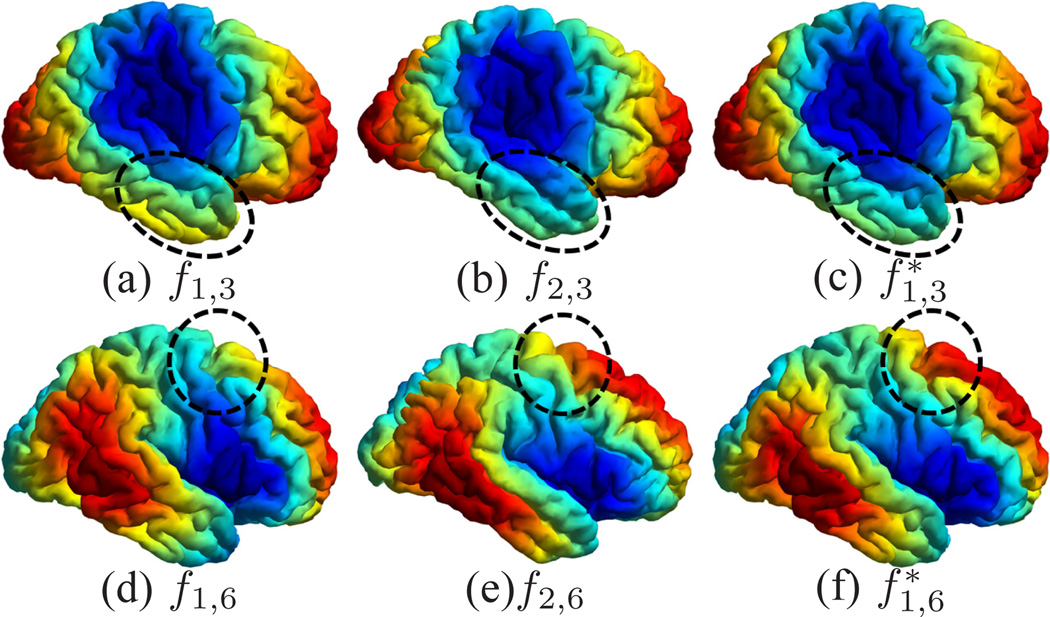
For the mapping of cortical surfaces, the source and target surfaces are shown in Fig. 4(a) and (b), where the surfaces are colored with their mean curvature. Both surfaces are represented as triangular meshes with 10,000 vertices. For the parameters in Table I, we choose Ninit = Nmax = 6, and Nincr = 0. The iterative process in metric optimization is illustrated in Fig. 5. The decrease of the energy with the increase of the iterations is plotted in Fig. 5(a). Starting with w = 1 plotted in Fig. 5(b), the metric w gradually changes and stabilizes after iteration 30. The whole computational process took around 3 hours on a 2.6GHz Intel Xeon CPU with maximal memory consumption around 3 Gigabytes. With the minimization of the energy, the LB embedding of the surface moves toward the embedding of the target surface. To demonstrate that this is indeed the case, we plotted the 3rd and 6th eigen-functions of the source surface before and after metric optimization as compared with the target surface in Fig. 6. The most obvious changes can be observed in regions highlighted by the dashed ellipsoids, where the agreement of the corresponding eigen-functions can be seen clearly. Compared with the optimized metric plotted in Fig. 5(h), we can see that these two regions are unsurprisingly among those with large metric deformations.
Figure 4.
A demonstration of the mesh quality in the cortical mapping experiment.(a) The source surface ℳ1. (b) The target surface ℳ2. (c) The projection of the mesh of ℳ1 onto ℳ2 with our map. (d) The projection of the mesh of ℳ1 onto the unit sphere with the spherical conformal map. (e) The projection of the mesh of ℳ1 onto ℳ2 with the map computed by Spherical Demons. (f) Metric distortion of our map from ℳ1 to ℳ2: 0.98 ± 0.25 (Mean±STD, same for (g)(h)(j) and (k)). (g) Metric distortion of the spherical conformal map: 0.91 ± 0.43. (h) Metric distortion of the map computed by Spherical Demons: 0.93 ± 0.52. (i) Point set on ℳ1 for the computation of geodesic distances. (j) Metric distortion of our map as measured by geodesic distances: 1.02 ± 0.066. (k) Metric distortion of the Spherical Demons map as measured by geodesic distances: 0.93 ± 0.24.
Figure 5.
The iterative energy minimization process for metric optimization. (a) The minimization of the energy. (b)–(h) The iterative changes of the metric w.
Figure 6.
Alignment of eigen-functions between the source surface ℳ1 and the target surface ℳ2 with metric optimization. The 3rd and 6th eigen-functions are shown here for comparison, especially in regions highlighted by the dashed ellipsoids. The eigen-functions of ℳ1 after metric optimization are denoted as and .
Using our map from the source to the target surface, we can project the mesh of ℳ1 in Fig. 4(a) to the target surface ℳ2. The result is plotted in Fig. 4(c), where the projected mesh is color-coded by the mean curvature of ℳ1.We can see not only the regular mesh structure is very well preserved during the projection, but the folding pattern of the gyrus of ℳ1 aligns very well with the target surface. As a comparison, we also projected the mesh of the source surface onto the unit sphere using its spherical conformal map computed with the method in [9]. The projected mesh is also color-coded with the mean curvature of ℳ1. The difference of our direct conformal map between cortical surfaces and the spherical conformal map can be best illustrated with the metric distortion during the mapping process, which we measure as the ratio of the length of corresponding edges of the projected mesh in Fig. 4(c) and (d) to the original mesh in Fig. 4(a). The histograms of the metric distortion of these two maps are plotted in Fig. 4(f) and (g). Compared with the metric distortion of the spherical map in Fig. 4(f), we can see that the histogram in Fig. 4(e) is centered around one and shows the conformal map computed with our method does a much better job in reducing metric distortion. For further comparison with spherical maps, we applied the publicly available Spherical Demons registration algorithm [11] to register the spherical conformal maps of both surfaces using their mean curvature. The source mesh ℳ1 was then projected to target surface ℳ2 using the registered spherical map and the result is shown in Fig. 4(e). The histogram of the edge length distortion ratio between the projected mesh in Fig. 4(e) and Fig. 4(a) is plotted in Fig. 4(h). Clearly it has much more variable metric distortion as compared to our method.
Besides the distortion of local edge length, we also used pairwise geodesic distances of a set of uniformly scattered points on the surface to compute more global metric distortions of the maps. As shown in Fig. 4(i), a set of 100 points scattered over the source surface ℳ1 were used in this experiment. The geodesic distance between each pair of points was computed with the fast marching algorithm on triangular meshes [46]. Using the surface maps computed with our method and Spherical Demons, we projected the point set onto the mesh in Fig. 4(c) and (e). Pairwise geodesic distances of the point set were then computed on the projected meshes and their ratio with respect to the corresponding pairwise geodesic distance on the source surface ℳ1 was calculated. As a summary, the histogram of the ratio of geodesic distances from our method and Spherical Demons are plotted in Fig. 4 (j) and (k). As can be seen from the much smaller standard deviation of geodesic distance distortion ratio in Fig. 4 (j), our method achieved better performance in preserving more global geodesic distances as well.
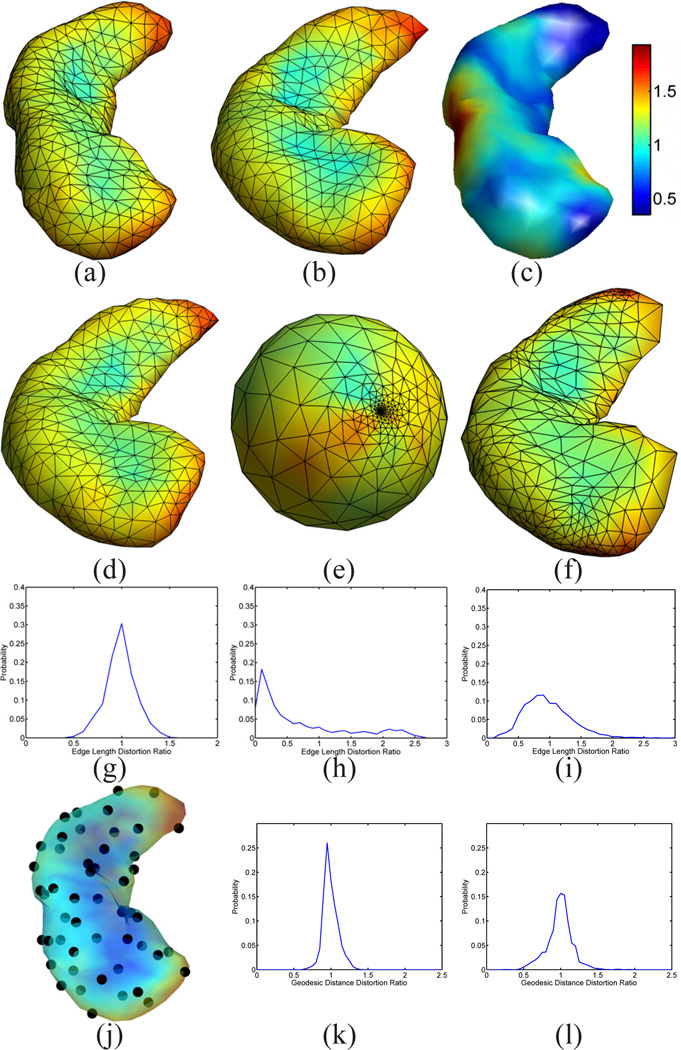
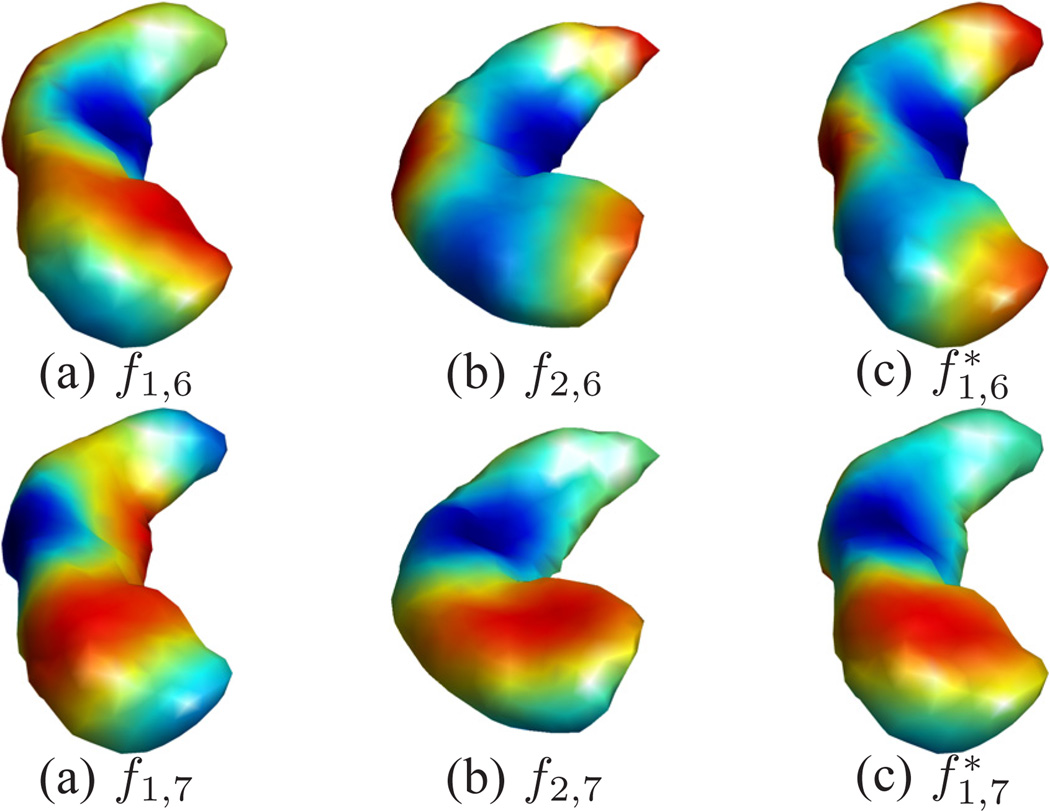
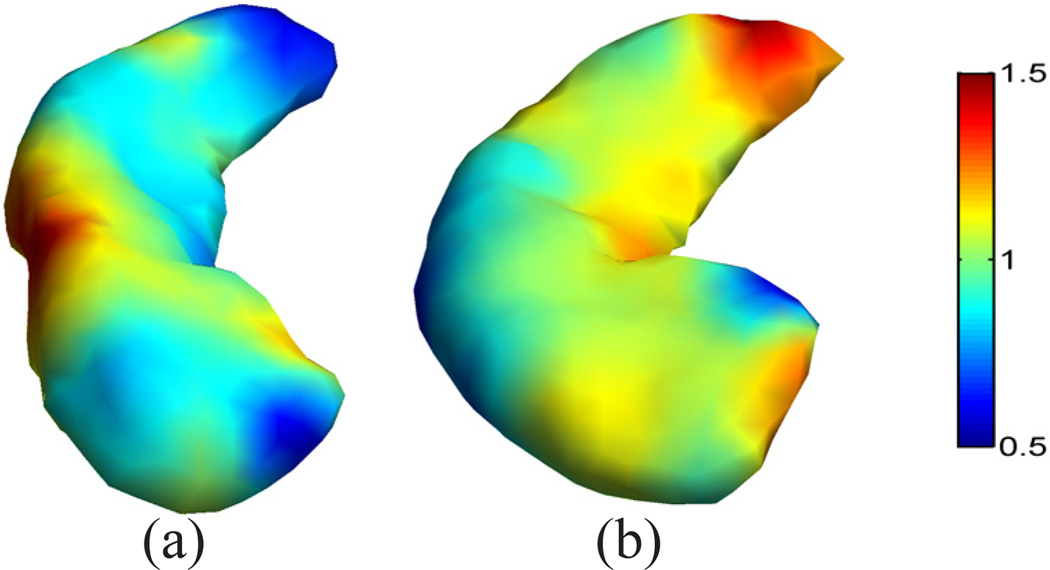
Next we show the mapping results of two hippocampal surfaces with the use of a much higher number of eigenfunctions. The source and target surfaces are plotted in Fig. 7 (a) and (b). These are the same surfaces shown in Fig. 1 (a) and (d), except that we color-code both surfaces here with their mean curvature for better visualization of mapping quality. The non-isometric difference between the surfaces can be seen that the target surface has more bending. This is reflected in the eigen-functions plotted in Fig. 8, where the 6th and 7th eigen-functions of both surfaces are plotted. To minimize their differences in the embedding space, we applied the algorithm in Table I with the following parameters: Ninit = 10, Nincr = 5, and Nmax = 30. Note that here the multi-scale optimization scheme was applied for computational efficiency. For these hippocampal surfaces with 1000 vertices, the computational process took 20 minutes on a 2.6GHz Intel Xeon CPU and the maximal memory consumption is around 60 Megabytes. The optimized metric w is plotted on the source surface in Fig. 7(c). From the eigen-functions computed with the optimized metric shown in Fig. 8(c) and (d), we can see the metric optimization process successfully aligns the LB embeddings of the two surfaces. With the direct conformal map from the source to the target surface, we can project the mesh of the source surface onto the target surface as shown in Fig. 7(d), which is color-coded with the mean curvature of the source surface. By comparing the coloring of the mesh in Fig. 7(b) and (d), we can see corresponding regions are very well aligned. More quantitatively, the correlation coefficient between the mean curvature of corresponding points on the source and target mesh is 0.87. Similar to the cortical mapping experiment, we also project the source mesh onto the unit sphere with the spherical map computed with the algorithm in [9] and plot the result in Fig. 7(e), which shows the spherical map generates very irregular mesh structure. This is corroborated by the histograms of metric distortions shown in Fig. 7(g) and (h) from our map and the spherical map, respectively. For the spherical maps of both hippocampal surfaces, the Spherical Demons algorithm was applied to align the surfaces with their mean curvature. After that, the obtained map was used to project the source mesh ℳ1 onto the target surface as shown in Fig. 7 (f). We can see it has more irregular mesh structure than the mesh in Fig. 7 (d) even though the mean curvature is matched thanks to the Spherical Demons registration, which resulted in a correlation coefficient of 0.85 between the mean curvature of the source mesh and its projection on the target surface. The edge length distortion ratio between the projected mesh in Fig. 7 (f) and source mesh Fig. 7 (a) is calculated and its histogram is plotted in Fig. 7 (i). For the three maps shown in Fig. 7 (d), (e), and (f), the standard deviations of the edge distortion ratio are: 0.16, 0.71, and 0.38. This confirms that our method produces the most regular mesh structure. We also quantify the metric distortion of surface maps with more global geodesic distances of a set of 50 points shown in Fig. 7(j). Similar to the cortical mapping experiment, the ratio of pairwise geodesic distances are calculated for our map and the Spherical Demons map, and the histograms of the geodesic distance distortion ratio of the two maps are plotted in Fig. 7(k) and (l). For the two maps shown in Fig. 7 (d) and (f), the standard deviation of the geodesic distance distortion ratio are 0.10 and 0.17. This further confirms that our method achieves better performance in preserving metric than the maps produced by spherical registration. These results demonstrate that our method can generate hippocampal surface maps with highly regular metric distortion and excellent alignment of geometric features.
Figure 7.
Mapping results of hippocampal surfaces. (a) The source surface ℳ1. (b) The target surface ℳ2. (c) The optimized metric w. (d) The projection of the source mesh onto the target surface. (e) The projection of the source mesh onto the unit sphere with spherical conformal map. (f) The projection of the source mesh onto the target surface after Spherical Demons registration. (g) Metric distortion of our map: 0.99 ± 0.16 (Mean±STD, same for (h)(i)(k) and (l)). (h) Metric distortion of the spherical conformal map: 0.69 ± 0.71. (i) Metric distortion of the map after Spherical Demons registration: 0.97 ± 0.38. (j) Point set for the computation of geodesic distances. (k) Distortion ratio of Geodesic distances with our map: 0.99 ± 0.10. (l) Distortion ratio of geodesic distances with the map from Spherical Demons registration: 0.99 ± 0.17.
Figure 8.
Improved agreement of hippo eigen-functions. The 6th and 7th eigen-functions are shown here for comparison. The eigen-functions of ℳ1 after metric optimization are denoted as and .
B. Multi-atlas Cortical Label Fusion
In the second experiment, we demonstrate our metric optimization method in group-wise atlas construction and cortical label fusion. Using the LONI Probabilistic Brain Atlas (LPBA40) [47], which consists of a set of 40 manually labeled MR volumes, we develop an automated cortical labeling system by fusing labels from the atlases. Cross-validations will be performed on the LPBA40 data to quantitatively evaluate the accuracy of the labeling system. The effectiveness of this system in brain mapping study will also be demonstrated on a brain development study with 80 subjects.
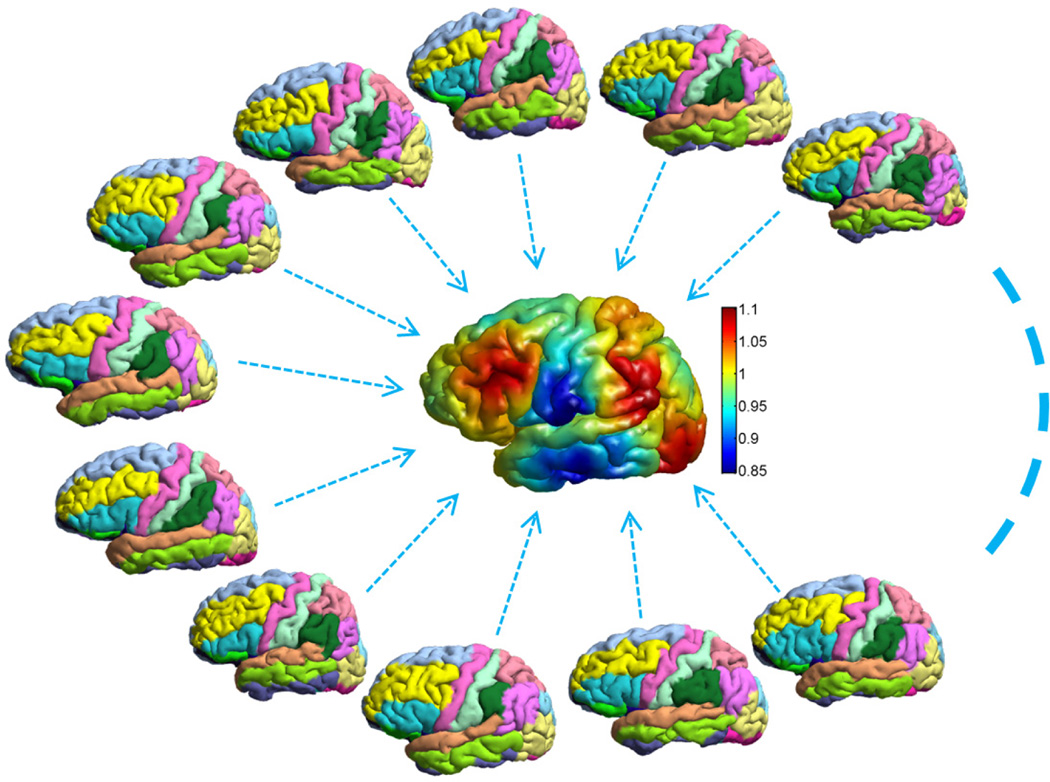
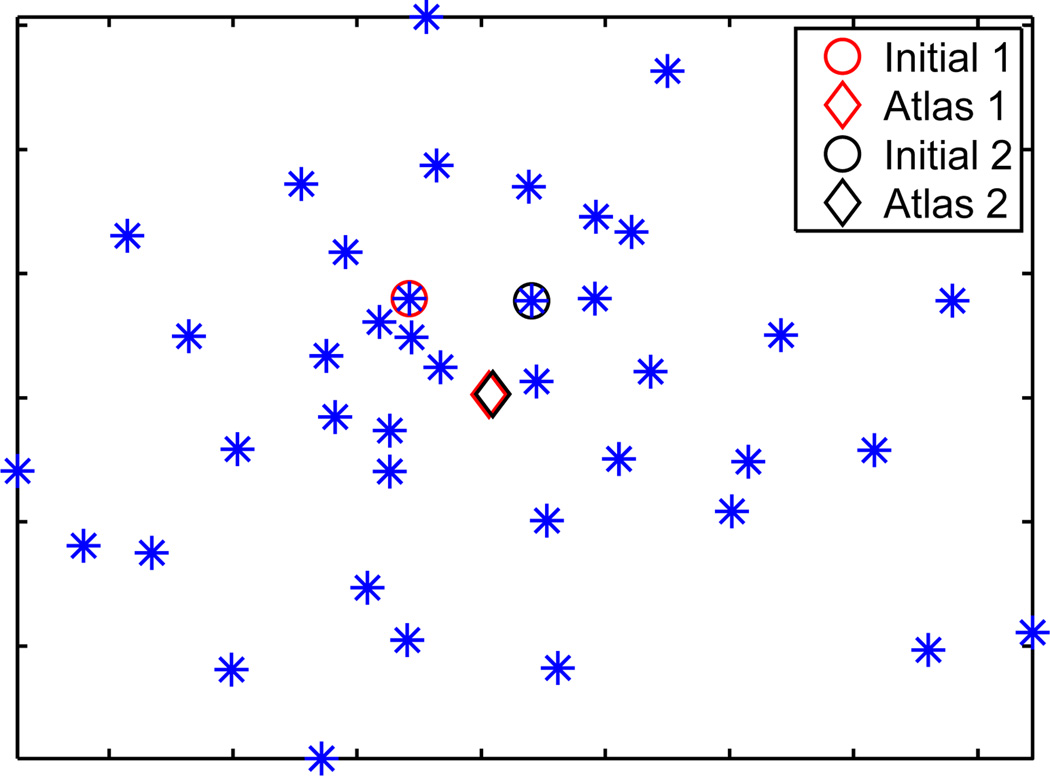
As a first step for atlas construction, we reconstructed the cortical surfaces from the T1-weighted volumes of the LPBA40 data set with the method in [26]. A set of 24 manually delineated gyral labels were projected onto the cortical surfaces to generate the individual atlas surfaces in our system. Example surfaces with labels are plotted in Fig. 9. In our experiment, only the left hemispherical surfaces were used for atlas construction, but the automated labeling system was applied to both left and right hemispherical cortical surfaces. This helps demonstrate the robustness of our intrinsic mapping method to contralateral differences of cortical surfaces. From the 40 atlas surfaces, we constructed a group-wise atlas surface with N = 6 eigen-functions. As a test of the robustness of the group-wise atlas construction algorithm, we started it with two different initial surfaces and compared the obtained atlases. To visualize the results, we applied multi-dimensional scaling (MDS) to the 40 atlas surfaces and the two group-wise atlases with their spectral l2-distances as the dissimilarity measure. The results are shown in Fig. 10. We can see clearly that the group-wise atlas construction algorithm converges to the same solution with two different initializations. For the first initial surface, the group-wise atlas is visualized in the center of Fig. 9, where the coloring on the surface shows the optimized weight function.
Figure 9.
An illustration of the group-wise atlas construction using the LPBA40 data. The group-wise atlas is plotted in the center of the figure.
Figure 10.
Projection of the 40 surfaces (plotted as *) and group-wise atlases (plotted as ◊) from two initial surfaces (plotted as ○) onto a 2D plane using MDS.
With the pairwise mapping algorithm, we computed the conformal map from every individual atlas surface to the group-wise atlas surface to enable the multi-atlas fusion algorithm in section IV-B. To automatically generate the label on a new surface, we first computed its conformal map to the group-wise atlas with metric optimization. After that, the fusion algorithm developed in section IV-B can be applied.
Using the 40 individual atlas surfaces with manual labels, we first conducted a leave-one-out cross-validation to quantitatively evaluate the performance of our labeling algorithm. Note that the group-wise atlas surface only serves as a geometric center of the population and there is no label associated with the surface, thus it was fixed during the cross-validation. For each of the 40 surfaces, we computed its automatically generated labels by fusing the manual labels from the other 39 surfaces. The Dice coefficient between the manual and fused label was computed for each region on all surfaces. The mean and standard deviation (STD) of the Dice coefficients for the 24 ROIs are listed as Dice I in Table II. Across all regions, the average Dice is 0.82. For many regions, the Dice coefficients approach 0.9. As a comparison, we turned off the metric optimization process in all computations and ran the leave-one-out cross-validation experiment again to generate fused labels on the 40 surfaces. The mean and STD of the Dice coefficients between manual and automatically generated labels are listed as Dice II in Table II. Interestingly we can see that these two methods achieved very similar performance in many of the regions, which indicates that label fusion applied to the LB embedding space can already achieve very good results. For each of the 24 ROIs, we applied a t-test to the 40 Dice coefficients from these two methods to compare if their performance is significantly different. In seven ROIs (pre-cuneus, middle-occipital, inferior-occipital, cuneus, middle-temporal, inferior-temporal, and lingual gyrus), Dice I is significantly higher (P-value<0.05) than Dice II. There is no ROI that Dice II is significantly better than Dice I. This shows that much improved performance of gyral labeling can be achieved with the help of metric optimization.
TABLE II.
Leave-one-out Cross-validation results. Dice coefficients are listed as mean ± std. (Dice I: Label Fusion With Metric Optimization; Dice II: Label Fusion Without Metric Optimization. Dice III: FreeSurfer Labeling Result One. Dice IV: FreeSurfer Labeling Result Two)
| ROI | Our Method | FreeSurfer | ROI | Our Method | FreeSurfer | ||||
|---|---|---|---|---|---|---|---|---|---|
| Dice I | Dice II | Dice III | Dice IV | Dice I | Dice II | Dice III | Dice IV | ||
| Sup-Frontal | 0.89±0.029 | 0.89±0.032 | 0.88±0.025 | 0.88±0.024 | Mid-Frontal | 0.88±0.042 | 0.88 ±0.039 | 0.88±0.034 | 0.89±0.032 |
| Inf-Frontal | 0.84±0.051 | 0.83±0.051 | 0.84±0.042 | 0.84±0.036 | Pre-Central | 0.84±0.071 | 0.84±0.058 | 0.85±0.035 | 0.84±0.037 |
| Mid-Orbitofrontal | 0.78±0.097 | 0.78±0.12 | 0.81±0.073 | 0.81±0.074 | Lat-Orbitofrontal | 0.75± 0.11 | 0.74±0.10 | 0.74±0.070 | 0.73±0.072 |
| Gyrus-Rectus | 0.75±0.11 | 0.72±0.16 | 0.58±0.13 | 0.59±0.12 | Post-Central | 0.83±0.074 | 0.84± 0.054 | 0.84±0.038 | 0.84±0.036 |
| Sup-Parietal | 0.85±0.046 | 0.84±0.054 | 0.85±0.039 | 0.86±0.037 | Supramarginal | 0.81±0.085 | 0.81±0.081 | 0.83±0.059 | 0.82±0.056 |
| Angular | 0.80±0.078 | 0.79±0.082 | 0.80±0.072 | 0.79±0.079 | Pre-Cuneus | 0.83±0.043 | 0.81±0.047 | 0.81±0.039 | 0.83±0.038 |
| Sup-Occipital | 0.73±0.11 | 0.70±0.12 | 0.73±0.073 | 0.71±0.093 | Mid-Occipital | 0.81±0.060 | 0.78±0.074 | 0.79±0.057 | 0.79±0.069 |
| Inf-Occipital | 0.79±0.066 | 0.71±0.11 | 0.76±0.058 | 0.80±0.067 | Cuneus | 0.78±0.073 | 0.73±0.14 | 0.81±0.057 | 0.81±0.053 |
| Sup-Temporal | 0.89±0.045 | 0.88±0.045 | 0.88±0.049 | 0.88±0.047 | Mid-Temporal | 0.82±0.058 | 0.78±0.074 | 0.82±0.058 | 0.82±0.058 |
| Inf-Temporal | 0.79±0.056 | 0.74±0.093 | 0.79±0.060 | 0.80±0.049 | Para-Hippo | 0.80±0.066 | 0.78±0.065 | 0.75±0.074 | 0.77±0.070 |
| Lingual | 0.88±0.031 | 0.83±0.077 | 0.84±0.038 | 0.85±0.031 | Fusiform | 0.81±0.066 | 0.79±0.066 | 0.77±0.074 | 0.79±0.063 |
| Insular | 0.90±0.036 | 0.90±0.024 | 0.86±0.032 | 0.86±0.035 | Cingulate | 0.81±0.056 | 0.79±0.062 | 0.76±0.052 | 0.76±0.054 |
To compare with state-of-the-art cortical labeling methods, we first mapped all 40 surface to the sphere and then applied Spherical Demons to align them using their mean curvature. We chose Spherical Demons as the tool for spherical registration because it is computationally efficient and can obtain the same level or better performance in cortical parcellation than the spherical registration tool in FreeSurfer [11]. After that, tools in FreeSurfer [30] were applied to perform the leaveone- out cross-validation. For each surface, the mris_ca_label tool of FreeSurfer was applied to automatically generate the labels using the classifier learned by the mris_ca_train tool of FreeSurfer from the other 39 surfaces. To test the impact of different spherical mapping methods on the accuracy of cortical labeling, we repeated the experiments with spherical maps obtained from two different ways: the spherical conformal map and the spherical map generated by the mris_inflate and mris_sphere tool in FreeSurfer. For spherical maps calculated from each method, Spherical Demons registration and FreeSurfer labeling were applied. Dice coefficients between manual and automatically generated labels were computed and their mean and STD are listed in Table II: Dice III for the spherical conformal map and Dice IV for the FreeSurfer spherical map. For each ROI, a t-test was applied to the Dice coefficients from our metric optimization method (Dice I) and FreeSurfer (Dice III or Dice IV) to test if there are significant differences. From the t-test results applied to Dice I and Dice III, there are 7 ROIs that our method achieved significantly better performance (P-value<0.05): gyrus-rectus, inferior-occipital, para-hippocampal, lingual, fusiform, insular and cingulate gyrus. There is no ROI that Dice III is significantly better than Dice I. From the t-test results applied to Dice I and Dice IV, there are 5 ROIs that our method achieved significantly better performance: gyrus-rectus, para-hippocampal, lingual, insular, and cingulate gyrus, and one ROI that FreeSurfer achieved better performance: cuneus. For the rest of the ROIs, both our method and FreeSurfer achieved similar level of accuracy. In Table II, we have highlighted results of Dice I with red color for ROIs that it achieved significantly better performance in both comparisons with Dice III and IV from FreeSurfer. The Cuneus region that Dice IV obtained significantly better performance than Dice I is also highlighted with blue color. From these comparisons, we can see our method achieved excellent performance in automated cortical labeling.
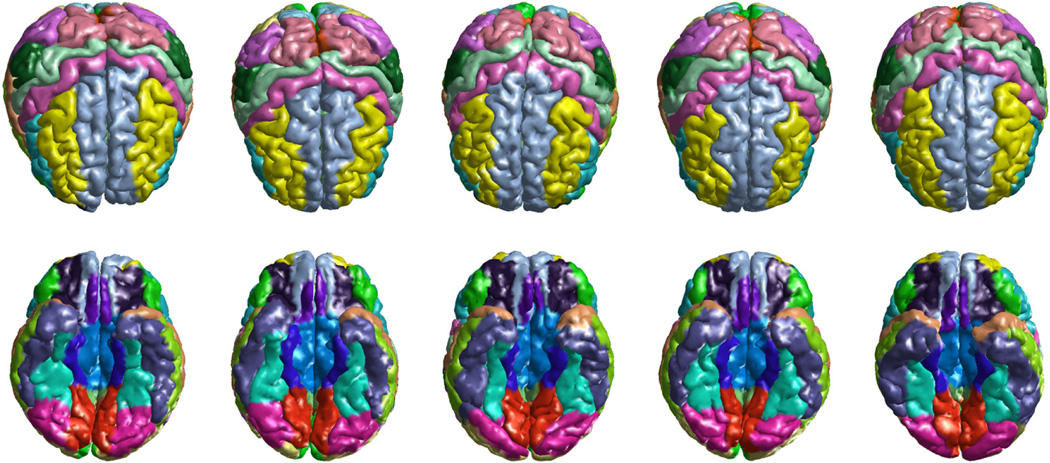
To demonstrate the effectiveness of our method in population studies, we applied it to MR images from a brain development study. The dataset is composed of T1-weighted MR volumes from 80 subjects with an age distribution from 7 to 17 years old. For each MR volume, both pial and white matter cortical surfaces were automatically extracted with the method in [26] and the labeling algorithm was applied to automatically generate the labels on the pial surface of both the left and right hemisphere. Because our surface mapping and labeling algorithms are intrinsic to surface geometry, there is no need of special handling for either hemisphere. As an illustration, we plotted the labeling results of five subjects in Fig. 11. For each subject, superior and inferior views of the labels on both hemispheres were plotted. We can see that excellent results have been obtained for all subjects.
Figure 11.
Cortical labeling results on both hemispheres of five subjects from the pediatric study. Top row: superior view; Bottom row: inferior view.
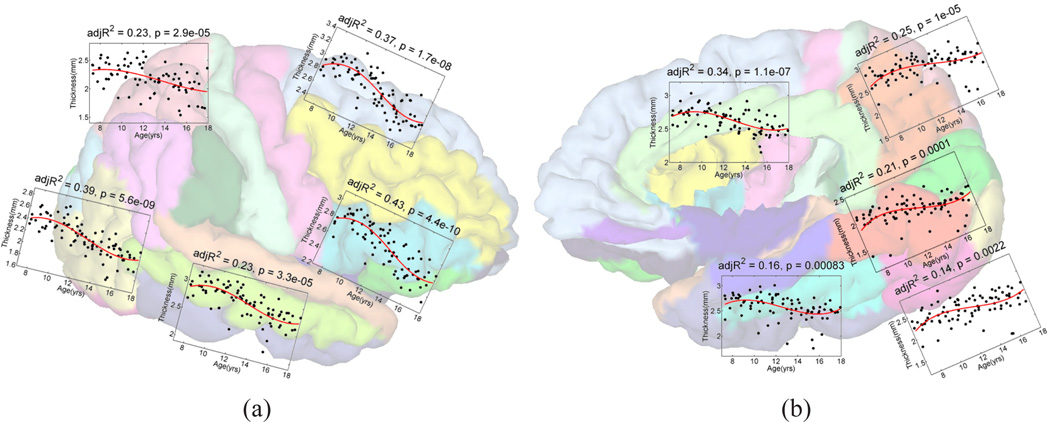
With cortical labels, we can investigate localized changes of structural and functional features during brain development. Here we focus on the change of gray matter thickness with age. Gray matter thickness at each point of the pial surface was computed as the shortest distance to the white matter surface [26] and the mean thickness of each gyrus was used as the variable for regression analysis. For brain development, it was reported in various studies that an inverted U-shape trajectory, which was typically modeled with third order polynomials, reflects the underlying synaptic pruning process [5], [48]. In this experiment we follow a similar approach and applied the third order polynomial for the regression analysis of thickness changes versus age. The significance of the regression model is measured with the F-test. For demonstration purposes, we plot the results of five regions on the lateral and medial surfaces of the left hemisphere in Fig. 12, where the adjusted R2 and p-value of the F-test were included. We can see that highly significant results were obtained with our method. The results also show that these regions experience different development processes. In particular, the inferior and superior frontal gyrus clearly demonstrate a nonlinear development process, while the thickness of regions such as the superior parietal gyrus exhibits an almost linear trajectory. This is consistent with previous reports that higher-order frontal regions mature later than lower-order regions such as the superior parietal gyrus [5], [48]. This experiment demonstrates that potential of our method in large scale cortical mapping studies.
Figure 12.
Regression results on the left hemisphere. (a) The results of the superior-fronal, inferior frontal, superior-parietal, medial-occipital,, and medial-temporal gyrus. (b) The results of the cingulate, precuneous, lingual, fusiform, and inferior-occipital gyrus.
C. Hippocampal Mapping in Multiple Sclerosis
In the third experiment, we applied our mapping algorithm to study hippocampal atrophy in MS patients with depression. The dataset includes T1-weightedMR images from 109 female patients with MS. Using the Center for Epidemiologic Studies-Depression (CES-D) scale as the measure for depression, the subjects were split into two groups: low depression (CES-D< 20) and high depression (CES-D≥ 20). Hippocampal masks were automatically segmented from the MR image with the FSL software [49]. The mesh representation of each hippocampus was then generated with the surface reconstruction method in [25], which has the advantage of being able to remove outliers without introducing shrinkage. In this experiment, we applied our method to map the right hippocampus of all subjects, which establishes one-to-one correspondences across population for points on hippocampal surfaces and allows the application of statistical tests to detect localized group differences.
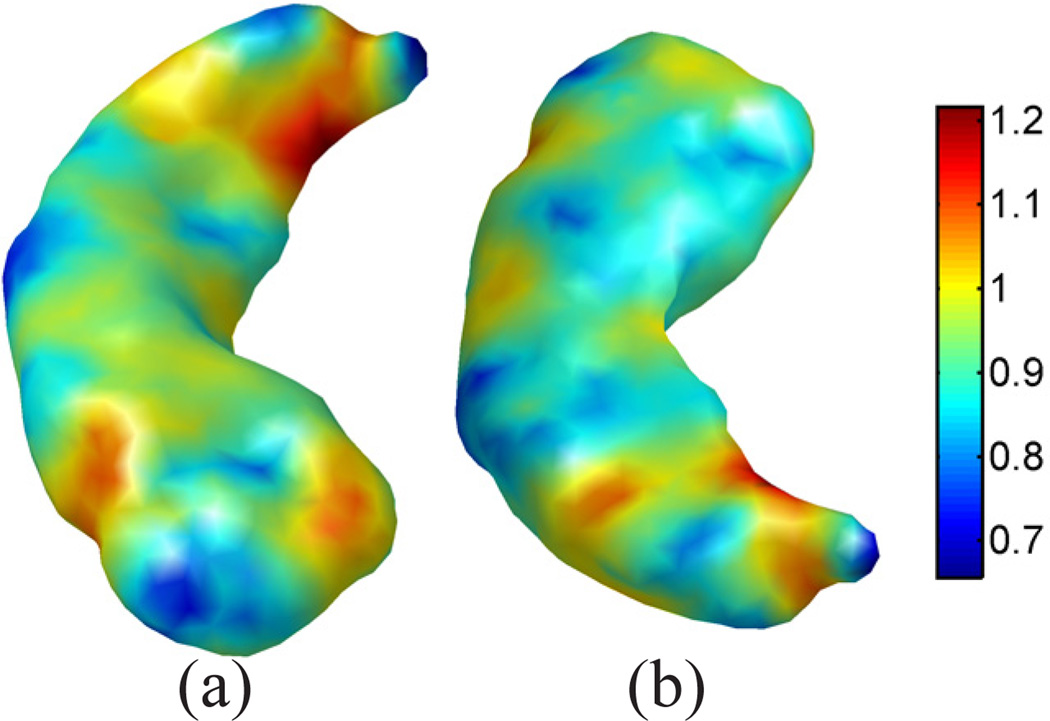
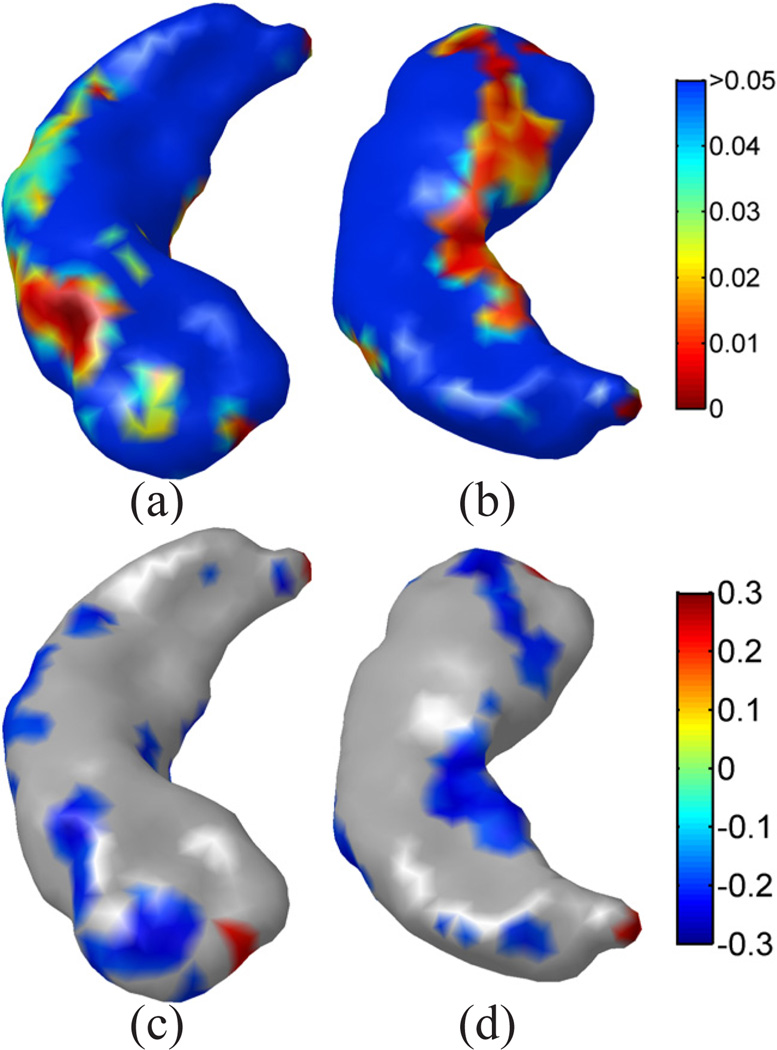
As a first step, we constructed a group-wise atlas as the target for each subject. For the construction of the group-wise atlas, we used the first 10 eigen-functions for metric optimization. The selection of the order at 10 is mostly based on the trade-off between computational cost and the metric distortion in embedding. The parameter analysis in Fig. 3 (b) shows that the largest drop in metric distortion occurs when we increase the order from 5 to 10. While further increasing the order will reduce the metric distortion, the computational cost will rise dramatically and become infeasible for a large collection of shapes used here. From the 109 surfaces, we picked the surface with the minimal spectral l2-distance to all other subjects as the geometric representation of the group-wise atlas. A remeshing process was applied to this surface to generate a regular mesh representation with 1000 vertices [50], which we denote as the atlas surface. The number of vertices selected in the remeshing process is to reduce computational cost in metric optimization, yet preserve enough detail for the detection of group differences. To complete the construction of the group-wise atlas, we computed the optimized metric by minimizing the energy in (13) and the result is plotted in Fig. 13 on the atlas surface. To study group differences, all surfaces were mapped to this group-wise atlas with the metric optimization algorithm in Table I with the same parameters as in the first experiment: Ninit = 10, Nincr = 5, Nmax = 30. Using the conformal maps to the atlas, we pulled back the mesh structure of the atlas surface to each subject surface, which established the one-to-one correspondences for statistical analysis. At each vertex, the thickness was then computed using the Reeb graph of the first LB eigen-function [16]. Using the thickness as the variable, a two-tailed t-test was applied at each vertex to map the differences between the lowdepression and high-depression groups. The p-value generated by the t-test at each vertex is plotted onto the atlas surface in Fig. 14 (a) and (b). The correlation between thickness and the CES-D score are plotted in Fig. 14(c) and (d), where we have masked out regions with non-significant correlation coefficients (p > 0.05). Clearly the regions with significant p-values have mostly negative correlation coefficients. The detected group differences thus show patients with high depression have more atrophy in those regions. To correct for multiple comparison, we applied 10,000 permutation tests and obtained an overall p-value of 0.016 [3], which shows the significance of the p-value map in Fig. 14(a) and (b).
Figure 13.
The optimized metric of the group-wise atlas of the hippocampal surfaces. (a) Superior view. (b) Inferi.or view.
Figure 14.
Hippocampal mapping results from our method. (a)(b) Superior and inferior views of the p-value map. (c)(d) Superior and inferior views of the correlation coefficients with CES-D scores. Note that regions with non-significant correlation coefficients have been masked out and plotted as gray. 10,000 permutation tests were applied and an overall p-value of 0.016 was obtained.
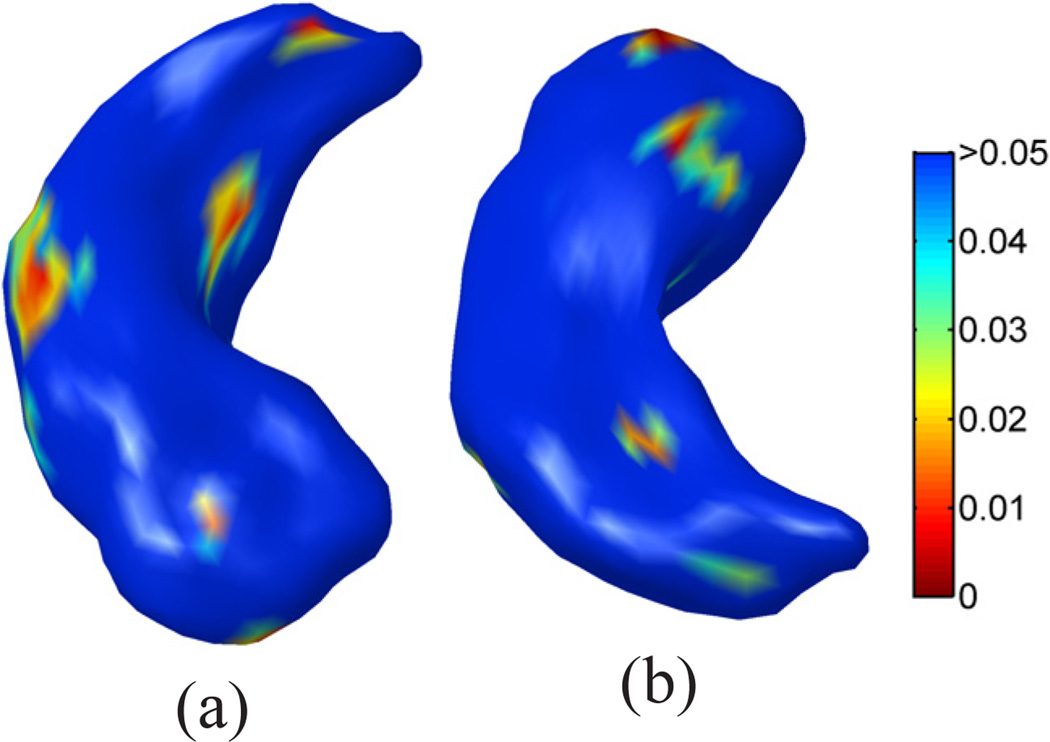
For comparisons with previous methods, we first applied the popular SPHARM tool [51], [52] to map the right hippocampus of all subjects and test for group differences. With the segmented masks from all subjects as the inputs, the SPHARM tool was able to automatically generate their mesh representations whose vertices have one-to-one correspondences across all subjects. As suggested in the manual of the SPHARM tool, spherical harmonics up to order 12 was used for hippocampal mapping. An icosahedron subdivision of the sphere at the division rate 10 was adopted such that all surface meshes will have 1024 vertices that are comparable to the number of vertices in our group-wise atlas. It was shown that the reconstructed meshes from SPHARM tended to have more artificial oscillations than the meshes we generated with the method in [25]. To factor out the impact of different mesh reconstruction algorithms, we projected the SPHARM mesh to the mesh used in our experiment. For each vertex in the SPHARM mesh, we find the triangle from our mesh that has the smallest distance to this vertex and calculate its projection as the nearest point in that triangle. Thus the projection has sub-vertex accuracy. This is the same projection process we used in the LB embedding space for calculating maps between the embeddings of surfaces. After that, the thickness was computed for statistical analysis. This allows us to focus on the impact of the correspondences generated by the SPHARM tool on studying group differences. The p-value map from the SPHARM correspondences is plotted in Fig. 15 (a) and (b). We can see very few regions reach significance in detecting group differences. To correct for multiple comparison, the same number of permutation tests were applied and it gave an overall p-value of 0.18 to this p-value map, which failed to reach significance.
Figure 15.
The mapping results from SPHARM for comparisons with our method. (a) Superior view. (b) Inferior view. 10,000 permutation tests were applied and an overall p-value of 0.18 was obtained.
Next we compare our method with the ShapeWorks tool that uses an entropy-based particle system to perform group-wise surface mapping [53]. The inputs to the ShapeWorks tool are the 109 segmented masks. The only parameter to set are the number of particles to use and the STD of the Gaussian kernel used in the preprocessing step of ShapeWorks for smoothing the mask boundaries, which we found a necessary step for ShapeWorks to achieve good performance. To be comparable to the number of vertices used in previous experiments, we set the number of particles to be 1024. For all masks, we set the STD=0.5mm to avoid overly shrinking the boundary. In our experience, if the STD is set to be ≥ 1, it will result in the removal of critical anatomical information, especially in thin regions such as the subiculum of the hippocampus. After group-wise optimization, ShapeWorks generate a set of particles for each shape that have one-to-one correspondences across the population.
Unlike our method and the SPHARM tool, there is no consistent mesh structure across population for the particles in ShapeWorks. This means that the correspondences could be non-diffeomorphic. To demonstrate this point, we computed a mesh representation of the particles in the mean shape generated by ShapeWorks. As shown in Fig. 16(a), a very uniform mesh structure was generated for the mean shape, where the particles from ShapeWorks serve as the vertices of the triangular mesh. Using the correspondences of particles, the mesh structure of the mean shape was applied to all subjects. As an example, we show in Fig. 16(b) the mesh representation of one subject surface, where several selfintersections were highlighted with arrows. In Fig. 16(c), we also show the projection of the mesh structure from the group-wise atlas in Fig. 13 to the same subject with our method. Clearly there is no self-intersection. The histogram of the number of self-intersections in the 109 hippocampal shapes computed by ShapeWorks was plotted in Fig. 16(d), which shows that this is a general problem for particle-based optimization in ShapeWorks. The same test of self-intersection was also applied to all 109 mapped surfaces computed by our method and no self-intersection was detected.
Figure 16.
Non-diffeomorphic mapping results from ShapeWorks. (a) Mesh representation of the mean shape from ShapeWorks results. (b) Self-intersections of one subject shape. (c) The projected mesh structure from the group-wise atlas to the same subject with our method. (d) Histogram of self-intersections in all 109 ShapeWorks mapping results.
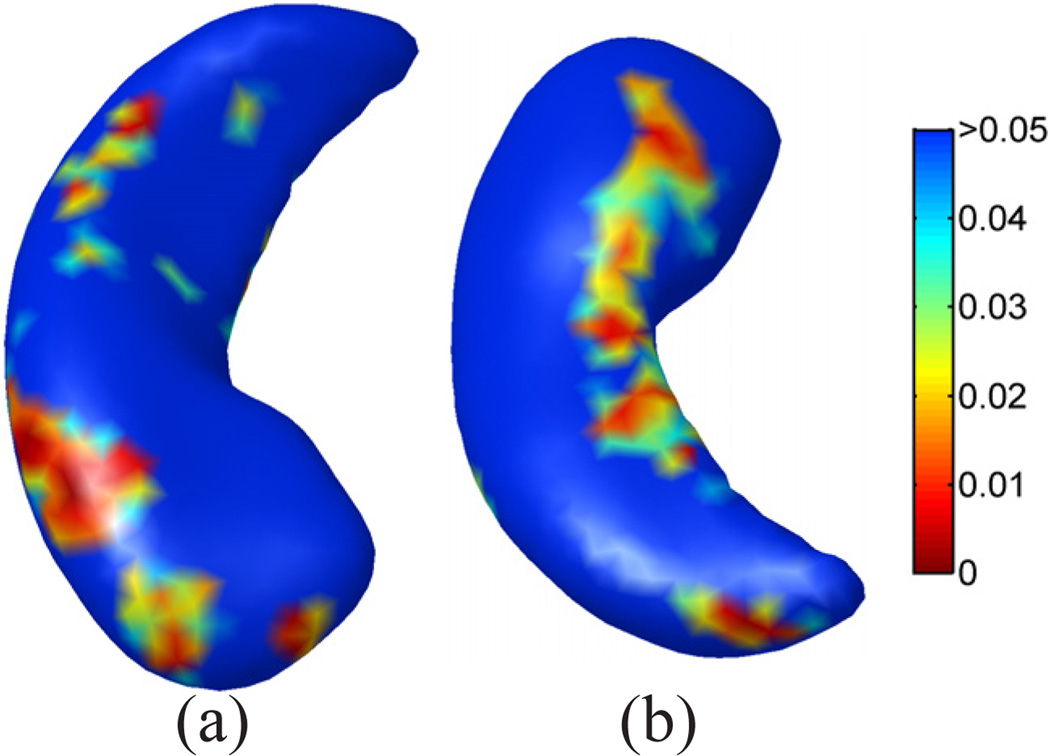
For thickness-based statistical analysis, we projected the particles of each subject surface onto the corresponding mesh used in our experiment to pull back the thickness with linear interpolation. After that, the same statistical analysis can be applied to every particle to test for group differences. To visualize the results, we plotted the p-value map on the mean shape in Fig. 17(a) and (b). To correct for multiple comparisons, we also applied 10,000 permutations to the ShapeWorks mapping results and an overall p-value of 0.042 is achieved, so the map in Fig.17 reaches significance. On the other hand, the p-value map generated by our method, as shown in Fig. 14, not only reaches a higher level of significance from permutation tests, but also shows more continuity in regions with highly significant p-values. This is especially obvious from the inferior view of map shown in Fig. 14(b) and Fig. 17(b). More quantitatively, there are only 2.9% particles in Fig. 14 that have a p-value below 0.01, but 6.1% points with p-values below 0.01 in our map in Fig. 14. Overall we can see that our method has the advantage of being able to compute high quality surface maps with no self-intersection, and can produce more significant p-value maps for this hippocampal study. On the other hand, we have to be cautious in interpreting the results when comparing the p-value maps because no ground truth is available about the hippocampal atrophy. For this study, we used correlation with CES-D scores shown in Fig. 14 (c) and (d) as a simple way of testing whether the detected shape differences are clinically interpretable. To obtain ground truths about neuronal loss in hippocampus, however, would require data from postmortem histological studies. This is future work of great value to medical shape analysis research.
Figure 17.
The mapping results from ShapeWorks for comparisons with our method. (a) Superior view. (b) Inferior view.
VI. Discussion and Conclusions
In this paper, we developed a novel approach for the mapping of neuroanatomical surfaces based on their intrinsic geometry. By optimizing a conformal metric, our method minimizes a distance measure in the LB embedding space and generates conformal maps directly between anatomical surfaces with highly regular metric distortion. This metric optimization technique has also been generalized to the construction of group-wise surface atlas in the embedding space and used for cortical label fusion and population studies. We demonstrated the robustness and generality of our method by successfully applying it to map cortical and hippocampal surfaces in two brain mapping studies.
In this work, we focused on unidirectionally warping the metric of a single surface to minimize its distance to a target surface or a group of surfaces in the LB embedding space, but the techniques developed in this paper can be extended to simultaneous warping of the metrics on two or multiple surfaces with a slight modification to the algorithm described in Table I. Instead of running Step 2 of the algorithm only for one surface, we only need to repeat it for each surface with the metric and embedding of the other surfaces fixed. As an example, we show in Fig. 18 the optimized metrics for the two hippocampal surfaces in Fig. 7 after this modification. By comparing the metrics on the two surfaces in Fig. 18(a) and (b), we can see intuitively they complement each other throughout the surfaces. More specifically, in regions where the first surface ℳ1 expands with the increase of its metric, the second surface ℳ2 works cooperatively by decreasing its metric at corresponding locations. From a transitivity point of view, this symmetric warping process is equivalent to establishing the map between ℳ1 and ℳ2 by going through a middle surface ℳo in the embedding space. Compared with the results in Fig. 7, we found numerically that the distances of corresponding vertices of the unidirectional and symmetric mapping results are around 12% of the average edge length of the surfaces. This shows the transitivity error is almost an order of magnitude below the resolution of the mesh representation of the surfaces. The symmetric warping process could be viewed as a way of computing the mean shape of two surfaces in the embedding space. For future work, we will study the extension of our algorithm to the simultaneous warping of multiple surfaces. This could lead to new ways of computing group-wise atlases in the LB embedding space.
Figure 18.
Results from simultaneous metric optimization for the mapping of two hippocampal surfaces. (a) Optimized metric on ℳ1 (b) Optimized metric on ℳ2.
One important direction in our future work is to improve the computational speed of our algorithm. The bottleneck of the metric optimization process is the calculation of the eigen-derivatives. We will investigate coordinated descent strategies to cycle through a different set of vertices at each iteration to reduce the number of eigen-derivatives to be computed. We will also study new ways of representing the weight function to reduce its dimension, and thus the computational burden on eigen-derivative evaluation.
For cortical label fusion, we used a weighted voting approach in our current work. For further improvement, we could incorporate smoothness regularization for better regularity of region boundaries. More interestingly, we plan to introduce the novel fusion strategy proposed recently in [54] to our labeling system and investigate whether it will further improve the performance of automated cortical labeling.
For future work, we will also conduct more extensive validation of our algorithm on the mapping of other subcortical surfaces extracted from T1-weighted MR images. The extension of the mapping algorithm for the analysis of fiber bundles extracted from diffusion MR images will be an interesting direction. Besides intrinsic geometry, we will also explore the integration of multi-modal measures with the LB embedding for more accurate mapping of brain anatomy.
Acknowledgments
This work was in part supported by the National Institute of Health (NIH) under Grant K01EB013633, P41EB015922, RO1MH080892 and National MS Society under grant RG4752-A-3.
Appendix
Gradient of eigen-values and eigen-functions
The generalized eigen-function problem is
| (18) |
where Ū denotes the matrix U(w) in (9). Following the algorithm proposed in [55], we describe here how to compute the derivative of the eigenvalues and eigen-functions with respect to the weight w.
Let λi and fi denote the i-th eigenvalue and eigen-function, we can compute the derivative on both sides of the above equation as:
| (19) |
where Q is independent of wj. From the above equation, we have
| (20) |
Pre-multiplying both sides with , we obtain
| (21) |
because and .
Let . To compute the derivative of the eigen-function, we then need to solve
| (22) |
Because Q − λiŪ is singular, this equation is under-determined. To address this problem, Nelson proposed to write
| (23) |
and we obtain
| (24) |
which is still under-determined. To fix this problem, we can fix the p-th component of uij to be zero, where p is the index of the component that has the largest magnitude in fi. This is realized by setting the p-th component of Fi as zero and the p-th row and column of (Q − λiŪ) as zero except the diagonal term, which is set to one. The equation becomes
| (25) |
where [Fi]1 is the 1 to (p − 1)-th components of Fi, and [Fi]2 is the p + 1 to the end of the vector Fi. This problem is non-singular given the assumption that there is no multiplicity at λi [55]. We can solve it and obtain μij.
Using the condition that , we obtain
| (26) |
Substituting the expression into the above equation, we get
| (27) |
This completes the solution for .
Contributor Information
Yonggang Shi, Laboratory of Neuro Imaging, Institute for Neuroimaging and Informatics, Keck School of Medicine of University of Southern California, Los Angeles, CA 90033, USA (yshi@loni.usc.edu)..
Rongjie Lai, Department of Mathematics, University of California at Irvine, Irvine, CA 92697, USA (rongjiel@math.uci.edu).
Danny J.J. Wang, Ahmanson-Lovelace Brain Mapping Center, Department of Neurology, UCLA School of Medicine, Los Angeles, CA 90095, USA (jwang71@gmail.com).
Daniel Pelletier, Department of Neurology, Yale School of Medicine, New Haven, CT, USA (daniel.pelletier@yale.edu).
David Mohr, Department of Preventive Medicine, Northwestern University, Feinberg School of Medicine, Chicago, IL, USA (dmohr@northwestern.edu).
Nancy Sicotte, Cedar Sinai Medical Center, Los Angeles, CA, USA (Nancy.Sicotte@cshs.org).
Arthur W. Toga, Laboratory of Neuro Imaging, Institute for Neuroimaging and Informatics, Keck School of Medicine of University of Southern California, Los Angeles, CA 90033, USA (toga@loni.usc.edu).
REFERENCES
- 1.Van Essen DC, Drury HA, Joshi S, Miller MI. Functional and structural mapping of human cerebral cortex: solutions are in the surfaces. Proc. Natl. Acad. Sci. USA. 1998;95:788–795. doi: 10.1073/pnas.95.3.788. [DOI] [PMC free article] [PubMed] [Google Scholar]
- 2.Fischl B, Sereno MI, Dale AM. Cortical surface-based analysis ii: Inflation, flattening, and a surface-based coordinate system. NeuroImage. 1999;9(no. 2):195–207. doi: 10.1006/nimg.1998.0396. [DOI] [PubMed] [Google Scholar]
- 3.Thompson PM, Hayashi KM, de Zubicaray GI, Janke AL, Rose SE, Semple J, Herman DH, Hong MS, Dittmer SS, Doddrell DM, Toga AW. Dynamics of gray matter loss in Alzheimers disease. J. Neurosci. 2003;23(no. 3):994–1005. doi: 10.1523/JNEUROSCI.23-03-00994.2003. [DOI] [PMC free article] [PubMed] [Google Scholar]
- 4.Thompson PM, Hayashi KM, de Zubicaray GI, Janke AL, Rose SE, Semple J, Hong MS, Herman DH, Gravano D, Doddrell DM, Toga AW. Mapping hippocampal and ventricular change in Alzheimer disease. NeuroImage. 2004;22(no. 4):1754–1766. doi: 10.1016/j.neuroimage.2004.03.040. [DOI] [PubMed] [Google Scholar]
- 5.Shaw P, Greenstein D, Lerch J, Clasen L, Lenroot R, Gogtay N, Evans A, Rapoport J, Giedd J. Intellectual ability and cortical development in children and adolescents. Nature. 2006;440:676–679. doi: 10.1038/nature04513. [DOI] [PubMed] [Google Scholar]
- 6.Schwartz EL, Shaw A, Wolfson E. A numerical solution to the generalized mapmaker’s problem: flattening nonconvex polyhedral surfaces. IEEE Trans. Pattern Anal. Machine Intell. 1989;11(no. 9):1005–1008. [Google Scholar]
- 7.Haker S, Angenent S, Tannenbaum A, Kikinis R, Sapiro G, Halle M. Conformal surface parameterization for texture mapping. IEEE Trans. Visualization and Computer Graphics. 2000;6(no. 2):181–189. [Google Scholar]
- 8.Hurdal MK, Stephenson K. Cortical cartography using the discrete conformal approach of circle packings. NeuroImage. 2004;23:S119–S128. doi: 10.1016/j.neuroimage.2004.07.018. [DOI] [PubMed] [Google Scholar]
- 9.Gu X, Wang Y, Chan TF, Thompson PM, Yau ST. Genus zero surface conformal mapping and its application to brain surface mapping. IEEE Trans. Med. Imag. 2004;23(no. 8):949–958. doi: 10.1109/TMI.2004.831226. [DOI] [PubMed] [Google Scholar]
- 10.Joshi A, Shattuck D, Thompson P, Leahy R. Cortical surface parameterization by p-harmonic energy minimization. Proc. ISBI. 2004;1:428–431. doi: 10.1109/ISBI.2004.1398566. [DOI] [PMC free article] [PubMed] [Google Scholar]
- 11.Yeo B, Sabuncu M, Vercauteren T, Ayache N, Fischl B, Golland P. Spherical demons: Fast diffeomorphic landmark-free surface registration. IEEE Trans. Med. Imag. 2010;29(no. 3):650–668. doi: 10.1109/TMI.2009.2030797. [Online]. Available: https://sites.google.com/site/yeoyeo02/software/ [DOI] [PMC free article] [PubMed] [Google Scholar]
- 12.Tosun D, Prince J. A geometry-driven optical flow warping for spatial normalization of cortical surfaces. IEEE Trans. Med. Imag. 2008;27(no. 12):1739–1753. doi: 10.1109/TMI.2008.925080. [DOI] [PMC free article] [PubMed] [Google Scholar]
- 13.Davies RH, Twining CJ, Cootes TF, Taylor CJ. Building 3-D statistical shape models by direct optimization. IEEE Trans. Med. Imag. 2010;29(no. 4):961–981. doi: 10.1109/TMI.2009.2035048. [DOI] [PubMed] [Google Scholar]
- 14.Wang Y, Shi J, Yin X, Gu X, Chan T, Yau S-T, Toga A, Thompson P. Brain surface conformal parameterization with the Ricci flow. IEEE Trans. Med. Imag. 2012;31(no. 2):251–264. doi: 10.1109/TMI.2011.2168233. [DOI] [PMC free article] [PubMed] [Google Scholar]
- 15.Shi Y, Thompson PM, de Zubicaray G, Rose SE, Tu Z, Dinov I, Toga AW. Direct mapping of hippocampal surfaces with intrinsic shape context. NeuroImage. 2007;37(no. 3):792–807. doi: 10.1016/j.neuroimage.2007.05.016. [DOI] [PMC free article] [PubMed] [Google Scholar]
- 16.Shi Y, Morra J, Thompson PM, Toga AW. Inverse-consistent surface mapping with Laplace-Beltrami eigen-features. Proc. IPMI. 2009:467–478. doi: 10.1007/978-3-642-02498-6_39. [DOI] [PMC free article] [PubMed] [Google Scholar]
- 17.Reuter M, Wolter F, Peinecke N. Laplace-Beltrami spectra as Shape-DNA of surfaces and solids. Computer-Aided Design. 2006;38:342–366. [Google Scholar]
- 18.Qiu A, Bitouk D, Miller MI. Smooth functional and structural maps on the neocortex via orthonormal bases of the Laplace-Beltrami operator. IEEE Trans. Med. Imag. 2006;25(no. 10):1296–1306. doi: 10.1109/tmi.2006.882143. [DOI] [PubMed] [Google Scholar]
- 19.Rustamov RM. Laplace-beltrami eigenfunctions for deformation invariant shape representation. Eurographics Symposium on Geometry Processing (SGP) 2007:225–233. [Google Scholar]
- 20.Niethammer M, Reuter M, Wolter F-E, Bouix S, Peinecke N, Koo M-S, Shenton ME. Global medical shape analysis using the Laplace-Beltrami spectrum. Proc. MICCAI. 2007:850–857. doi: 10.1007/978-3-540-75757-3_103. [DOI] [PMC free article] [PubMed] [Google Scholar]
- 21.Vallet B, Lévy B. Spectral geometry processing with manifold harmonics. Computer Graphics Forum. 2008;27(no. 2):251–260. [Google Scholar]
- 22.Shi Y, Lai R, Krishna S, Sicotte N, Dinov I, Toga A. Anisotropic Laplace-Beltrami eigenmaps: Bridging Reeb graphs and skeletons. Proc. MMBIA. 2008:1–7. doi: 10.1109/CVPRW.2008.4563018. [DOI] [PMC free article] [PubMed] [Google Scholar]
- 23.Lai R, Shi Y, Dinov I, Chan TF, Toga AW. Laplace-beltrami nodal counts: a new signature for 3D shape analysis. Proc. ISBI. 2009:694–697. doi: 10.1109/ISBI.2009.5193142. [DOI] [PMC free article] [PubMed] [Google Scholar]
- 24.Lai R, Shi Y, Scheibel K, Fears S, Woods R, Toga A, Chan T. Metric-induced optimal embedding for intrinsic 3D shape analysis. Proc. CVPR. 2010:2871–2878. [Google Scholar]
- 25.Shi Y, Lai R, Morra J, Dinov I, Thompson P, Toga A. Robust surface reconstruction via Laplace-Beltrami eigen-projection and boundary deformation. IEEE Trans. Med. Imag. 2010;29(no. 12):2009–2022. doi: 10.1109/TMI.2010.2057441. [DOI] [PMC free article] [PubMed] [Google Scholar]
- 26.Shi Y, Lai R, Toga A. Cortical surface reconstruction via unified Reeb analysis of geometric and topological outliers in magnetic resonance images. IEEE Trans. Med. Imag. 2013;(no. 3):511–530. doi: 10.1109/TMI.2012.2224879. [DOI] [PMC free article] [PubMed] [Google Scholar]
- 27.Lombaert H, Sporring J, Siddiqi K. Diffeomorphic spectral matching of cortical surfaces. Proc. IPMI. 2013:376–389. doi: 10.1007/978-3-642-38868-2_32. [DOI] [PubMed] [Google Scholar]
- 28.Konukoglu E, Glocker B, Criminisi A, Pohl KM. WESD–weighted spectral distance for measuring shape dissimilarity. IEEE Trans. Pattern Anal. Machine Intell. 2013;35(no. 9):2284–2297. doi: 10.1109/TPAMI.2012.275. [DOI] [PMC free article] [PubMed] [Google Scholar]
- 29.Shi Y, Sun B, Lai R, Dinov I, Toga A. Automated sulci identification via intrinsic modeling of cortical anatomy. Proc. MICCAI. 2010:49–56. doi: 10.1007/978-3-642-15711-0_7. [DOI] [PMC free article] [PubMed] [Google Scholar]
- 30.Fischl B, van der Kouwe A, Destrieux C, Halgren E, Sagonne F, Salat DH, Busa E, Seidman LJ, Goldstein J, Kennedy D, Caviness V, Makris N, Rosen B, Dale AM. Automatically parcellating the human cerebral cortex. Cerebral Cortex. 2004;14(no. 1):11–22. doi: 10.1093/cercor/bhg087. [DOI] [PubMed] [Google Scholar]
- 31.Jain V, Zhang H. Robust 3d shape correspondence in the spectral domain; Shape Modeling and Applications, 2006. SMI 2006. IEEE International Conference on; 2006. pp. 19–19. [Google Scholar]
- 32.Mateus D, Horaud R, Knossow D, Cuzzolin F, Boyer E. Articulated shape matching using laplacian eigenfunctions and unsupervised point registration; Computer Vision and Pattern Recognition, 2008. CVPR 2008. IEEE Conference on; 2008. pp. 1–8. [Google Scholar]
- 33.Lombaert H, Grady L, Polimeni JR, Cheriet F. FOCUSR: Feature oriented correspondence using spectral regularization–a method for precise surface matching. IEEE Trans. Pattern Anal. Machine Intell. 2013;35(no. 9):2143–2160. doi: 10.1109/TPAMI.2012.276. [DOI] [PMC free article] [PubMed] [Google Scholar]
- 34.Zeng W, Samaras D, Gu X. Ricci flow for 3D shape analysis. IEEE Trans. Pattern Anal. Machine Intell. 2010;32(no. 4):662–677. doi: 10.1109/TPAMI.2009.201. [DOI] [PubMed] [Google Scholar]
- 35.Shi Y, Lai R, Toga AW. Conformal mapping via metric optimization with application for cortical label fusion. Proc. IPMI. 2013:244–255. doi: 10.1007/978-3-642-38868-2_21. [DOI] [PMC free article] [PubMed] [Google Scholar]
- 36.Rustamov RM. Laplace-beltrami eigenfunctions for deformation invariant shape representation. Proc. Eurograph. Symp. on Geo. Process. 2007:225–233. [Google Scholar]
- 37.Uhlenbeck K. Generic properties of eigenfunctions. Amer. J. of Math. 1976;98(no. 4):1059–1078. [Google Scholar]
- 38.Silvester PP, Ferrari RL. Finite Elements for Electrical Engineers. Cambridge University Press; 1996. [Google Scholar]
- 39.Joshi S, Davis B, Jomier M, Gerig G. Unbiased diffeomorphic atlas construction for computational anatomy. NeuroImage. 2004;23(Supplement 1)(no. 0):S151–S160. doi: 10.1016/j.neuroimage.2004.07.068. [DOI] [PubMed] [Google Scholar]
- 40.Sabuncu M, Balci S, Shenton M, Golland P. Image-driven population analysis through mixture modeling. Medical Imaging, IEEE Transactions on. 2009;28(no. 9):1473–1487. doi: 10.1109/TMI.2009.2017942. [DOI] [PMC free article] [PubMed] [Google Scholar]
- 41.Wu G, Jia H, Wang Q, Shen D. Sharpmean: Groupwise registration guided by sharp mean image and tree-based registration. NeuroImage. 2011;56(no. 4):1968–1981. doi: 10.1016/j.neuroimage.2011.03.050. [DOI] [PMC free article] [PubMed] [Google Scholar]
- 42.Wan J, Carass A, Resnick S, Prince J. Automated reliable labeling of the cortical surface. Proc. ISBI. 2008:440–443. doi: 10.1109/isbi.2008.4541027. [DOI] [PMC free article] [PubMed] [Google Scholar]
- 43.Rohlfing T, Brandt R, Menzel R, RM C., Jr Evaluation of atlas selection strategies for atlas-based image segmentation with application to confocal microscopy images of bee brains. NeuroImage. 2004;21(no. 4):1428–1442. doi: 10.1016/j.neuroimage.2003.11.010. [DOI] [PubMed] [Google Scholar]
- 44.Sabuncu M, Yeo B, Van Leemput K, Fischl B, Golland P. A generative model for image segmentation based on label fusion. IEEE Trans. Med. Imag. 2010;29(no. 10):1714–1729. doi: 10.1109/TMI.2010.2050897. [DOI] [PMC free article] [PubMed] [Google Scholar]
- 45.Wang H, Suh J, Das S, Pluta J, Craige C, Yushkevich P. Multiatlas segmentation with joint label fusion. IEEE Trans. Pattern Anal. Machine Intell. 2012;35(no. 3):611–623. doi: 10.1109/TPAMI.2012.143. [DOI] [PMC free article] [PubMed] [Google Scholar]
- 46.Kimmel R, Sethian JA. Computing geodesic paths on manifolds. Proc. Natl. Acad. Sci. USA. 1998;95(no. 15):8431–8435. doi: 10.1073/pnas.95.15.8431. [DOI] [PMC free article] [PubMed] [Google Scholar]
- 47.Shattuck D, Mirza M, Adisetiyo V, Hojatkashani C, Salamon G, Narr K, Poldrack R, Bilder R, Toga A. Construction of a 3D probabilistic atlas of human brain structures. NeuroImage. 2008;39(no. 3):1064–1080. doi: 10.1016/j.neuroimage.2007.09.031. [DOI] [PMC free article] [PubMed] [Google Scholar]
- 48.Gogtay N, Giedd JN, Lusk L, Hayashi KM, Greenstein D, Vaituzis AC, Nugent TF, Herman DH, Clasen LS, Toga AW, Rapoport JL, Thompson PM. Dynamic mapping of human cortical development during childhood through early adulthood. PNAS. 2004;101(no. 21):8174–8179. doi: 10.1073/pnas.0402680101. [DOI] [PMC free article] [PubMed] [Google Scholar]
- 49.Patenaude B, Smith SM, Kennedy DN, Jenkinson M. A bayesian model of shape and appearance for subcortical brain segmentation. NeuroImage. 2011;56(no. 3):907–922. doi: 10.1016/j.neuroimage.2011.02.046. [DOI] [PMC free article] [PubMed] [Google Scholar]
- 50.Peyré G, Cohen L. Geodesic remeshing using front propagation. International Journal of Computer Vision. 2006;69(no. 1):145–156. [Google Scholar]
- 51.Brechbühler C, Gerig G, Kübler O. Parameterization of closed surfaces for 3-D shape description. CVGIP: Image Understanding. 1995;61(no. 2):154–170. [Google Scholar]
- 52.Styner M, Oguz I, Xu S, Brechbühler C, Pantazis D, Levitt J, Shenton M, Gerig G. Framework for the statistical shape analysis of brain structures using spharm-pdm. Open Science Workshop at MICCAI. The Insight Journal, 2006. [Online]. Available: http://hdl.handle.net/1926/215. [PMC free article] [PubMed] [Google Scholar]
- 53.Cates J, Fletcher P, Styner M, Shenton M, Whitaker R. Shape modeling and analysis with entropy-based particle systems. Proc. IPMI. 2007:333–345. doi: 10.1007/978-3-540-73273-0_28. [DOI] [PMC free article] [PubMed] [Google Scholar]
- 54.Wang H, Suh J, Das S, Pluta J, Craige C, Yushkevich P. Multiatlas segmentation with joint label fusion. IEEE Trans. Pattern Anal. Machine Intell. 2013;35(no. 3):611–623. doi: 10.1109/TPAMI.2012.143. [DOI] [PMC free article] [PubMed] [Google Scholar]
- 55.Nelson R. Simplified calculation of eigenvector derivatives. AIAA Journal. 1976;14(no. 9):1201–1205. [Google Scholar]


