Abstract
Cortical slow oscillations occur in the mammalian brain during deep sleep and have been shown to contribute to memory consolidation, an effect that can be enhanced by electrical stimulation. As the precise underlying working mechanisms are not known it is desired to develop and analyze computational models of slow oscillations and to study the response to electrical stimuli. In this paper we employ the conductance based model of Compte et al. (J Neurophysiol 89:2707–2725, 2003) to study the effect of electrical stimulation. The population response to electrical stimulation depends on the timing of the stimulus with respect to the state of the slow oscillation. First, we reproduce the experimental results of electrical stimulation in ferret brain slices by Shu et al. (Nature 423:288–293, 2003) from the conductance based model. We then numerically obtain the phase response curve for the conductance based network model to quantify the network’s response to weak stimuli. Our results agree with experiments in vivo and in vitro that show that sensitivity to stimulation is weaker in the up than in the down state. However, we also find that within the up state stimulation leads to a shortening of the up state, or phase advance, whereas during the up–down transition a prolongation of up states is possible, resulting in a phase delay. Finally, we compute the phase response curve for the simple mean-field model by Ngo et al. (EPL Europhys Lett 89:68002, 2010) and find that the qualitative shape of the PRC is preserved, despite its different mechanism for the generation of slow oscillations.
Keywords: Sleep, Cortex, Phase response, Slow oscillation, Synchronization
Introduction
During the deep sleep stages S3/S4 of mammalian sleep the electroencephalogram (EEG) exhibits large amplitude oscillations at frequencies of 1 Hz and below (Contreras and Steriade 1995). These so-called slow oscillations are a phenomenon with a much slower time scale than that of a single spiking neuron and reflect the alternation of periods of activity and silence of large neuronal populations. Cortical slow waves not only manifest an interesting dynamical phenomenon on its own, but also have been shown to significantly contribute to memory consolidation in humans and other mammals (Diekelmann and Born 2010; Marshall et al. 2006; Stickgold 2005). A consequent and appealing approach is therefore to enhance sleep slow waves by stimulation techniques with the goal of enhancing the consolidating effect on memories (Marshall et al. 2004; Massimini et al. 2007). Therefore a more detailed understanding of the underlying dynamical mechanisms is desired to further develop stimulation techniques.
Networks of neurons often exhibit collective oscillations (Brunel 2000; Gray et al. 1989; Jirsa 2008), during which single neurons spike irregularly (Hájos et al. 2004). The collective dynamics are periodic though and one can treat the network as one large oscillator (Akam et al. 2012; Grannan et al. 1993). The cortical slow oscillation shows high temporal regularity in ferret brain slices and in rat auditory cortex under deep anesthesia (Deco et al. 2009; Mattia and Sanchez-Vives 2012; Sanchez-Vives and McCormick 2000) and can thus be characterized by a phase response curve (PRC).
In this paper we obtain, based on computational models, predictions for the PRC of the cortical slow oscillation for a wide range of stimulus strengths. The PRC is a map that describes how an oscillating system responds to perturbations (Granada et al. 2009) and can easily be measured experimentally. Phase models have a long tradition and were successfully applied to study the interaction of coupled oscillators (Kuramoto 2003; Tass 1999; Winfree 2001). More recently phase response curves were used to characterize synchronization between cortex and thalamus during epileptic seizures (Perez Velazquez et al. 2007) and dentate gyrus—CA3 coupling in the hippocampus (Akam et al. 2012).
Knowing the PRC one has a valuable tool to analyse the influence of external stimulation, e.g. electric, magnetic or sensory stimulation, on cortical sleep rhythms and also to investigate the interaction of the sleeping cortex with other brain structures, like hippocampus and thalamus. These interactions are assumed to be of substantial relevance for memory consolidation and transfer of memories between brain regions (Peyrache et al. 2009).
Up and down states that comprise the slow oscillation during mammalian sleep seem to be a robust dynamical phenomenon across species and also across cortical brain regions (Amzica and Steriade 1998; MacLean et al. 2005; Sanchez-Vives et al. 2008). Therefore one would conjecture that models for slow oscillations as well as models for their stimulation should not crucially depend on model details—albeit one has to specify a working model and its parameters for computational studies.
This paper is organized as follows. In Sect. 2 we demonstrate that the network model introduced by Compte et al. (2003) is capable of reproducing the experimental results of Shu et al. (2003). Second, we build on this result and argue that this model is a suitable candidate to predict the response to weaker stimuli. We present phase response and phase transition curves for Type 1 (weak) and Type 0 (strong) resetting as well as for intermediate stimulus intensities that serve as predictions for experiments. Third, we obtain the infinitesimal PRC from the mean-field model by Ngo et al. (2010), a minimal model for up–down state dynamics. We find that the network model and the mean-field model yield qualitatively similar results.
Network model reproduces characteristic delay of up–down transition upon stimulation
In this section we show that the network model introduced by Compte et al. (2003) is capable of qualitatively reproducing the experiment of Shu et al. (2003). Shu and colleagues showed that cortical activity can be switched on and off externally with excitatory stimuli. In their experiment two short current pulses of same polarity where applied to ferret brain slices exhibiting spontaneous slow oscillations. The second pulse was applied during the evoked up state and would lead to a termination of the up state after a certain delay. That delay was consistent across trials and depended strongly on the stimulus amplitude and the actual interstimulus interval.
The network model is conductance based and exhibits up–down state dynamics as were observed in ferret brain slices in vitro (Sanchez-Vives and McCormick 2000). The model proved its usefulness in recent studies (Fröhlich and McCormick 2010; Sanchez-Vives et al. 2008; 2010). All details of the model can be found in the original paper (Compte et al. 2003). We restate the full equations in Appendix. In the following we only want to state some of its main features. The system contains 80 % regular spiking pyramidal neurons and 20 % fast spiking interneurons. The pyramidal neurons possess two compartments and show spike frequency adaptation when seeing a constant injected current. Pyramidal neurons are all excitatory and connect via AMPA and NMDA type synapses. Inhibitory connections are only formed via GABAA synapses. The transition from the down to the up state is caused by spontaneously firing pyramidal neurons and recurrent excitation. Importantly, the model does not require noise to switch between up and down states and exhibits self sustained activity without external drive. The mechanism for the termination of up states is the activity dependent build up of inhibitory currents during the up state. This occurs via a sodium dependent potassium channel whose activation increases with each spike. The original model uses 1,280 neurons in total. However, one can reduce the size of the system without changing the overall dynamics, if one also scales down the range of the synaptic connections accordingly. We compared the behavior of the system for different sizes and found no significant differences. We therefore chose to work with a system size of only 320 neurons, because of the large number of simulations necessary for the results presented in this paper.
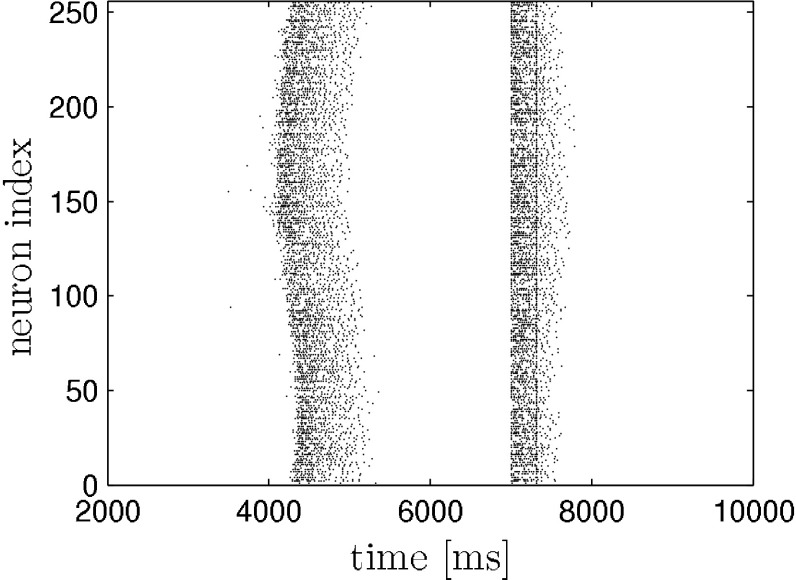
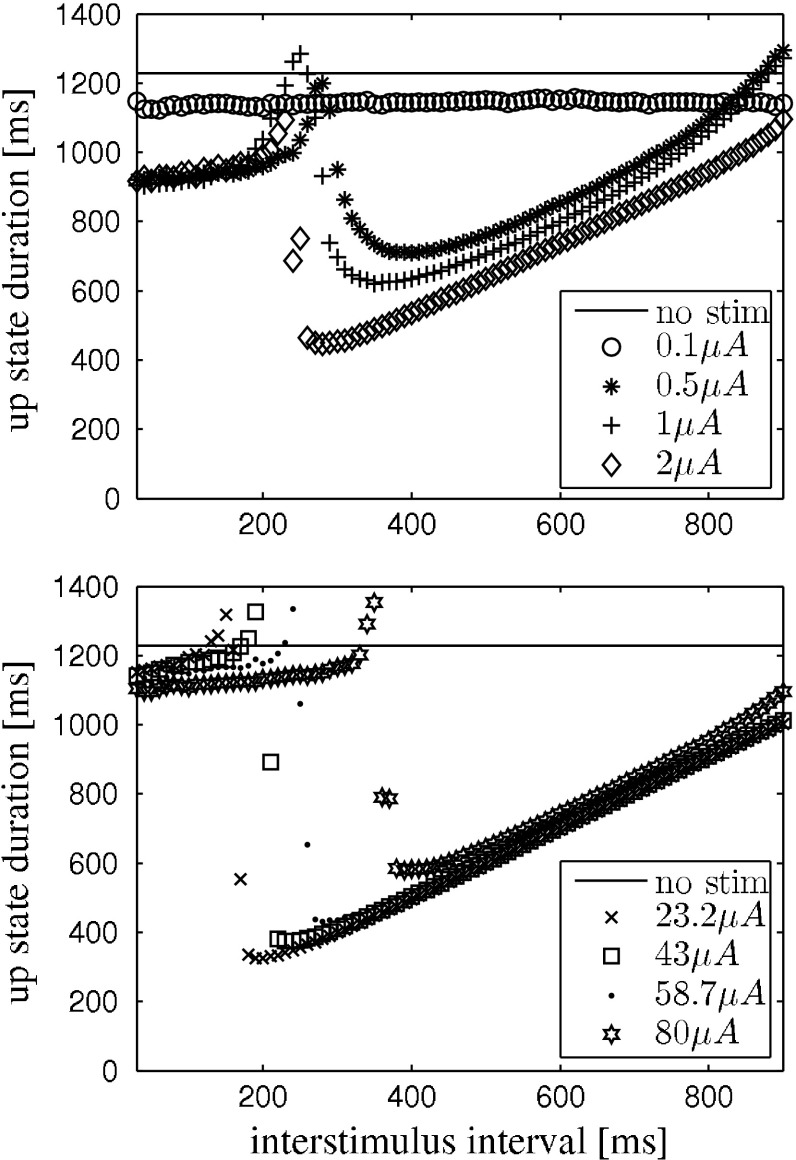
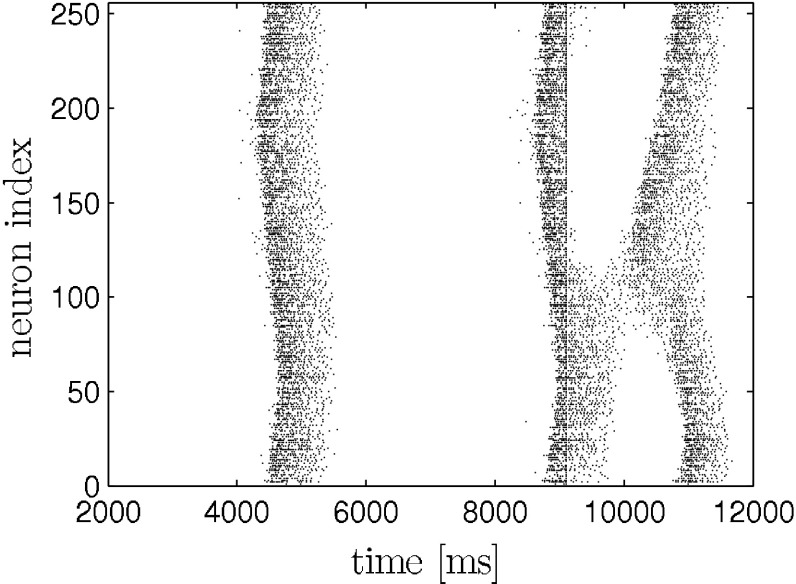
The network is stimulated two times with depolarizing current pulses of same polarity, intensity and duration. The pulses are applied to all neurons in the network at the same time. The pulse duration is 10 ms. The first stimulus is applied during the hyperpolarization phase inbetween two otherwise self-generated up states. We implicitly assume that the external stimulation with electric shocks translates into a transmembrane current that equally effects pyramidal neurons and interneurons. We also point out that stimulating all neurons is in contrast to the experiment, where the stimulation was applied locally. The protocol is illustrated in the raster plot (model data) in Fig. 1. We applied the above stimulation protocol to the network model and yield a similar dependence of up state duration on stimulus amplitude and interstimulus interval. This is depicted in Fig. 2. For comparison please see (Shu et al. 2003).
Fig. 1.
Response of neural network to two consecutive strong stimuli (ISI = 310 ms, I s = 1 μA) as in (Shu et al. 2003). The first stimulus causes an immediate transition from the down to the up state. The following second stimulus (straight line within second up state) determines the remaining time the system spends in the up state. It causes a massive influx of calcium which in turn activates the inhibiting I KCa (not shown) that then leads to the termination of the up state. Only pyramidal neurons are shown. The stimuli are applied to each neuron in the network
Fig. 2.
Qualitative reproduction of the experimental results reported by Shu et al. (2003) with the network model. Data points are the average of 5 trials. Two depolarizing stimuli, separated by the interstimulus interval, where applied, see Fig. 1. The peaks just before the transition to shorter up state durations that are visible in every curve are an artifact stemming from a heterogenous network response like the one shown in Fig. 7. Top weak stimuli, e.g. I s = 0.1 μA, that already cause strong resetting only reduce the up state duration, independent of phase. Increasing the stimulus strength reduces the up state more the more the two stimuli are apart, until the second stimulus directly terminates an up state. For certain stimulus strengths the second stimulus ends an up state immediately for almost all interstimulus intervals. Bottom in our simulations it was possible to evoke up state like network behavior also with very high stimulus strengths. This was different from mere after spiking. The higher the stimulus strength was the larger the interstimulus interval had to be in order to reduce up state durations. This reversed tendency is not covered by (Shu et al. 2003) and remains to be tested experimentally
The protocol for obtaining a PRC is very similar to paired pulse stimulation. Hence, if a model reproduces the response to a paired stimulus protocol it is likely that one can obtain the biologically realistic PRC from it. Our simulations show that the experimental results obtained by (Shu et al. 2003) are in the strong resetting regime.
The slow oscillation’s PRC as indicated by network model and mean-field model
We now present PRCs of the network model introduced above for weak resetting (infinitesimal PRC), strong resetting and intermediate stimulus intensities. We compare the infinitesimal PRC of the network model with the infinitesimal PRC of the mean-field model (Fig. 5) introduced by Ngo et al. (2010). As in the network model the mechanism for terminating up states is the activity dependent build up of an inhibiting current. This is in contrast to rate models of the slow oscillation that are based on fluctuation-driven transitions between two stable fixed points (Deco et al. 2009; Ermentrout and Terman 2010; Mejias et al. 2010). Although the two models we used are of a different class and complexity they lead to PRCs with similar features. from the network model.
Fig. 5.
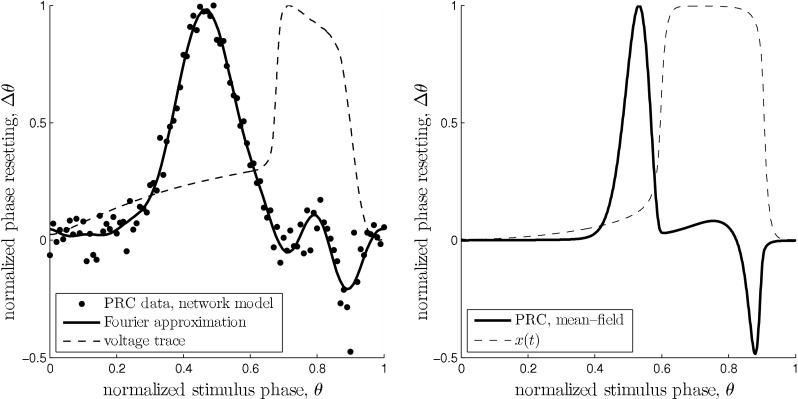
Comparison of the two estimates of the slow oscillation’s infinitesimal PRC. The dashed curves show the phase of the unperturbed oscillation in both plots and are in arbitrary units. Left: PRC of the network model for I = 19 nA. Black dots are from direct perturbation of the network at the respective phase θ. The solid curve is a Fourier approximation of the data points of order 7. The voltage trace was obtained by averaging one oscillation period over all pyramidal neurons and subsequent smoothing. Right: PRC of mean field model with  . The parameters where chosen to closely match the PRC of the network model. The model has a similar qualitative behavior over a wide range of parameters. In both models stimulation is ineffective right after an up state. It has the largest impact at the end of the down state right before the transition to the up state. Within the up state, stimulation initially leads to a phase advance, i.e. a reduced up state duration. During the following up–down transition a phase delay is possible resulting in a prolonged up state
Phase response of network model
A phase response curve quantifies the response of a periodically oscillating system to a perturbing stimulus at a given phase. We define the phase variable  as
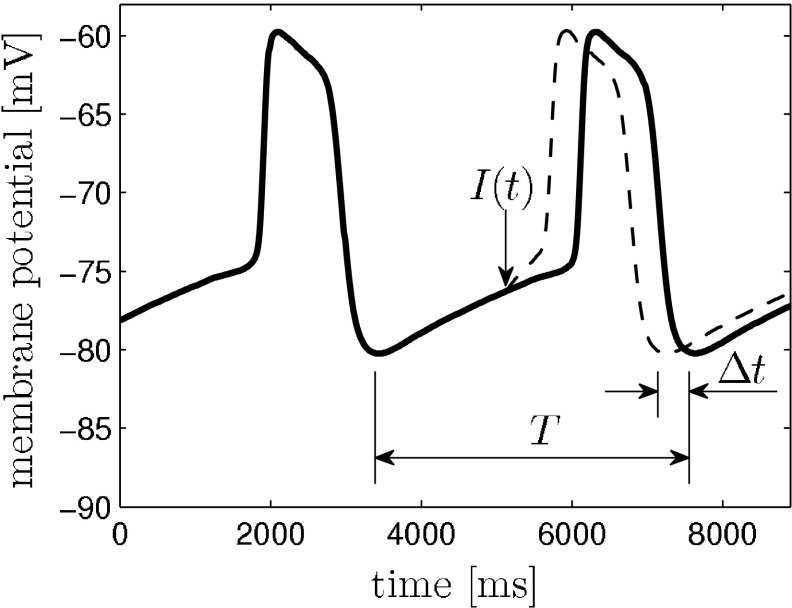
as  , where t denotes the elapsed time from the previous down state onset and T is the period of the network oscillation (Tsubo et al. 2007). This is illustrated in Fig. 3. Onsets of up and down states were determined from the voltage trace of single neurons with the MAUDS algorithm (Seamari et al. 2007). We define the ensemble phase of the network as the average phase of the individual neurons with respect to their down state onset. The phase reset
  is the phase difference between the perturbed and unperturbed neuron,
 |
1 |
where  is the new phase immediately after the perturbation and
  is the phase at which the stimulus was applied. Variables
  and T are as in Fig. 3. The new phase is calculated from the simulation data via
 |
2 |
with T being the oscillation period, td the beginning of the down state following the perturbation and ts the time when the perturbation is applied. The old phase  is (ts − t2)/T, where t2 is the beginning of the down state before the perturbing stimulus.
Fig. 3.
Definition of phase resetting in network model and mean-field model. The solid line is the membrane potential trace produced by the network model averaged over all pyramidal neurons and smoothed subsequently. The perturbation I(t) causes a phase reset that can delay or advance the oscillation (dashed line). We defined phases 0 and 1 to be the beginning of a down state/end of an up state. The phase reset is 
The PRC can be determined using conductance changes or current pulses as perturbation. It has been shown that both approaches are equivalent (Achuthan et al. 2010). We chose the latter option as it depends only on the intrinsic properties of a neuron. To obtain the PRC we calculated  and
and  of each pyramidal neuron for 50 different stimulus times. The perturbation is applied to all neurons at the same time but each neuron is in a slightly different phase with respect to the transition to its down state. We used nearest neighbor interpolation and transformed the data points
  to an equidistant grid θ with step size 1/50 to facilitate averaging. Finally, the ensemble phase is determined using the circular mean
  of the individual phases of pyramidal neurons in the network,
 |
3 |
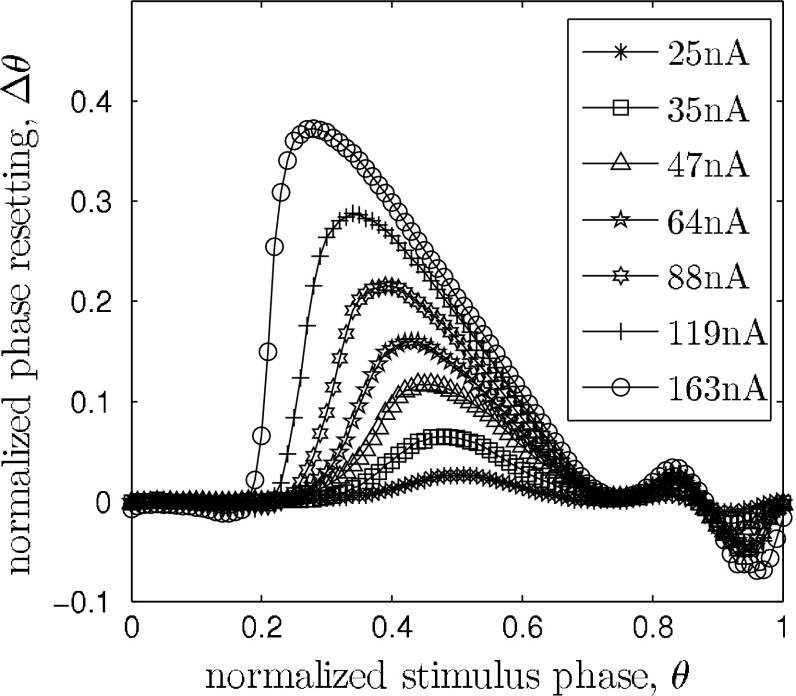
and the phase reset  is analog to 1. The infinitesimal PRC of the network model is depicted in Fig. 5 (left). It is renormalized to 1 for comparison with the mean-field model. For stimulus amplitudes up to 19 nA it scales linearly with stimulus amplitude. Figure 4 shows the PRC’s dependence on intermediate stimulus intensities. For intensities between 19 and 400 nA the PRC is still qualitatively similar to the infinitesimal PRC, but does not scale linearly with stimulus intensities anymore. For intensities above 400nA up states are evoked immediately. The up state duration shows a dependence on the stimulation phase but in this regime is largely independent of stimulus strength, as shown in Fig. 6.
Fig. 4.
Dependence of the network model’s PRC on stimulus strength I s. The PRC tilts to the left as the stimulus strength increases. Note that the phase resetting is only normalized to the oscillation period and not to I s
Fig. 6.
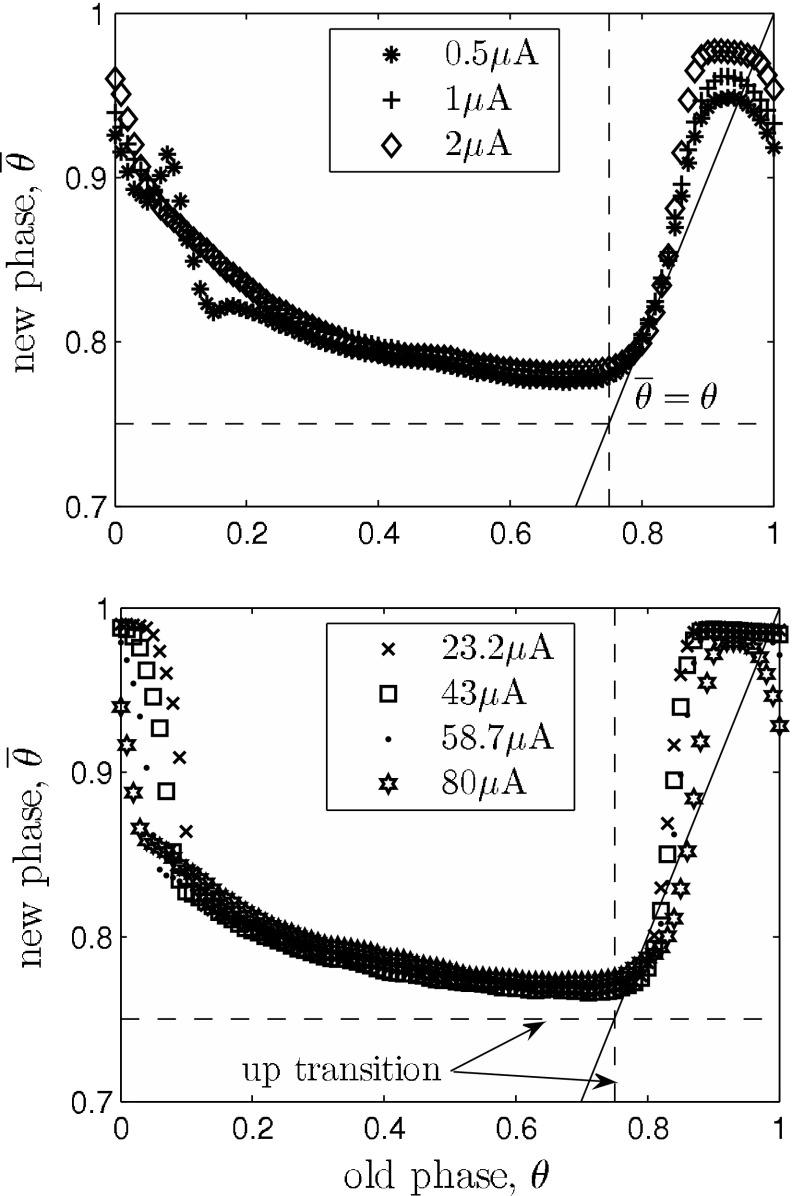
Phase transition curves (PTCs) of the network model for Type 0 (strong) resetting. The solid line marks the condition  , e.g. slope 1. The shortening of an up state that results from a stimulation at
  is almost independent of the stimulus intensity, as indicated by the overlapping curves in that range. Significant differences are apparent at the transition from up to down state and down to up state, respectively. Top the PTCs mostly stay above
  , indicating that in this intensity range up state durations can only be decreased. Bottom the model predicts that there is a refractory period only for mediumly strong stimuli (
 ), as the phase transition curve is close to
  . Also, the slopes near the state transitions are steeper for strong stimuli. Hence it is more likely for very strong stimuli to have the desynchronizing effect shown in Fig. 7
Phase reduction of mean-field model
Ngo et al. recently introduced a minimal model for the generation of cortical up and down states. The original model of Ngo et al. is a time-discrete map. The full model, reformulated as system of differential equations, is
 |
4a |
 |
4b |
 |
4c |
The variable x ranges between 0 and 1 and describes to what extent the population is active. μ is an activity dependent variable that increases when x is active and could be interpreted as calcium current. ϑ has an inhibiting effect on x and is triggered by μ. It could be interpreted as calcium dependent potassium current. β describes the noise level of the population, C stands for the coupling strength, df is a constant firing threshold and λμ and λϑ are recovery rates of μ and ϑ, respectively. We then used the software XPPAUT to numerically obtain the PRC (Ermentrout 2002). The result is shown in Fig. 5 (right). We chose the parameters of the mean-field model to closely match phases of up and down states and PRC of the network model. According to this model perturbations have the largest influence in a relatively short time window right before the transition to the up state and lead to a phase advance, i.e. a shortening of the down state. At the beginning of an up state perturbations also lead to a phase advance and a shortening of the up state, however only to a comparatively small extent. Perturbations toward the end of an up state have a larger impact, leading to a phase delay and hence can prolong the up state.
Fig. 7.
Disrupting effect of a strong stimulus ( ) applied at phases with rapidly changing slope of the PRC for strong resetting, depicted in Fig. 6. As individual neurons never have identical phases when being in a collective up state it is possible to terminate the up state in one part of the network while at the same time extending it in another part, thus resulting in an effective desynchronization of the 1D system
Discussion
In this paper we obtained a testable prediction for the PRC of the neocortex during deep anesthesia and for slices of cortex tissue exhibiting up and down states. In the weak resetting regime we found type II PRCs with similar features for two different models that reproduce many aspects of up and down states in slices. The obtained PRCs show maximal responsiveness close to the transition to the up state. This is in agreement with evoked potential studies (Massimini 2002) in humans and animals (MacLean et al. 2005; Petersen et al. 2003). In the strong resetting regime both models also conform to the experimental results by Shu et al. (2003). Our results strictly apply only to ferret brain slices, as both investigated models build on observations from those preparations. However, considering the universality of sleep and related phenomena like spindles and hippocampal ripples across mammals our results should, at least qualitatively, translate to other species as well.
During natural deep sleep cortical slow oscillations are less regular than observed under certain kinds of anesthesia and in slice preparations. The reason for this is largely unclear. Theoretical investigations assuming noise as driving force for the switching between up and down states predict a power law distribution (Mejias et al. 2010) of the residence times in up and down states, but also showed that a purely fluctuation driven transition between up and down states is not sufficient to account for the statistics of residence times (Deco et al. 2009). Rather, the probability density function obtained from experimental data is unimodal and centered on a preferred frequency not close to zero (Deco et al. 2009). The global dynamics of the conductance based network are that of a relaxation oscillator. The slow potassium currents in the model lead to a gradual build up of inhibition during the action of fast spiking currents in the up state and terminate it subsequently. This inhibition then relaxes during the down state. Although phase response theory fails in predicting the rapid synchronization behavior of relaxation oscillators (Somers and Kopell 1995) it is appropriate for relaxation oscillators if coupling is weak and the oscillator is not close to the relaxation limit (Izhikevich 2000; Várkonyi and Holmes 2008). The observation that the cortical slow oscillation propagates as a travelling wave (Massimini et al. 2004) supports this notion.
Phase response theory allows for accurate prediction of phase locking between oscillators and can be useful to analyze interactions between brain regions (Levnajić and Pikovsky 2010; Ko and Ermentrout 2009; Kori et al. 2009; Perez Velazquez et al. 2007), especially their phase coherence (Akam et al. 2012). During mammalian deep sleep hippocampal sharp wave ripple complexes and thalamic spindles tend to be phase-locked to the neocortical slow oscillation (Clemens et al. 2007; Mayer et al. 2007; Mölle et al. 2002) and parahippocampal activity seems to be phase-locked to the troughs of parietal and parahippocampal spindles. A characterization of these rhythms in terms of PRCs might shed light on the nature of this observation. Furthermore, knowing the response function of the system enables one to estimate cortical inputs based on the drift velocity of spiral waves (Biktasheva et al. 2010).
Acknowledgments
This work was supported by the Deut-sche Forschungsgemeinschaft (DFG) within SFB 654 “Plasticity & Sleep” and the Graduate School for Computing in Medicine and Life Sciences funded by Germany’s Excellence Initiative [DFG GSC 235/1].
Appendix: The network model
In the original model by (Compte et al. 2003) 1,024 pyramidal neurons (see Table 1) and 256 interneurons (see Table 2) are distributed equidistantly along a line of 5 mm. The probability that two neurons, separated by a distance x, are connected is  with a synaptic footprint of
  for excitatory connections and
  for inhibitory connections. The equations governing the synapses can be found in Table 3. Each neuron makes 20 ± 5 connections to other neurons. In our simulations we used 256 pyramidal neurons and 64 interneurons. The network length and synaptic footprint was linearly scaled to preserve the properties of the original model. We applied periodic boundary conditions.
Table 1.
Regular-spiking pyramidal neurons
| Description | Equations | Parameters |
|---|---|---|
| Somatic voltage |

|
C m = 1 μF/cm2 |
| − I syn,s − g sd(V s − V d) + I ext | A s = 0.015 mm2 | |
| g sd = (1.75 ± 0.1) μS | ||
| Dendritic voltage |

|
A d = 0.035 mm2 |
| − I syn,d − g sd(V d − V s) + I ext | ||

|
||

|
||
| Leakage current | I L = g L (V − V L) | V L = (−60.95 ± 0.3) mV |
| g L = (0.067 ± 0.0067) mS/cm2 | ||
| Spiking sodium current |

|
g Na = 50 mS/cm2 |

|
V Na = 55 mV | |

|
ϕ = 4 | |

|
||

|
||

|
||

|
||
| Spiking potassium current | I K = g K h 4K(V − V K) | ϕ = 4 |

|
g K = 10.5 mS/cm2 | |

|
V K = −100 mV | |

|
||
| Fast inactivating current |

|
g A = 1 mS/cm2 |

|

|
|

|
||

|
||
| Non-inactivating K+-channel | I KS = g KS m KS(V − V K) | g KS = 0.576 mS/cm2 |

|
||

|
||

|
||
| Non-inactivating sodium channel |

|
g NaP = 0.0686 mS/cm2 |

|
||
| Hyperpolarization de-inactivated channel |

|
g AR = 0.0257 mS/cm2 |

|
||
| High-threshold Ca2+-channel |

|
g Ca = 0.43 mS/cm2 |

|
V Ca = 120 mV | |
| Calcium dependent potassium channel | I KCa = g KCa[Ca2+]/([Ca2+] + K D)(V − V K) | g KCa = 0.57 mS/cm2 |
| d [Ca2+]/dt = −αCa A d I Ca − [Ca2+]/τCa |

|
|
| τCa = 150 ms | ||
| Sodium dependent potassium channel |

|
g KNa = 1.33 mS/cm2 |

|
||
| Sodium dynamics | d [Na+]/dt = − αNa(A s I Na + A d I NaP) |

|
| −R pump{[Na+]3/([Na+]3 + 153) − [Na+]3eq/([Na+]3eq + 153)} | R pump = 0.018 mM/ms | |
| [Na+]eq = 9.5 mM |
Table 2.
Fast-spiking inhibitory interneurons
| Description | Equations | Parameters |
|---|---|---|
| Somatic voltage |

|
A i = 0.02 mm2 |
| g Na = 35 mS/cm2 | ||
| Leak current | I L = g L (V − V L) | g L = (0.1025 ± 0.0025) mS/cm2 |
| V L = (−63.8 ± 0.15) mV | ||
| Spiking sodium current |

|
g Na = 35 mS/cm2 |

|
V Na = 55 mV | |

|
||

|
||

|
||

|
||

|
||
| Slow potassium current | I K = g K m 4K (V − V k) | g K = 9 mS/cm2 |

|
V K = −90 mV | |

|
||

|
Table 3.
Synapses
| Description | Equations | Parameters |
|---|---|---|
| AMPA synapses | I syn = g syn s(V − V syn) | α = 3.48 |

|
τ = 2 ms | |

|
V syn = 0 V | |
| g AMPAEE = 5.4 nS | ||
| g AMPAEI = 2.25 nS | ||
| NMDA synapses |

|
αs = 0.5 |

|
τs = 100 ms | |

|
αx = 3.48 | |
| τx = 2 ms | ||
| V syn = 0 mV | ||
| g NMDAEE = 0.9 nS | ||
| g NMDAEI = 0.5 nS | ||
| GABA synapses | I syn = g syn s(V − V syn) | α = 1 |

|
τ = 10 ms | |

|
V syn = −70 mV | |
| g IE = 4.15 nS |
Contributor Information
Arne Weigenand, Phone: +49-451-5005309, FAX: +49-451-5005502, Email: weigenand@inb.uni-luebeck.de.
Thomas Martinetz, Email: martinetz@inb.uni-luebeck.de.
Jens Christian Claussen, Email: claussen@inb.uni-luebeck.de.
References
- Achuthan S, Butera RJ, Canavier CC. Synaptic and intrinsic determinants of the phase resetting curve for weak coupling. J Comput Neurosci. 2010;30(2):373–390. doi: 10.1007/s10827-010-0264-1. [DOI] [PMC free article] [PubMed] [Google Scholar]
- Akam T, Oren I, Mantoan L, Ferenczi E, Kullmann DM. Oscillatory dynamics in the hippocampus support dentate gyrus-CA3 coupling. Nat Neurosci. 2012;15(5):763–768. doi: 10.1038/nn.3081. [DOI] [PMC free article] [PubMed] [Google Scholar]
- Amzica F, Steriade M. Electrophysiological correlates of sleep delta waves. Electroencephalogr Clin Neurophysiol. 1998;107(2):69–83. doi: 10.1016/S0013-4694(98)00051-0. [DOI] [PubMed] [Google Scholar]
- Biktasheva IV, Barkley D, Biktashev VN, Foulkes AJ. Computation of the drift velocity of spiral waves using response functions. Phys Rev E. 2010;81(6):066202. doi: 10.1103/PhysRevE.81.066202. [DOI] [PubMed] [Google Scholar]
- Brunel N. Dynamics of sparsely connected networks of excitatory and inhibitory spiking neurons. J Comput Neurosci. 2000;8(3):183–208. doi: 10.1023/A:1008925309027. [DOI] [PubMed] [Google Scholar]
- Clemens Z, Mölle M, Erőss L, Barsi P, Halász P, Born J. Temporal coupling of parahippocampal ripples, sleep spindles and slow oscillations in humans. Brain. 2007;130:2868–2878. doi: 10.1093/brain/awm146. [DOI] [PubMed] [Google Scholar]
- Compte A, Sanchez-Vives MV, McCormick DA, Wang X. Cellular and network mechanisms of slow oscillatory activity (<1 hz) and wave propagations in a cortical network model. J Neurophysiol. 2003;89(5):2707–2725. doi: 10.1152/jn.00845.2002. [DOI] [PubMed] [Google Scholar]
- Contreras D, Steriade M. Cellular basis of EEG slow rhythms: a study of dynamic corticothalamic relationships. J Neurosci. 1995;15(1):604. doi: 10.1523/JNEUROSCI.15-01-00604.1995. [DOI] [PMC free article] [PubMed] [Google Scholar]
- Deco G, Mart D, Ledberg A, Reig R, Sanchez Vives MV. Effective reduced Diffusion-Models: a data driven approach to the analysis of neuronal dynamics. PLoS Comput Biol. 2009;5(12):e1000587. doi: 10.1371/journal.pcbi.1000587. [DOI] [PMC free article] [PubMed] [Google Scholar]
- Diekelmann S, Born J. The memory function of sleep. Nat Rev Neurosci. 2010;11(2):114–126. doi: 10.1038/nrn2762. [DOI] [PubMed] [Google Scholar]
- Ermentrout B. Simulating, analyzing, and animating dynamical systems. Philadelphia: SIAM; 2002. [Google Scholar]
- Ermentrout B, Terman D. Mathematical foundations of neuroscience. Berlin: Springer; 2010. [Google Scholar]
- Fröhlich F, McCormick DA. Endogenous electric fields may guide neocortical network activity. Neuron. 2010;67(1):129–143. doi: 10.1016/j.neuron.2010.06.005. [DOI] [PMC free article] [PubMed] [Google Scholar]
- Granada A, Hennig R, Ronacher B, Kramer A, Herzel H (2009) Phase response curves: elucidating the dynamics of coupled oscillators. In: Michael L. Johnson and Ludwig Brand (eds) Methods in enzymology, vol 454. Elsevier, pp 1–27 [DOI] [PubMed]
- Grannan ER, Kleinfeld D, Sompolinsky H. Stimulus-dependent synchronization of neuronal assemblies. Neural Comput. 1993;5(4):550–569. doi: 10.1162/neco.1993.5.4.550. [DOI] [Google Scholar]
- Gray CM, Konig P, Engel AK, Singer W. Oscillatory responses in cat visual cortex exhibit inter-columnar synchronization which reflects global stimulus properties. Nature. 1989;338(6213):334–337. doi: 10.1038/338334a0. [DOI] [PubMed] [Google Scholar]
- Hájos N, Palhalmi J, Mann EO, Németh B, Paulsen O, Freund TF. Spike timing of distinct types of GABAergic interneuron during hippocampal gamma oscillations in vitro. J Neurosci. 2004;24(41):9127–9137. doi: 10.1523/JNEUROSCI.2113-04.2004. [DOI] [PMC free article] [PubMed] [Google Scholar]
- Izhikevich EM. Phase equations for relaxation oscillators. SIAM J Appl Math. 2000;60(5):1789–1804. doi: 10.1137/S0036139999351001. [DOI] [Google Scholar]
- Jirsa V. Dispersion and time delay effects in synchronized spike-burst networks. Cogn Neurodyn. 2008;2(1):29–38. doi: 10.1007/s11571-007-9030-0. [DOI] [PMC free article] [PubMed] [Google Scholar]
- Ko TW, Ermentrout GB. Phase-response curves of coupled oscillators. Phys Rev E. 2009;79:016,211. doi: 10.1103/PhysRevE.79.016211. [DOI] [PubMed] [Google Scholar]
- Kori H, Kawamura Y, Nakao H, Arai K, Kuramoto Y. Collective-phase description of coupled oscillators with general network structure. Phys Rev E. 2009;80:036207. doi: 10.1103/PhysRevE.80.036207. [DOI] [PubMed] [Google Scholar]
- Kuramoto Y (2003) Chemical oscillations, waves, and turbulence. Chemistry series, Dover Publications (originally published: Springer Berlin, 1984)
- Levnajić Z, Pikovsky A. Phase resetting of collective rhythm in ensembles of oscillators. Phys Rev E. 2010;82:056202. doi: 10.1103/PhysRevE.82.056202. [DOI] [PubMed] [Google Scholar]
- MacLean JN, Watson BO, Aaron GB, Yuste R. Internal dynamics determine the cortical response to thalamic stimulation. Neuron. 2005;48(5):811–823. doi: 10.1016/j.neuron.2005.09.035. [DOI] [PubMed] [Google Scholar]
- Marshall L, Mölle M, Hallschmid M, Born J. Transcranial direct current stimulation during sleep improves declarative memory. J Neurosci. 2004;24(44):9985–9992. doi: 10.1523/JNEUROSCI.2725-04.2004. [DOI] [PMC free article] [PubMed] [Google Scholar]
- Marshall L, Helgadottir H, Mölle M, Born J. Boosting slow oscillations during sleep potentiates memory. Nature. 2006;444(7119):610–613. doi: 10.1038/nature05278. [DOI] [PubMed] [Google Scholar]
- Massimini M. EEG slow (1 hz) waves are associated with nonstationarity of Thalamo–Cortical sensory processing in the sleeping human. J Neurophysiol. 2002;89:1205–1213. doi: 10.1152/jn.00373.2002. [DOI] [PubMed] [Google Scholar]
- Massimini M, Huber R, Ferrarelli F, Hill S, Tononi G. The sleep slow oscillation as a traveling wave. J Neurosci. 2004;24(31):6862. doi: 10.1523/JNEUROSCI.1318-04.2004. [DOI] [PMC free article] [PubMed] [Google Scholar]
- Massimini M, Ferrarelli F, Esser SK, Riedner BA, Huber R, Murphy M, Peterson MJ, Tononi G. Triggering sleep slow waves by transcranial magnetic stimulation. Proc Natl Acad Sci USA. 2007;104(20):8496–8501. doi: 10.1073/pnas.0702495104. [DOI] [PMC free article] [PubMed] [Google Scholar]
- Mattia M, Sanchez-Vives M (2012) Exploring the spectrum of dynamical regimes and timescales in spontaneous cortical activity. Cogn Neurodyn 6(3):239–250 [DOI] [PMC free article] [PubMed]
- Mayer J, Schuster HG, Claussen JC, Mölle M. Corticothalamic projections control synchronization in locally coupled bistable thalamic oscillators. Phys Rev Lett. 2007;99(6):068102. doi: 10.1103/PhysRevLett.99.068102. [DOI] [PubMed] [Google Scholar]
- Mejias JF, Kappen HJ, Torres JJ. Irregular dynamics in up and down cortical states. PLoS One. 2010;5(11):e13651. doi: 10.1371/journal.pone.0013651. [DOI] [PMC free article] [PubMed] [Google Scholar]
- Mölle M, Marshall L, Gais S, Born J. Grouping of spindle activity during slow oscillations in human non-rapid eye movement sleep. J Neurosci. 2002;22(24):10941–10947. doi: 10.1523/JNEUROSCI.22-24-10941.2002. [DOI] [PMC free article] [PubMed] [Google Scholar]
- Ngo HV, Köhler J, Mayer J, Claussen JC, Schuster HG. Triggering up states in all-to-all coupled neurons. EPL Europhys Lett. 2010;89(6):68002. doi: 10.1209/0295-5075/89/68002. [DOI] [Google Scholar]
- Perez Velazquez JL, Galán RF, Dominguez LG, Leshchenko Y, Lo S, Belkas J, Erra RG. Phase response curves in the characterization of epileptiform activity. Phys Rev E. 2007;76:061912. doi: 10.1103/PhysRevE.76.061912. [DOI] [PubMed] [Google Scholar]
- Petersen CC, Hahn TT, Mehta M, Grinvald A, Sakmann B (2003) Interaction of sensory responses with spontaneous depolarization in layer ii/iii barrel cortex. Proc Natl Acad Sci USA 100(23):13638 [DOI] [PMC free article] [PubMed]
- Peyrache A, Khamassi M, Benchenane K, Wiener SI, Battaglia FP. Replay of rule-learning related neural patterns in the prefrontal cortex during sleep. Nat Neurosci. 2009;12(7):919–926. doi: 10.1038/nn.2337. [DOI] [PubMed] [Google Scholar]
- Sanchez-Vives MV, McCormick DA. Cellular and network mechanisms of rhythmic recurrent activity in neocortex. Nat Neurosci. 2000;3(10):1027–1034. doi: 10.1038/79848. [DOI] [PubMed] [Google Scholar]
- Sanchez-Vives MV, Descalzo VF, Reig R, Figueroa NA, Compte A, Gallego R. Rhythmic spontaneous activity in the piriform cortex. Cereb Cortex. 2008;18(5):1179. doi: 10.1093/cercor/bhm152. [DOI] [PubMed] [Google Scholar]
- Sanchez-Vives MV, Mattia M, Compte A, Perez-Zabalza M, Winograd M, Descalzo VF, Reig R. Inhibitory modulation of cortical up states. J Neurophysiol. 2010;104(3):1314–1324. doi: 10.1152/jn.00178.2010. [DOI] [PubMed] [Google Scholar]
- Seamari Y, Narvez JA, Vico FJ, Lobo D, Sanchez-Vives MV. Robust off- and online separation of intracellularly recorded up and down cortical states. PLoS One. 2007;2(9):e888. doi: 10.1371/journal.pone.0000888. [DOI] [PMC free article] [PubMed] [Google Scholar]
- Shu Y, Hasenstaub A, McCormick DA. Turning on and off recurrent balanced cortical activity. Nature. 2003;423(6937):288–293. doi: 10.1038/nature01616. [DOI] [PubMed] [Google Scholar]
- Somers D, Kopell N. Waves and synchrony in networks of oscillators of relaxation and non-relaxation type. Physica D. 1995;89(1–2):169–183. doi: 10.1016/0167-2789(95)00198-0. [DOI] [Google Scholar]
- Stickgold R. Sleep-dependent memory consolidation. Nature. 2005;437(7063):1272–1278. doi: 10.1038/nature04286. [DOI] [PubMed] [Google Scholar]
- Tass PA. Phase resetting in medicine and biology: stochastic modelling and data analysis. Berlin: Springer; 1999. [Google Scholar]
- Tsubo Y, Takada M, Reyes AD, Fukai T. Layer and frequency dependencies of phase response properties of pyramidal neurons in rat motor cortex. Eur J Neurosci. 2007;25(11):3429–3441. doi: 10.1111/j.1460-9568.2007.05579.x. [DOI] [PubMed] [Google Scholar]
- Várkonyi PL, Holmes P. On synchronization and traveling waves in chains of relaxation oscillators with an application to lamprey cpg. SIAM J Appl Dyn Syst. 2008;7:766–794. doi: 10.1137/070710329. [DOI] [Google Scholar]
- Winfree AT. The geometry of biological time, 2nd edn. Berlin: Springer; 2001. [Google Scholar]


