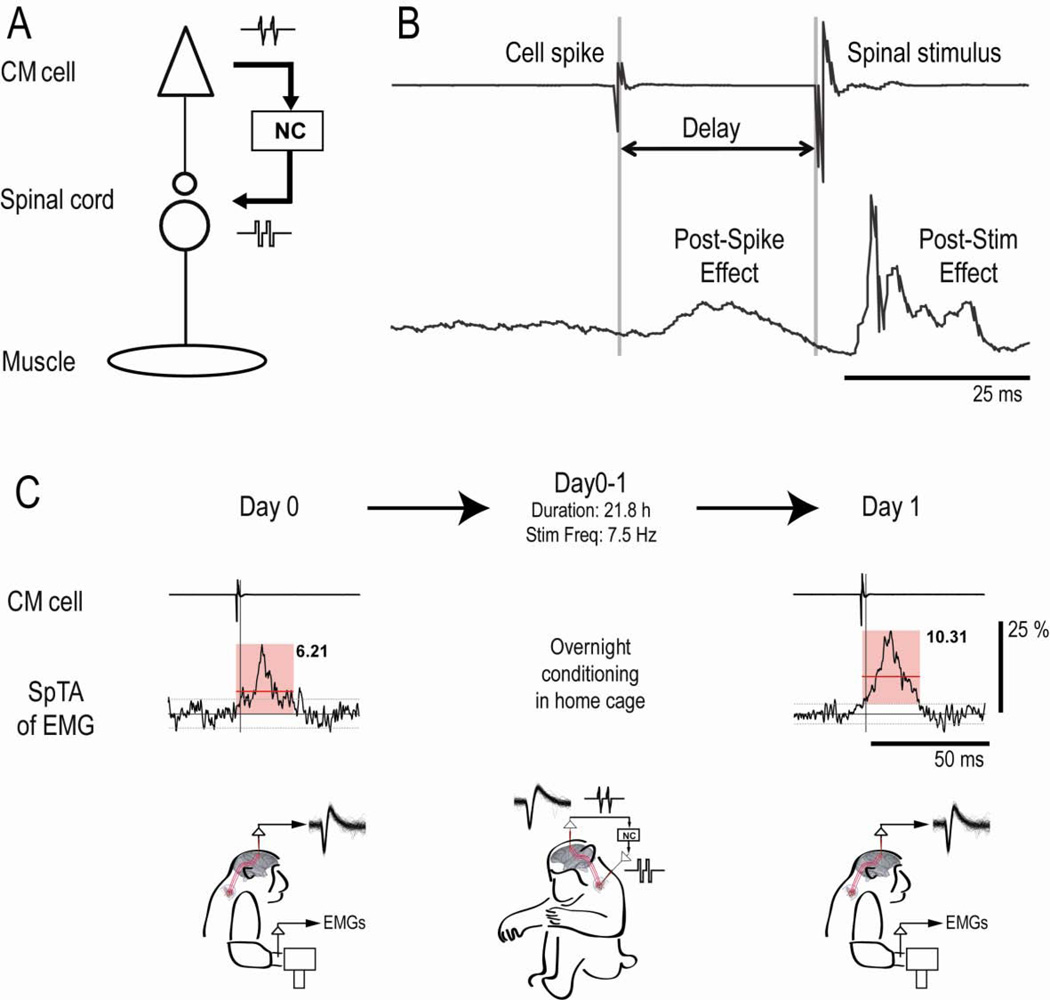
Figure 1. Experimental design and protocol.
A: Schematic showing action potentials of CM cell triggering intraspinal stimuli via neurochip (NC). B: Cortical recording (top) and SpTA of EMG (bottom) for CM spikes followed after delay of 25 ms by spinal stimulus. SpTA shows post-spike facilitation and post-stimulus response in same target muscle. C: SpTAs of EMG acquired before (Day 0) and after (Day 1) a 22h period of conditioning, showing analysis interval (pink square), baseline ± 2 SD of SpTA (horizontal gray lines), and MPI above baseline of feature (horizontal red lines and black numbers). Conditioning increased MPI by 66% (p=0.0003). Vertical bar calibrates 25% of baseline. Drawings represent monkey performing task on Days 0 and 1, and behaving freely during 21.8 h of conditioning, with mean spike frequency of 7.5 Hz.

