

Abstract
The chromatin landscape is key for gene regulation, but little is known about how it differs between sexes or between species. Here, we study the sex-specific chromatin landscape of Drosophila miranda, a species with young sex chromosomes, and compare it with Drosophila melanogaster. We analyze six histone modifications in male and female larvae of D. miranda (H3K4me1, H3K4me3, H3K36me3, H4K16ac, H3K27me3, and H3K9me2), and define seven biologically meaningful chromatin states that show different enrichments for transcribed and silent genes, repetitive elements, housekeeping, and tissue-specific genes. The genome-wide distribution of both active and repressive chromatin states differs between males and females. In males, active chromatin is enriched on the X, relative to females, due to dosage compensation of the hemizygous X. Furthermore, a smaller fraction of the euchromatic portion of the genome is in a repressive chromatin state in males relative to females. However, sex-specific chromatin states appear not to explain sex-biased expression of genes. Overall, conservation of chromatin states between male and female D. miranda is comparable to conservation between D. miranda and D. melanogaster, which diverged >30 MY ago. Active chromatin states are more highly conserved across species, while heterochromatin shows very low levels of conservation. Divergence in chromatin profiles contributes to expression divergence between species, with ∼26% of genes in different chromatin states in the two species showing species-specific or species-biased expression, an enrichment of approximately threefold over null expectation. Our data suggest that heteromorphic sex chromosomes in males (that is, a hypertranscribed X and an inactivated Y) may contribute to global redistribution of active and repressive chromatin marks between chromosomes and sexes.
In the past several years, chromatin structure has been identified as a major component regulating gene expression (Schulze and Wallrath 2007). Chromatin is composed of DNA and a variety of modified histones and nonhistone proteins, and genome-wide profiling of chromatin components has provided a rich functional annotation of the underlying DNA sequences (Filion et al. 2010; Kharchenko et al. 2011; The ENCODE Project Consortium 2012). Groups of correlated histone modifications (chromatin states) were found to be associated with specific biological functions, such as heterochromatic regions, active transcription, or polycomb-mediated repression (Ernst et al. 2011; Riddle et al. 2011; Yin et al. 2011). Previous studies in Drosophila melanogaster have investigated chromatin states in various cell lines (Filion et al. 2010; Kharchenko et al. 2011) and mixed-sex adults (Yin et al. 2011), and have greatly increased our understanding of the functional significance of chromatin marks. However, little is known about how chromatin structure varies across species or between sexes within a species. In particular, levels of gene expression vary considerably among species, and gene expression divergence has been implicated as an important factor driving adaptive divergence between species (Meiklejohn et al. 2003; McManus et al. 2010; Wittkopp and Kalay 2011), but it is generally unclear how expression divergence correlates with changes in chromatin structure (Cain et al. 2011).
Not only species, but also the two sexes within a species often vary considerably in which genes are expressed at what level (Khil et al. 2004; Zhang et al. 2007). Differential expression of genes between sexes (sex-biased gene expression) contributes to a variety of physiological, morphological, and behavioral traits that differ between males and females (Parsch and Ellegren 2013). Recent genome-wide expression profiling studies have demonstrated that sex-related differences in gene expression are extensive across a range of taxa, including insects, nematodes, birds, and mammals (Ellegren and Parsch 2007; Parsch and Ellegren 2013). How these differences in sex-biased gene expression are achieved on the cellular level and the involvement of chromatin structure differences are, for the most part, unknown, and no comprehensive analysis contrasting chromatin between males and females has yet been performed.
Finally, even chromosomes within an individual can show systematic differences in how genes are transcriptionally regulated. In particular, sex chromosomes often show unusual patterns of gene expression, with the Y being transcriptionally repressed in Drosophila, while the X is hypertranscribed in males. Both of these transcriptional modifications are mediated by changes to the chromatin landscape (Straub and Becker 2007; Girton and Johansen 2008; Gelbart and Kuroda 2009; Lemos et al. 2010). Sex chromosomes are derived from autosomes, but their dynamics are governed by unique evolutionary and functional pressures (Bachtrog 2006). The male-limited Y chromosome degenerates, that is, it loses most of its ancestral genes, accumulates repetitive junk DNA, and evolves a heterochromatic appearance (Charlesworth and Charlesworth 2000; Bachtrog 2013). Its former homolog, the X chromosome, acquires mechanisms to compensate for gene loss associated with Y degeneration, and evolves hypertranscription in Drosophila (i.e., dosage compensation) (Gelbart and Kuroda 2009; Vicoso and Bachtrog 2009). Both heterochromatin formation and dosage compensation are accompanied by global changes in chromatin structure (Steinemann and Steinemann 2005; Straub and Becker 2007), but little is known about how these epigenetic modifications are acquired on a differentiating pair of proto-sex chromosomes (Zhou et al. 2013).
Here, we investigate the sex-specific chromatin landscape of D. miranda, a species that diverged from D. melanogaster ∼30 MY ago and contains three sex chromosomes of different ages: XL, XR, and the neo-X (Fig. 1). XL is homologous to the X chromosome of D. melanogaster and has been segregating as a sex chromosome for >60 MY (Vicoso and Bachtrog 2013). XR—which corresponds to chr 3L in D. melanogaster—became sex-linked ∼15 MY ago in an ancestor of D. miranda, but has evolved most features characteristic of the ancestral X, including chromosome-wide dosage compensation and complete degeneration of its former homolog (Alekseyenko et al. 2013; Zhou et al. 2013). Finally, the neo-sex chromosomes of D. miranda (homologous to chr 2R of D. melanogaster) only formed ∼1.5 MY ago, and harbor many characteristics that are intermediate between ordinary autosomes and heteromorphic sex chromosomes. In particular, the neo-Y is undergoing genome-wide degeneration; over 1000 genes have acquired stop codons or frameshift mutations (Bachtrog 2005; Bachtrog et al. 2008; Zhou and Bachtrog 2012), and the neo-Y is evolving a heterochromatic configuration (Zhou et al. 2013). In response, the neo-X has begun to evolve partial dosage compensation (Alekseyenko et al. 2013). This species is therefore uniquely suited to study the evolutionary dynamics of chromatin associated with sex chromosome differentiation.
Figure 1.
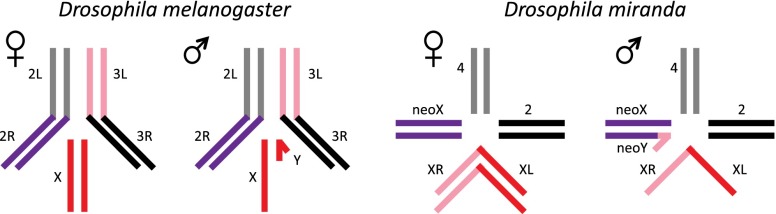
Karyotypes of D. melanogaster and D. miranda (dot chromosome not shown). The euchromatic karyotypes of D. melanogaster and D. miranda, with chromosome arms colored by orthology. Chromosome arms that are autosomal in both species are in gray and black, the shared X chromosome is in red, and the chromosome arms that are sex-linked in D. miranda but not D. melanogaster are in pink and purple.
We set out to make comparisons of the chromatin landscape in Drosophila at three different levels: species, sexes, and chromosomes. In particular, we first compare the chromatin landscape between autosomes and sex chromosomes of different ages, taking advantage of the unique karyotype of D. miranda. Second, we contrast the chromatin landscape of male and female D. miranda, to characterize sex-specific differences in chromatin. And finally, we compare chromatin states of D. miranda to the well-characterized chromatin landscape of D. melanogaster in order to identify evolutionary conservation and turnover of chromatin marks within Drosophila.
Results and Discussion
The chromatin landscape of D. miranda and D. melanogaster
To explore chromatin states in D. miranda, we used ChIP-seq profiles from male and female third instar larvae for six different histone modifications (Alekseyenko et al. 2013; Zhou et al. 2013): H3K36me3 (associated with transcription elongation); H4K16ac (associated with dosage compensation and transcribed regions); H3K4me3 (associated with active promoters and transcription start sites); H3K4me1 (associated with enhancers and introns); H3K27me3 (associated with polycomb-repressed regions); and H3K9me2 (associated with constitutive heterochromatin). These six histone modifications characterize a variety of chromatin states found in Drosophila, and provide a broad functional annotation of the D. miranda genome. Studies in D. melanogaster have assayed 18 histone modifications and applied a multivariate hidden Markov model that uses combinatorial patterns of chromatin marks to assign chromatin states to regions of the genome (Kharchenko et al. 2011). Nine major chromatin states (i.e., groups of correlated histone modifications) were identified in D. melanogaster. Using our subset of six histone modifications, we were able to define seven biologically meaningful chromatin states in D. melanogaster using a multivariate hidden Markov model (Ernst and Kellis 2012). Comparison of our seven-state model to the nine-state model defined by Kharchenko et al. (2011) revealed that there is a generally good correspondence between the models in both their emissions parameters and their distribution throughout the genome (Supplemental Figs. S1–S3), even though the models were learned with different data sets from different tissues (SL2 cells vs. third instar larvae). This suggests that these chromatin states are robust and reflect true underlying biological combinations of histone modifications. Since we were able to directly compare the model learned from our subset of histone modifications to the model learned from a more complete panel of histone marks in D. melanogaster, we applied the same seven-state chromatin model to the D. miranda data (note that a chromatin state model recovered from D. miranda ChIP-seq profiles is very similar to the D. melanogaster seven-state model; Supplemental Fig. S4). Our map is derived from all cell types in the larvae of D. melanogaster and D. miranda, weighted by their natural abundance, but many chromatin features are conserved in Drosophila cell lines, and across major developmental stages (Filion et al. 2010; Kharchenko et al. 2011; Yin et al. 2011). The seven states show distinct biological enrichments: four active states (one each that corresponds to active promoters, transcription elongation, regulatory elements and introns, and spreading of the dosage-compensation complex) as well as three silent or repressive states (one each for polycomb-mediated silencing, constitutive heterochromatin, and a background null state).
Previous studies have observed that there is a strong correlation between sequencing depth and amount of binding detected in ChIP-seq experiments (Kharchenko et al. 2008). In order to compare binding across multiple samples (male and female D. miranda and D. melanogaster) with equal ability to detect peaks, we developed a normalization strategy that first ensured equal numbers of reads for each mark across all samples (Supplemental Fig. S5). Additionally, because we expect binding of certain marks (e.g., H4K16ac) to be highly enriched on sex chromosomes, we called binding events for autosomes independently of the sex chromosomes to detect lower-level binding events on the autosomes; this strategy is more conservative in estimating differences in histone enrichment profiles on autosomes between the sexes (Supplemental Fig. S6). To validate our normalization strategy, we performed ChIP-qPCR for H3K9me2 and H4K16ac, the two histone modifications that showed the greatest difference between the two sexes in absolute quantity as detected by Western blot (Supplemental Fig. S7). Using a subset of targets from both autosomes and the X chromosomes, we confirmed that targets we called bound show a significant increase over the input compared with regions we called unbound for both marks (Supplemental Fig. S8A,B). Additionally, regions that were defined by ChIP-seq as being bound in both sexes showed a significantly different ratio of enrichment in females vs. males as compared with regions that were bound in only one sex (Supplemental Fig. S8C,D), suggesting that our normalization strategy captures real binding differences between the two sexes. This is further supported by replicate ChIP-seq experiments for H4K16ac and H3K9me2 in male and female D. miranda larvae (Supplemental Fig. S9), the two histone marks that show the most dramatic difference between sexes. The other four histone modifications are strongly correlated between male and female samples (Supplemental Fig. S10), and ChIP efficiencies are similar between sexes and species (Supplemental Figs. S11, S12).
Figure 2 gives an overview of the chromatin states identified in D. miranda and their genomic distribution. States 1 and 2 are enriched for histone marks of active transcription, characterized by the transcriptional elongation signature H3K36me3 and enriched at exons and 5′ and 3′ flanking regions of genes. State 1 shows strong enrichment within 5′ UTRs, consistent with its enrichment for H3K4me3, a mark associated with active transcription start sites (TSS) and promoters. State 2, enriched primarily for the transcription elongation mark H3K36me3, is highly enriched within 3′ UTRs. State 3, which is associated with H3K4me1 but not the other active histone modifications, is enriched in introns and 5′ UTRs, consistent with the association of H3K4me1 with enhancers. State 4 is distinguished by high enrichment of H4K16ac only, and enrichment of this histone mark on the Drosophila male X chromosome is considered a signature of dosage compensation (Straub and Becker 2007; Gelbart and Kuroda 2009). States 5 and 6 are repressive states found in silenced genes, intergenic regions, and introns. State 5 (H3K27me3) corresponds to regions of polycomb-mediated repression while state 6 (H3K9me2) represents constitutive heterochromatin. State 7 corresponds to silent domains that are not enriched for any of the histone modifications assayed, and is mainly found in intergenic regions and introns (Kharchenko et al. 2011). States 1–4 represent “active” chromatin states, while states 5–7 represent “repressed” chromatin states. Most transcribed genes are in active chromatin states (most frequently states 1 and 2), while most silent genes are in repressed chromatin states (Fig. 2C). Among expressed genes, most housekeeping genes (as defined by their breadth of expression using the tissue-specificity index tau; Larracuente et al. 2008) (Supplemental Fig. S13) are in states 1 or 2 (the H3K36me3 associated states), while most tissue-specific genes are characterized by repressive or silent chromatin states, even though they have detectable expression in third instar larvae (Fig. 2C). Thus, while states associated with H3K36me3 (states 1 and 2) are characteristic of genes that are broadly expressed, genes with more narrow expression patterns, even if transcribed, are not enriched for these chromatin states. Lower power to detect H3K36me3 binding of tissue-specific genes expressed only in a subset of cells in larvae could contribute to this effect, but we also see a deficiency in states associated with H3K36me3 in tissue-specific but expressed genes in SL2 cells (Supplemental Fig. S14). This corroborates a recent study in D. melanogaster that found that chromatin of housekeeping genes is enriched for the transcriptional elongation mark H3K36me3, but tissue-specific genes have a distinct chromatin structure that does not show enrichment for this histone modification (Filion et al. 2010).
Figure 2.
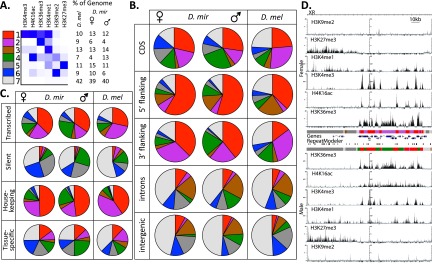
The chromatin landscape of D. miranda and D. melanogaster. (A) A model of prevalent chromatin states found in D. melanogaster and genomic coverage of chromatin states in D. melanogaster and male and female D. miranda. (B) Coverage of chromatin states in different categories of the genome. The 5′ and 3′ flanking regions refer to ±1 kb upstream of and downstream from the coding sequence (CDS). (C) Coverage of chromatin states in expressed and silent genes, and expressed genes categorized by their breadth of expression (housekeeping genes vs. tissue-specific genes as measured by the tissue-specificity index tau). (D) Example of chromatin profiles across the D. miranda genome.
States 1 and 2, which are both associated with H3K36me3, have the highest gene content of any of the states, with ∼36% of state 1 (35% in females, 36% in males) and 48% of state 2 (48% in females, 48% in males) comprised of coding regions (Supplemental Fig. S15A). State 4, which is characterized by high levels of H4K16ac, also has a strong enrichment for coding regions, especially in females, although females have a smaller fraction of their genome in this state. State 6 (constitutive heterochromatin) has the highest transposable element content, with ∼20% of state 6 (19% in females, 20% in males) composed of transposable elements (Supplemental Fig. S15B). Median expression levels of genes in different states also vary, with genes in the four active states having higher expression than genes in the three repressive states (Supplemental Fig. S16). Tissue specificity, as measured by the tissue-specificity index tau, also differs between genes across states; genes in active chromatin states tend to be broadly expressed (indicative of housekeeping genes) and genes in repressive chromatin states show more tissue-specific expression (Supplemental Fig. S17).
The sex- and chromosome-specific chromatin landscape of D. miranda
To explore the sex-specific chromatin landscape in D. miranda, we compared chromatin states between male and female larvae. In principle, differences in the chromatin structure between males and females could result from various sources: The hemizygous X chromosome is dosage compensated in males, which is accomplished by changes in the chromatin structure (Straub and Becker 2007; Gelbart and Kuroda 2009); males contain a large heterochromatic Y chromosome that could alter the stoichiometric balance of heterochromatin/euchromatin between the sexes (Weiler and Wakimoto 1995; Deng et al. 2009; Lemos et al. 2010; Zhou et al. 2012); and many genes show sex-biased expression that could be associated with sex-specific chromatin modifications. Figure 3 shows a genome-wide karyotype view of the chromatin domains derived from female and male D. miranda larvae. Several prominent chromatin organization features that differ between sexes are apparent, most noticeably the relative enrichment of active chromatin states (in particular, state 4) on the male X chromosomes, a signature of dosage compensation, but also more repressive chromatin states (both states 5 and 6) in the assembled, euchromatic part of the genome in females.
Figure 3.

The sex-specific chromatin landscape in D. miranda, and transitions in chromatin states between sexes. (A) A genome-wide karyotype view of the chromatin domains derived from female larvae (top) and male larvae (bottom) smoothed across 50-kb windows. (B) Transitions of chromatin states across chromosomes between the sexes. The solid background color indicates the fraction of a particular state in a given sex, and the crosshatch color indicates transitions to a given state in the other sex; solid regions indicate regions in the same chromatin state in both sexes. (C) Same as B, but for genomic regions overlapping the CDS of actively transcribed genes (FPKM > 1).
The hypertranscribed X in males
Males and females differ in their number of X chromosomes, and the X chromosome in male Drosophila is hypertranscribed (i.e., dosage compensated). Dosage compensation is acquired through histone modifications (Gelbart and Kuroda 2009), and the X chromosome is expected to show a different chromatin profile in males vs. females. Indeed, we see a larger fraction of the X chromosome (both XL and XR) to be in state 4 (H4K16ac associated state) in males, relative to females (20.9% vs. 4.9% in total, P < 2.2 × 10⁻¹⁶; 43.5% vs. 16.6% for CDS, P < 2.2 × 10⁻¹⁶, Fisher’s exact test), and the male X is also slightly enriched for state 1 (all active histone modifications) relative to females (13.6% vs. 12.5% in females total, P = 2.1 × 10⁻⁷; 32% vs. 30% for CDS, P = 0.008, Fisher’s exact test). On the other hand, very few regions in state 2 (H3K36me3 binding only) are found on the X of males (0.4% vs. 4.7% in females total, P < 2.2 × 10⁻¹⁶; 0.3% vs. 13.7% for CDS, P < 2.2 × 10⁻¹⁶, Fisher’s exact test), since most genes in state 2 on the female X are also associated with H4K16ac in males (states 1 and 4) (see Fig. 3B,C). This is consistent with the known mechanism of dosage compensation in Drosophila, whereby the MSL complex targets actively transcribed genes along the X chromosome by recognizing H3K36me3 and then inducing H4K16 acetylation (Larschan et al. 2007). Only the neo-X in males has a significant fraction of genes classified as state 2 (3.5% of CDS) but is also clearly enriched for genes in state 4 relative to females (42.8% in males vs. 14.5% in females within CDS, P < 2.2 × 10⁻¹⁶, Fisher’s exact test); this is consistent with partial dosage compensation on this chromosome (Alekseyenko et al. 2013). The fraction of the genome associated with H4K16ac (states 1 and 4) differs between males and females (24.8% in males, vs. 16.9% in females) (see Fig. 3B); however, this modification is significantly less abundant on autosomes in males relative to females (11% vs. 14.3%, P < 2.2 × 10⁻¹⁶, Fisher’s exact test) but enriched along the male X chromosomes (34.5% on the male XL and XR vs. 17.4% on the female XL and XR; P < 2.2 × 10⁻¹⁶, Fisher’s exact test) (Fig. 3B). A similar sex-biased distribution of H4K16ac is also observed in D. melanogaster (i.e., an excess on the male X, but an enrichment for H4K16ac on female relative to male autosomes; Supplemental Fig. S18B,C). All of these differences in chromatin states between the sexes are exaggerated in transcribed genes on the X, consistent with the dosage-compensation complex specifically targeting expressed genes (Fig. 3C; Alekseyenko et al. 2006). In females, the dosage-compensation complex does not assemble, and the chromatin landscape is more similar between the X and autosomes (Fig. 3B,C). However, there is a significant enrichment for states associated with H4K16ac (states 1 and 4) on XL and XR in females relative to autosomes (17.4% vs. 14.3%; P < 2.2 × 10⁻¹⁶, Fisher’s exact test). This may indicate that sequence features of the X that enable hypertranscription in males, to a small extent, manifest themselves in females (Zhang and Oliver 2010).
The distribution of active chromatin states across the D. miranda genome differs for different sequence features and among chromosomes (Fig. 4). State 1 is enriched at genes, particularly at their 5′ end, in both sexes. State 2 is also enriched within genes but with a 3′ bias, consistent with its enrichment for the transcription elongation mark H3K36me3 (Fig. 4B). State 3 is enriched in the 5′ region of genes, but underrepresented in gene bodies. State 4, which is highly enriched on male X chromosomes, shows enrichment within genes and at their 3′ ends. This is consistent with the observed 3′ bias of MSL-binding along genes (Alekseyenko et al. 2008), and the MSL-complex inducing H4K16ac at male X-linked genes. All of these states are enriched at transcribed genes, but not silent ones (Fig. 4C).
Figure 4.

Distribution of chromatin states in D. miranda across genomic features and gene bodies. (A) Proportion of different chromatin states across chromosomes and different functional categories. (B) Enrichment of chromatin states across all genes (size-normalized, indicated by gray box), including 1 kb 5′ and 3′ of CDS. (C) Frequency of each chromatin state across size-normalized genes (including 1 kb 5′ and 3′ of CDS) categorized by RNA-seq as expressed or silent (FPKM > 1 or FPKM < 1).
In general, the distribution of active chromatin states along genes is similar across chromosomes in females, i.e., X chromosomes and autosomes show similar chromatin state profiles. In males, the X and the autosomes differ from each other, and neither matches the chromatin profiles of females (Fig. 4B,C). Specifically, the distribution of chromatin state 2 in females resembles that of male autosomes but is basically absent on the male X, while the distribution of chromatin state 4 in females resembles that of the male X chromosomes (although enriched at a lower level) but is largely absent from male autosomes. Thus, chromatin-mediated dosage compensation of the male X chromosome appears to generally redistribute activating chromatin marks genome wide, even on autosomes. In particular, our data suggest that the H4K16ac modification may be sequestered preferentially to X-linked genes in males and diluted away from potential autosomal targets.
Heterochromatin marks in males vs. females
Epigenetic sex differences have been observed in D. melanogaster. Depending on different Y-chromosome backgrounds, males differ in their propensity to silence a heterochromatin-sensitive reporter gene (Lemos et al. 2010; Zhou et al. 2012), and RNAi knockdown of the heterochromatin protein HP1 preferentially reduces male viability (Liu et al. 2005). Position-effect variegation (PEV), the partial silencing of reporter genes in some cells that normally express a gene resulting in mosaic expression patterns, is often used as an indicator of the local heterochromatin environment, and frequently shows dose-dependent effects (Girton and Johansen 2008). This dosage sensitivity demonstrates the importance of a stoichiometric balance among protein components in the formation of heterochromatin. Males contain a Y chromosome that is highly heterochromatic and may shift this balance by acting as a sink for heterochromatin proteins (Yasuhara and Wakimoto 2008; Lemos et al. 2010; Zhou et al. 2012). This could mean that the genome-wide heterochromatin/euchromatin balance differs between the sexes. In particular, if the Y chromosome sequesters proteins associated with heterochromatin formation, females might have higher levels of heterochromatin-like features in the rest of their genome as compared with males. Females generally show a higher degree of silencing in assays for PEV, suggesting that normally euchromatic regions are more prone to acquire a heterochromatic structure in females (Wallrath and Elgin 1995; Girton and Johansen 2008). Indeed, a significantly larger fraction of the assembled, mostly euchromatic part of the genome is in chromatin states 5 or 6 (heterochromatin or polycomb repression) in females relative to males (Figs. 2A, 4A) (P < 2.2 × 10⁻¹⁶, Fisher’s exact test). Overall, 10.2% of the genome is associated with the H3K9me2 state (state 6) in females, and only 5.8% in males, and 15.3% is associated with the H3K27me3 state (state 5) in females, and 10.7% in males. Females thus have 1.8× as much heterochromatin overall than males and 1.4× as much polycomb overall in the euchromatic portion of the genome. A similar excess of H3K9me2 is seen in the assembled portion of the genome in D. melanogaster females relative to males (Supplemental Fig. S18A).
Heterochromatin is recruited to regions with high repeat densities, resulting in a correlation between repetitive DNA sequence and the propensity of a genomic region to adopt a heterochromatic appearance (Dorer and Henikoff 1994; Pimpinelli et al. 1995; Lippman et al. 2004; Sentmanat and Elgin 2012). Indeed, we find that genomic regions that are heterochromatic in both males and females have highly increased transposable element densities compared with genomic regions that are not associated with H3K9me2 in either sex (transposable element densities of 21% vs. 6%, P < 2.2 × 10⁻¹⁶, Fisher’s exact test) (Supplemental Fig. S19).
Interestingly, the genomic regions that are heterochromatic (state 6) only in males (∼1.6 Mb) show transposable element densities slightly lower but similar to those regions that are heterochromatic in both sexes (transposable element densities of 16% vs. 21%), while genomic regions that are heterochromatic in females only (∼9.6 Mb) display intermediate levels of repeat density (13.8%). This pattern supports the idea that transposable elements trigger heterochromatin formation and that the euchromatin/heterochromatin balance differs between the sexes (Yasuhara and Wakimoto 2008; Lemos et al. 2010; Zhou et al. 2012). Regions of intermediate repeat content may not be able to initiate or propagate heterochromatin formation in males, as the repeat-rich Y may sequester the structural components required for heterochromatin formation, but heterochromatin may form in these regions of increased repeat density in females. Thus the global landscape of repressive chromatin differs between the sexes and manifests itself mainly in regions of intermediate repeat content that can trigger heterochromatin formation or spreading more easily in females than in males.
Sex-biased expression vs. chromatin states
Many genes are expressed differently between the sexes, and we were interested in whether genes with sex-biased expression show sex-specific differences in chromatin. That is, genes that show sex-biased expression may be in an active chromatin state in the sex in which they are expressed more highly, and a repressive state in the opposite sex. To evaluate whether differences in chromatin state contribute to sex-biased expression patterns, we (1) identified regions of the genome that are in a different chromatin state in males and females, and compared their expression between the sexes; (2) identified genes that are differentially expressed between male and female larvae (genes with sex-biased or sex-specific expression) and compared their chromatin profiles.
We classified genes according to their chromatin state as being in an active chromatin environment in both sexes (i.e., states 1–3; note that we did not include genes belonging to state 4 since they are expressed at an intermediate level; see Supplemental Fig. S16), being in a silent or repressive state in both sexes (states 5–7), and being active in one sex and silent or repressed in the other (Fig. 5A). As expected, we find that genes that are in an active chromatin environment in both sexes are expressed at a higher level than those that are in a silent/repressive state (Fig. 5A) (P < 2.2 × 10⁻¹⁶ for both female and male active vs. repressed genes, Wilcoxon test). However, levels of gene expression in males and females are similar (and not significantly different) at genes that are in an active chromatin environment in one sex, and a repressive state in the other (Fig. 5A). We estimate that only 9% of genes that are in an active chromatin state in one sex but a repressed chromatin state in the other show the expected bias in expression, which is not statistically different from the overall frequency of sex-biased genes (P = 0.18, Fisher’s exact test). Thus, sex-specific differences in the chromatin state of genes do not manifest themselves as sex-specific expression patterns.
Figure 5.

Sex-specific chromatin states and gene expression in D. miranda. (A) Female (pink) and male (blue) expression of genes (measured as log2 FPKM) categorized in active chromatin in both sexes (states 1–3), active in one sex but not the other, or repressive chromatin in both sexes (states 5–7). (B) Chromatin states of genes in females (top) and males (bottom) that are expressed similarly in both sexes or expressed in a sex-specific manner. Expressed unbiased genes are those expressed (FPKM > 1, cutoff based on intergenic expression levels) in both sexes, with the ratio of expression between the two sexes <2. Sex-specific genes are those genes that are expressed in one sex (FPKM > 1) but not expressed in the other (FPKM < 1).
Using gene expression data from male and female larvae, we identified 679 male-specific and 874 male-biased genes, and 95 female-specific and 362 female-biased genes, and characterized their chromatin state in both sexes. We find that genes that are expressed at a similar level in both sexes are highly enriched for active chromatin marks (Fig. 5B). In contrast, genes with sex-biased or sex-specific expression show no marked differences in their histone profiles between sexes, and are in fact not enriched for activating histone marks at all, in either sex (Fig. 5B; Supplemental Fig. S20). We find that only 1.6% of genes that have sex-specific or sex-biased expression have the expected sex-specific chromatin state, which is actually less than expected from the overall frequency of sex-specific active or repressed chromatin (2.7%; P = 0.003, Fisher’s exact test). Instead, genes with either male- or female-biased expression are most often in the background state 7, suggesting that they are not targeted by any of the histone modifications surveyed here, despite being highly transcribed. This could reflect a general difference in the chromatin signature of genes with housekeeping function vs. genes with a more restricted function (such as sex-specific/sex-biased or tissue-specific/tissue-biased genes). Indeed, comparing tissue-specific genes to genes that are broadly expressed (as defined by the tissue-specificity index tau), we find a similar difference in their chromatin profile with that of unbiased and sex-biased genes (Fig. 2C; Supplemental Fig. S20). Additionally, sex-specific genes (and also sex-biased genes, to a lesser extent) show higher tissue specificity than genes that show similar expression in the two sexes (Supplemental Fig. S21). Thus, tissue specificity of sex-biased genes appears to dominate their chromatin landscape, and not their sex-biased expression patterns.
To conclude, while there are more than a thousand genes that show sex-specific or sex-biased expression, these expression differences do not manifest themselves at the chromatin level between sexes, at least not for the histone marks studied here. Instead, genes with sex-limited or sex-biased expression have chromatin profiles that differ from broadly transcribed housekeeping genes and resemble that of other tissue-specific genes.
Comparisons of the chromatin landscape of D. miranda vs. D. melanogaster
To investigate the evolutionary dynamics of chromatin states, we compared various aspects of the chromatin landscape between D. miranda and D. melanogaster. Genome wide, the chromatin landscape looks largely similar between the two species (Supplemental Fig. S22).
We categorized genes >1 kb in both species by the chromatin state at their transcription start site (see Methods). Genes without an ortholog in the other species were found more often to be in a repressive chromatin state (states 5–7) than genes shared between species (50% of D. melanogaster genes with no ortholog and 47% of D. miranda genes with no ortholog vs. 29% of orthologs in D. melanogaster and 28% of orthologs in D. miranda) (Fig. 6A). We classified the subset of genes that have orthologs in both species (7159 genes) as either conserving their chromatin state (a gene is in the same chromatin state in D. melanogaster and both male and female D. miranda) or not conserving their chromatin state (a gene is in a different chromatin state in D. melanogaster than it is in both male and female D. miranda). We found that genes whose chromatin state is conserved across the two species have many characteristics of housekeeping genes (Fig. 6). Genes with a conserved chromatin state are enriched for active chromatin states, especially state 1, while genes that do not have a conserved chromatin state are depleted for active chromatin states as compared with the set of all orthologous genes examined (P < 2.2 × 10⁻¹⁶ for all three samples, Fisher’s exact test) (Fig. 6B). Genes with a conserved chromatin state have higher expression levels (Fig. 6C) and also have broader expression across tissues (as measured by the tissue-specificity index tau) (Fig. 6D) than genes whose chromatin state is not conserved. Finally, genes with a conserved chromatin state across species have lower Ka/Ks values than the set of all orthologous genes, while genes whose chromatin state is not conserved have higher Ka/Ks values (Fig. 6E). Thus, there is an association between sequence divergence and chromatin turnover across species; however, it remains to be determined whether chromatin turnover results directly from DNA divergence, or whether DNA and chromatin divergence both reflect lower functional constraint at fast-evolving genes. To conclude, genes that have conserved their chromatin states across species tend to be highly and widely expressed, with low rates of protein evolution. All of these patterns hold true if the sexed D. miranda data are computationally merged to resemble the unsexed D. melanogaster ChIP-seq data (Supplemental Fig. S23).
Figure 6.
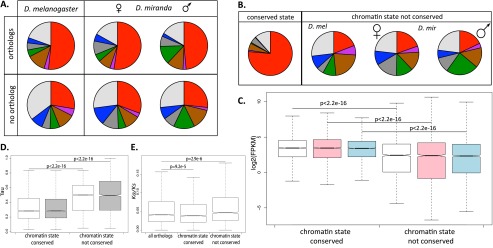
Conservation of chromatin states of genes in D. miranda and D. melanogaster. (A) Chromatin state of orthologous and nonorthologous genes in D. miranda females and males and D. melanogaster. Orthologous genes defined by FlyBase. (B) Chromatin states of orthologous genes whose state is conserved across species and sexes (left), and those whose state is not conserved (right). (C) Expression levels (log2[FPKM]) of orthologous genes with conserved and not conserved chromatin state (D. melanogaster in white, D. miranda males in blue, D. miranda females in pink). (D) Tissue specificity (measured by the tissue-specificity index tau) of genes with conserved and not conserved chromatin state in D. melanogaster (white) and D. miranda (gray). (E) Rates of protein evolution (Ka/Ks) of genes with conserved and not conserved chromatin state between D. melanogaster and D. miranda.
We then looked at the number of genes that conserve their chromatin state between sexes vs. between species (Supplemental Fig. S24). Genes in all seven states show a higher level of conservation across all three samples than what would be expected by chance based on a permutation test (see Methods). Globally, we find that genes in state 1 are most conserved across species and sexes: Of all genes present in state 1 in either data set (3905 total), 76% are in state 1 in all three samples, representing an additional 1973 genes shared among all samples than expected by chance, and only 6.5% are restricted to a single sample (vs. 19% expected to be restricted to a single sample, P < 0.001, permutation test). The least conserved state within orthologous genes, on the other hand, is the heterochromatin-associated state 6: Only 4% of the 368 genes assigned to this state in either sample are shared among all three samples, representing only 13 additional shared genes over random expectation, and 60% are restricted to a single sample (vs. 62% expected by chance, P = 0.087, permutation test). The second least conserved state is state 4 (H4K16ac only), with 4% of the 798 genes classified in this state shared among all samples (only 24 additional genes over neutral expectation) and 57% unique to a sample (vs. 56% expected, P = 0.91, permutation test). For many states, the fraction of genes in the same state between D. melanogaster and D. miranda is similar to that between male and female D. miranda (state 1: 84% vs. 85%; state 2: 31% vs. 36%; state 3: 43% vs. 48%; state 4: 19% vs. 29%; state 5: 35% vs. 53%; state 6: 12% vs. 32%; state 7: 48% vs. 50%), i.e., there is roughly similar sharing in chromatin states between species as there is between sexes. The main exception here are genes in the polycomb and constitutive heterochromatin state (states 5 and 6) where males and females within D. miranda are considerably more similar than they are to D. melanogaster. This could reflect lineage-specific divergence in underlying developmental pathways causing lineage-specific silencing of polycomb target genes and evolution of lineage-specific heterochromatin, but could also result from differing ChIP efficiencies in the two species, especially for H3K27me3 (Supplemental Fig. S12). State 4, representing the H4K16ac-only state, also shows more similarity in males and females of D. miranda than it does across species, likely reflecting the fact that two chromosomal arms are sex-linked in D. miranda but autosomal in D. melanogaster. In general, however, we find that males and females from the same species and with a nearly identical genome sequence are almost as similar to each other at the chromatin level as they are to a species from which they diverged >30 MY ago and which shows high levels of sequence divergence (Richards et al. 2005).
In both species, housekeeping genes are mainly in an active chromatin state, while tissue-specific genes show a relative enrichment for repressive chromatin states, especially the background state 7 (Supplemental Fig. S25). However, both housekeeping and tissue-specific genes show higher levels of conservation of chromatin state across species than expected by chance. Housekeeping genes conserve their mainly active chromatin state in both species (Supplemental Figs. S26, S27); ∼73% of housekeeping genes have the same state in D. melanogaster and D. miranda (vs. 68% expected by chance, P < 0.001, permutation test), while ∼33% of tissue-specific genes have the same chromatin state in both species (vs. 20% expected by chance, P < 0.001, permutation test). We also find that there is considerable variation in conservation of chromatin states across chromosomes and sexes (Supplemental Fig. S28). Autosomes show similar levels of chromatin conservation for males and females, males show a higher level of conservation on the chromosomal arm that is X-linked in both species (X in D. melanogaster, XL in D. miranda), while females share the same chromatin state as D. melanogaster more often than males on XR and the neo-X (which are autosomal in D. melanogaster), reflecting the recruitment of histone modifications associated with dosage compensation to these chromosomes in male but not female D. miranda.
To evaluate the contribution of chromatin state to expression divergence, we classified genes according to their chromatin state in male and female D. miranda and in D. melanogaster, and then compared their expression patterns. As expected, we find that genes located in an active chromatin environment in both D. miranda and D. melanogaster are expressed at a higher level in both species than those that are in a silent/repressive state (Fig. 7) (P < 2.2 × 10⁻¹⁶, Wilcoxon test). Further, we also find that genes that are in different chromatin states in the two species are expressed more highly in the species where they reside in active chromatin, although the difference is not always statistically significant (Fig. 7A,B). We used gene expression data from D. melanogaster mixed-sex larvae and male and female D. miranda larvae to identify 2524 genes that are expressed at a similar level in both species, 751 genes that are silent in both species, 378 genes that are expressed exclusively in D. melanogaster, and 199 D. miranda-specific genes (Fig. 7C), and characterized which histone marks they are associated with in both species. We find that genes that are expressed at a similar level in both species are highly enriched for active chromatin marks (Fig. 7C), while nontranscribed genes are enriched for the background chromatin state (and also polycomb in D. miranda; see Supplemental Fig. S29 for genes with species-biased expression levels). Genes with species-specific expression patterns are most often found in the silent background state, which mimics the chromatin profile of tissue-specific genes, and indeed, we find that genes that are expressed in both species are generally more broadly expressed, and genes that are expressed only in one species or silent in both tend to be expressed in fewer tissues (Supplemental Figs. S30, S31). Nevertheless, we find that genes with D. melanogaster-specific expression tend to be more often in an active chromatin state (states 1–3) in D. melanogaster relative to D. miranda (41% are active in D. melanogaster vs. 30% in D. miranda females and 28% in D. miranda males, P < 0.003, Fisher’s exact test), and genes expressed specifically in D. miranda likewise tend to more often be in active chromatin in D. miranda than D. melanogaster (although the difference is small and not statistically significant; 36% are active in D. melanogaster vs. 38% in D. miranda females and males, P = 0.2; Fisher’s exact test) (Fig. 7C). Again, all of these patterns remain if the sexed D. miranda data are computationally merged to resemble the unsexed D. melanogaster ChIP-seq data (Supplemental Fig. S32). We quantified the contribution of chromatin-state turnover to lineage-specific gene expression as the fraction of genes with lineage-specific expression that show the expected difference in chromatin state (e.g., D. melanogaster-specific genes that are in an active state in D. melanogaster and a repressed state in D. miranda). We estimate that almost 25% of species-specific expression is accompanied by the expected change in chromatin state (P < 2.2 × 10⁻¹⁶, Fisher’s exact test). Additionally, when we interrogate the fraction of genes that are in an active state in one species but a repressed state in the other, we find that ∼26% of these genes show the expected direction of expression bias or specificity, as compared with ∼8% of genes that would be expected to show these expression patterns due to chance (P < 2.2 × 10⁻¹⁶, Fisher’s exact test). Thus, while sex-specific expression patterns appear not to manifest themselves at the chromatin level, we find that differences in the chromatin landscape between species are associated with lineage-specific expression patterns for a fraction of orthologous genes.
Figure 7.
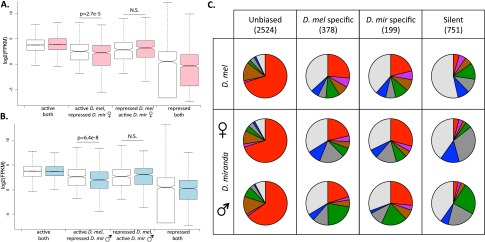
Species-specific chromatin states and gene expression. (A) D. melanogaster (white) and D. miranda female (pink) expression of genes categorized in active chromatin in both species (states 1–3), active in one species but not the other, or in repressive chromatin in both species (states 5–7). Genes in active chromatin in both species are significantly more highly expressed than genes that are in an active state in only one species (P < 2.6 × 10⁻⁶ for all comparisons, Wilcoxon test). (B) Same as A but comparing D. melanogaster with D. miranda male (blue). Genes in active chromatin in both species are significantly more highly expressed than genes in an active state in only one species (P < 3 × 10⁻⁴ for all comparisons, Wilcoxon test). (C) Chromatin states of genes expressed similarly in both species, genes expressed in one species but not the other, and genes not expressed in either species. Only genes with unbiased expression between male and female D. miranda were considered.
Conclusions
Using six histone modifications, we have identified different active and repressive chromatin domains in males and females of D. miranda. Genome wide, the conservation of chromatin state of genes between male and female D. miranda is ∼74%, and among genes with an ortholog in D. melanogaster, males and females share the same chromatin state in 75% of genes. These differences are not simply driven by dosage compensation of the hemizygous male X chromosomes alone, where widespread differences in chromatin structure between males and females are expected; nearly 19% of autosomal genes also have a different chromatin state in male and female D. miranda. Nevertheless, our data are compatible with the hypothesis that most differences in the chromatin landscape between sexes are a direct or indirect consequence of sex chromosomes. In particular, both the dose (for the X) and the presence (for the Y) of sex chromosomes differ between males and females. The dosage-compensation machinery in male Drosophila alters the chromatin structure by inducing H4K16 acetylation at X-linked genes in males (Gelbart and Kuroda 2009), and we see a marked depletion of H4K16ac on male autosomes, relative to the X, or to H4K16ac levels on female autosomes. Thus, chromatin reorganization due to dosage compensation in males may have a genome-wide effect by redistributing active chromatin marks. The other sex chromosome, the Y, might also function as a sink for chromatin marks, in this case, repressive chromatin (Yasuhara and Wakimoto 2008; Lemos et al. 2010; Zhou et al. 2012). In particular, we see less repressive chromatin in the assembled, mostly euchromatic portion of the genome in males, and we find a higher density of transposable elements in male heterochromatin than in heterochromatic regions found only in females. These findings are consistent with a model in which the heterochromatic Y chromosome induces a global reorganization of repressive marks in males compared with females (Yasuhara and Wakimoto 2008; Lemos et al. 2010; Zhou et al. 2012), and dilutes these marks away from genomic regions with less heterochromatic characteristics (i.e., slightly lower repeat densities) in males. Our results suggest that differences in chromatin structure between males and females extend genome-wide and are not limited to the sex chromosomes, although the heterochromatic Y and the dosage compensated X may be ultimately responsible for global changes in chromatin structure (Yasuhara and Wakimoto 2008; Gelbart and Kuroda 2009; Lemos et al. 2010; Zhou et al. 2012). This view of the sex-specific chromatin landscape being largely a consequence of a stoichiometric redistribution of active and repressive chromatin marks is in line with our observation that sex-specific chromatin states do not explain sex-specific expression patterns. Instead, most genes with sex-specific or sex-biased gene expression are not targeted by any of the histone modifications assayed in either sex, and their chromatin profile largely resembles that of tissue-specific genes. Previous studies have suggested that many sex-biased genes are tissue specific, and that tissue-specific genes have a distinct chromatin structure that is characterized by a lack of H3K36me3 binding despite showing appreciable expression levels (Filion et al. 2010; Assis et al. 2012). Thus, while most sex-biased genes are unbound by the six histone marks that we assayed, profiling of additional chromatin marks may allow a better understanding of the relationship between sex-specific chromatin structure and sex-biased gene expression.
Unlike for sex-specific chromatin, we find that lineage-specific differences in the chromatin landscape do contribute to expression divergence between species. We find that ∼62% of orthologous genes have the same chromatin state in D. melanogaster and D. miranda. The level of conservation of chromatin states between these two species is similar in magnitude to that observed between males and females of D. miranda (75% of orthologous genes are in the same chromatin state between sexes), despite the genome of male and female D. miranda being nearly identical, while D. miranda and D. melanogaster diverged >30 MY ago and are highly divergent at the DNA sequence level (Richards et al. 2005). Studies in primates have also indicated that chromatin states may be relatively stable over evolutionary time (Bradley et al. 2010; Cain et al. 2011). The high level of chromatin conservation between Drosophila species might be especially surprising given that two chromosome arms are sex linked in D. miranda but autosomal in D. melanogaster, and genes on these chromosomes show comparatively poor conservation of chromatin state. Thus, species that share the same sex chromosome karyotype might show even higher levels of conservation of chromatin states. Future studies contrasting individuals within a species, and species at different divergence levels and with different sex chromosome karyotypes will help to shed light on the evolution of chromatin structure.
Methods
ChIP-seq data
We analyzed ChIP-seq data from six histone marks (H3K27me3, H3K36me3, H3K4me1, H3K4me3, H3K9me2, and H4K16ac) and an input control for unsexed third instar larvae of D. melanogaster and sexed male and female third instar larvae separately for D. miranda. Data for D. melanogaster were obtained from modENCODE, and data for H3K27me3, H3K36me3, H3K9me2, and H4K16ac for D. miranda male and female larvae were obtained from Alekseyenko et al. (2013) and Zhou et al. (2013). To obtain H3K4me1 and H3K4me3 ChIP-seq data, and replicate data for H4K16ac and H3K9m2, we sexed third instar larvae of D. miranda, and followed the protocol of Alekseyenko et al. (2013) and Zhou et al. (2013) to isolate chromatin and perform ChIP-seq. Briefly, chromatin was isolated from 0.5 g sexed third instar larvae, cross-linked using formaldehyde, and sheared by sonication. Chromatin pull-down was performed with Dynabeads Protein G (Life Technologies, 10003D) following overnight incubation with antibody against either H3K4me1 (5 µL per immunoprecipitation, Abcam ab8895), H3K4me3 (5 µL per immunoprecipitation, Abcam ab8580), H4K16ac (5 µL per immunoprecipitation, Millipore 07-329), or H3K9me2 (5 µL per immunoprecipitation, Abcam ab1220). Immunoprecipitated DNA was then purified and libraries were prepared according to the standard Illumina HiSeq protocol. Paired-end 100-bp DNA sequencing was performed on the Illumina HiSeq 2000 at the Vincent J. Coates Genomics Sequencing Laboratory at the University of California, Berkeley.
ChIP-seq data analysis
ChIP-seq reads from the six histone marks and an input control for unsexed D. melanogaster larvae were mapped to the D. melanogaster release 5 assembly using Bowtie 2 (Langmead and Salzberg 2012). First, we called regions of significant enrichment using ChromHMM (“BinarizeBed” function) for the entire genome, and then for only the autosomes; the enrichment profiles from all chromosomes were then combined (Ernst and Kellis 2012). We then used ChromHMM to learn models with different numbers of chromatin state by learning a multivariate hidden Markov model. Since we used the nine-state model from Kharchenko et al. (2011) to validate our chromatin models, we set nine as an upper bound on the number of chromatin states that we could reliably learn from our subset of histone modifications. However, we did not achieve good concordance with our model and the published nine-state model until we reduced the number of states to seven, at which point we saw good agreement between the two models, i.e., the states from our seven-state model mostly correspond to either a single or two combined states from the nine-state model (Supplemental Figs. S1–S3).
ChIP-seq reads from the six histone marks and an input control for male and female D. miranda larvae were first clipped to remove any adapter sequences. Then, the unmapped reads were down-sampled in the sex with more initial reads to match the number of reads in the other sex. Reads were then mapped to the assembled D. miranda genome using Bowtie 2 (Langmead and Salzberg 2012). To remove any reads that mapped to the neo-Y chromosome (which shows high levels of sequence similarity to the neo-X), any read (or its mate) that overlapped a diagnostic neo-Y SNP was removed from further analysis (Zhou et al. 2013). These filtered reads were then used to call regions of significant enrichment using ChromHMM (“BinarizeBed” function) first for the entire genome, and then for only the autosomes; the enrichments from all chromosomes were then combined and the chromatin model learned from D. melanogaster was used to assign each genomic region to one of the seven chromatin states (Ernst and Kellis 2012).
We evaluated our strategy of calling chromatin states for autosomes and sex chromosomes separately by comparing the differences in chromatin state between male and female D. miranda both when we binarized sex chromosomes and autosomes separately (“bin separately”) and when we binarized the entire genome simultaneously (“bin together”). We found that binning separately was the more conservative strategy in evaluating the sex-specific chromatin landscape in that the magnitude of difference between males and females was lower for all states on the autosomes than when the data were binned together (Supplemental Fig. S5). The differences between the sexes were slightly higher on the neo-X for states 4 and 5 when the data were binned separately, but significantly lower for states 2 and 6, also consistent with binning separately being a more conservative way to estimate differences in the chromatin landscape between the sexes.
ChIP efficiency was evaluated by calculating the fraction of all mappable reads that mapped within each of the seven chromatin states. We then calculated the enrichment for each chromatin state by normalizing the fraction of reads that mapped to each state by the genome-wide proportion of each state. This allowed us to compare the ChIP efficiency of each mark across all three samples, since each chromatin annotation was generated from the same seven-state model learned from D. melanogaster (Supplemental Figs. S11, S12).
To evaluate whether comparing mixed-sex D. melanogaster data to sexed D. miranda data influenced our conclusions on the turnover of chromatin across species, we simulated mixed-sex D. miranda data by merging the reads from the down-sampled (i.e., equal number) male and female samples for all six histone marks and the input controls. We then called chromatin states for autosomes and sex chromosomes separately as described above, and used the seven-state chromatin model learned from the D. melanogaster data to define the mixed-sex chromatin landscape. We then classified genes by chromatin state as described below, and reanalyzed various aspects (chromatin state, gene expression, tissue specificity, Ka/Ks) of genes that conserved their chromatin state across the two species (Supplemental Fig. S23). We also looked at the correlation between species-specific expression and species-specific chromatin (Supplemental Fig. S32).
Western blotting and quantification
Sexed third instar larvae were lysed and homogenized in Triton Extraction Buffer (PBS at pH 7.4 with 0.5% Triton X-100, 2 mM phenylmethylsulfonyl fluoride, and 0.02% sodium azide) and histones were acid-extracted in 0.2 N HCl overnight. Acid-extracted histones were then run on a 4%–12% gradient Bis-Tris gel (Invitrogen) and blotted onto a nitrocellulose membrane. Antibodies for H3K9me2 (Abcam 1220), H3K27me3 (Abcam 6002), H3K36me3 (Abcam 9050), H4K16ac (Millipore 07-329), and actin (Abcam 1801) were all incubated at a dilution of 1:1000 in Hikari Signal Enhancer (Nacalai). Westerns blots were imaged and protein levels quantified using the Licor Odyssey software.
ChIP-qPCR
Approximately 0.5 g of sexed third instar larvae were flash-frozen in liquid nitrogen and chromatin was prepared by cross-linking with formaldehyde followed by shearing by sonication. Chromatin was immunoprecipitated using 5 μL anti-H3K9me2 (Abcam 1220) or 5 μL anti-H4K16ac (Millipore 07-329) followed by pull-down with Dynabeads Protein G (Invitrogen 10003D). Crosslinks were reversed by incubating overnight at 65°C, and samples were extracted with phenol:chloroform. Genomic targets for qPCR were selected from the repeat-masked genome; we assayed eight regions not bound by any of the four histone marks assayed, eight regions bound by H3K9me2 in both sexes, four regions bound by H3K9me2 in females but not males, eight regions bound by H4K16ac in both sexes, four regions bound by H4K16ac in females but not males, and four regions bound by H4K16ac in males but not females. qPCR was performed using the KAPA SYBR FAST qPCR master mix (KAPA Biosystems 4600) and the data was analyzed using the Applied Biosystems StepOnePlus Real-Time PCR System (Invitrogen). ChIP enrichment was calculated as percent input by first calculating the normalized Ct of the ChIP as ΔCt norm = Ct ChIP – (Ct input – log2(input dilution factor)) where the input dilution factor was 2.5 in this experiment. The percent input could then be calculated as 2- ΔCt norm. Each PCR product was visualized on an agarose gel to confirm that there was a single amplicon and no primer-dimer.
Categorizing genes by chromatin state
Similar to the procedure used in Kharchenko et al. (2011), we categorized genes by chromatin state if they were longer than 1 kb, the resolution at which our chromatin model was learned. We then categorized genes as being in the chromatin state of their transcription start site.
To evaluate whether the overlap of genes in each state was significantly enriched or depleted between all three samples (D. melanogaster and male and female D. miranda), we performed a permutation test. For each permutation, we shuffled the chromatin state of the genes for all three samples, keeping the same total number of genes in each state as in our observed data. For each of 1000 permutations, we calculated the proportion of genes in each state that were shared across all three samples, or that were restricted to a single sample, and compared the observed proportion with those generated by permutations to generate P-values. To generate expected values, we calculated the average proportion of genes in a given state that were shared across all three samples or restricted to a single sample across all permutations.
Replicate ChIP-seq data sets
We used two independent methods to calculate the level of correlation between male and female ChIP experiments. First we called peaks for each mark in each sample individually using MACS (Zhang et al. 2008). We then defined the top 40% of peaks for each histone modification for each sex based on average enrichment over the input, and calculated the fraction of peaks that were also called as peaks in the opposite sex (Supplemental Fig. S10A). Histone marks with at least 80% of the top 40% of their peaks present in the opposite sex were considered adequately replicated, as described in Kharchenko et al. (2011). As an independent measure of replication, we also calculated the mean enrichment over the input in 10-kb intervals across the genome for each histone modification for both males and females. We then calculated the Spearman correlation between male and female experiments for each histone modification (Supplemental Fig. S10B).
Since all histone modifications except H3K9me2 and H4K16ac showed very high levels of correlation between sexes (Supplemental Fig. S10), and since we found marked differences between males and females in chromatin states involving H3K9me2 and H4K16ac binding, we produced replicate ChIP-seq data sets for male and female D. miranda third instar larvae for these two marks. The data were normalized and mapped as for the other data sets, as described above. We then substituted the published H3K9me2 and H4K16ac data sets with our replicate data sets and re-ran ChromHMM as described, still with all six histone modifications but with different H3K9me2 and H4K16ac data sets. We found that the sex-biased distribution of these marks was consistent across both data sets (Supplemental Fig. S9).
Gene expression and tissue specificity
RNA-seq reads from sexed third instar D. miranda larvae were mapped to the assembled genome using TopHat (Trapnell et al. 2009). To be conservative in making comparisons in expression level between males and females, we equalized the number of mapped reads by subsampling the reads of the sex with higher coverage (in this case, males). We then used Cufflinks to estimate transcript abundances, measured as FPKMs. For D. melanogaster, reads generated from mixed-sexed third instar larvae were mapped to the D. melanogaster release 5 assembly using TopHat, and Cufflinks (Trapnell et al. 2012) was used to estimate transcript abundances. The cutoff for expressed genes was set at FPKM = 1 based on the transcription level of intronic regions. Sex-specific genes were defined as those genes expressed in one sex (FPKM > 1) but not expressed in the other sex (FPKM < 1); sex-biased genes were defined as genes expressed in both sexes (FPKM > 1), but where the expression level in one sex was at least twice as high as the expression level in the other sex.
To calculate the tissue-specificity index tau, we used published expression data from seven tissues (female body, female head, ovary, male body, male head, testis, and accessory gland) from D. melanogaster and D. pseuodoobscura, a close relative of D. miranda (Assis et al. 2012). Tau is calculated for each gene by
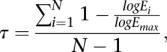 |
where N is the number of tissues, Ei is the expression in tissue i, and Emax is the maximum expression of the gene in all tissues. Tau is only calculated for genes that are expressed in at least one tissue, so any gene that is not expressed in any of the seven tissues assayed was not included in analyses of tissue specificity.
Data access
The ChIP-seq data generated in this study have been submitted to the NCBI Sequence Read Archive (SRA; http://www.ncbi.nlm.nih.gov/sra/) under accession number SRP040696.
Acknowledgments
This research was funded by NIH grants (R01GM076007 and R01GM093182) and a Packard Fellowship to D.B.
Footnotes
[Supplemental material is available for this article.]
Article published online before print. Article, supplemental material, and publication date are at http://www.genome.org/cgi/doi/10.1101/gr.172155.114.
References
- Alekseyenko AA, Larschan E, Lai WR, Park PJ, Kuroda MI 2006. High-resolution ChIP-chip analysis reveals that the Drosophila MSL complex selectively identifies active genes on the male X chromosome. Genes Dev 20: 848–857 [DOI] [PMC free article] [PubMed] [Google Scholar]
- Alekseyenko AA, Peng S, Larschan E, Gorchakov AA, Lee OK, Kharchenko P, McGrath SD, Wang CI, Mardis ER, Park PJ, et al. 2008. A sequence motif within chromatin entry sites directs MSL establishment on the Drosophila X chromosome. Cell 134: 599–609 [DOI] [PMC free article] [PubMed] [Google Scholar]
- Alekseyenko AA, Ellison CE, Gorchakov AA, Zhou Q, Kaiser VB, Toda N, Walton Z, Peng S, Park PJ, Bachtrog D, et al. 2013. Conservation and de novo acquisition of dosage compensation on newly evolved sex chromosomes in Drosophila. Genes Dev 27: 853–858 [DOI] [PMC free article] [PubMed] [Google Scholar]
- Assis R, Zhou Q, Bachtrog D 2012. Sex-biased transcriptome evolution in Drosophila. Genome Biol Evol 4: 1189–1200 [DOI] [PMC free article] [PubMed] [Google Scholar]
- Bachtrog D 2005. Sex chromosome evolution: Molecular aspects of Y-degeneration in Drosophila. Genome Res 15: 1393–1401 [DOI] [PMC free article] [PubMed] [Google Scholar]
- Bachtrog D 2006. A dynamic view of sex chromosome evolution. Curr Opin Genet Dev 16: 578–585 [DOI] [PubMed] [Google Scholar]
- Bachtrog D 2013. Y-chromosome evolution: emerging insights into processes of Y-chromosome degeneration. Nat Rev Genet 14: 113–124 [DOI] [PMC free article] [PubMed] [Google Scholar]
- Bachtrog D, Hom E, Wong KM, Maside X, de Jong P 2008. Genomic degradation of a young Y chromosome in Drosophila miranda. Genome Biol 9: R30. [DOI] [PMC free article] [PubMed] [Google Scholar]
- Bradley RK, Li XY, Trapnell C, Davidson S, Pachter L, Chu HC, Tonkin LA, Biggin MD, Eisen MB 2010. Binding site turnover produces pervasive quantitative changes in transcription factor binding between closely related Drosophila species. PLoS Biol 8: e1000343. [DOI] [PMC free article] [PubMed] [Google Scholar]
- Cain CE, Blekhman R, Marioni JC, Gilad Y 2011. Gene expression differences among primates are associated with changes in a histone epigenetic modification. Genetics 187: 1225–1234 [DOI] [PMC free article] [PubMed] [Google Scholar]
- Charlesworth B, Charlesworth D 2000. The degeneration of Y chromosomes. Philos Trans R Soc Lond B Biol Sci 355: 1563–1572 [DOI] [PMC free article] [PubMed] [Google Scholar]
- Deng X, Koya SK, Kong Y, Meller VH 2009. Coordinated regulation of heterochromatic genes in Drosophila melanogaster males. Genetics 182: 481–491 [DOI] [PMC free article] [PubMed] [Google Scholar]
- Dorer DR, Henikoff S 1994. Expansions of transgene repeats cause heterochromatin formation and gene silencing in Drosophila. Cell 77: 993–1002 [DOI] [PubMed] [Google Scholar]
- Ellegren H, Parsch J 2007. The evolution of sex-biased genes and sex-biased gene expression. Nat Rev Genet 8: 689–698 [DOI] [PubMed] [Google Scholar]
- The ENCODE Project Consortium. 2012. An integrated encyclopedia of DNA elements in the human genome. Nature 489: 57–74 [DOI] [PMC free article] [PubMed] [Google Scholar]
- Ernst J, Kellis M 2012. ChromHMM: automating chromatin-state discovery and characterization. Nat Methods 9: 215–216 [DOI] [PMC free article] [PubMed] [Google Scholar]
- Ernst J, Kheradpour P, Mikkelsen TS, Shoresh N, Ward LD, Epstein CB, Zhang X, Wang L, Issner R, Coyne M, et al. 2011. Mapping and analysis of chromatin state dynamics in nine human cell types. Nature 473: 43–49 [DOI] [PMC free article] [PubMed] [Google Scholar]
- Filion GJ, van Bemmel JG, Braunschweig U, Talhout W, Kind J, Ward LD, Brugman W, de Castro IJ, Kerkhoven RM, Bussemaker HJ, et al. 2010. Systematic protein location mapping reveals five principal chromatin types in Drosophila cells. Cell 143: 212–224 [DOI] [PMC free article] [PubMed] [Google Scholar]
- Gelbart M, Kuroda M 2009. Drosophila dosage compensation: a complex voyage to the X chromosome. Development 136: 1399–1410 [DOI] [PMC free article] [PubMed] [Google Scholar]
- Girton JR, Johansen KM 2008. Chromatin structure and the regulation of gene expression: the lessons of PEV in Drosophila. Adv Genet 61: 1–43 [DOI] [PubMed] [Google Scholar]
- Kharchenko PV, Tolstorukov MY, Park PJ 2008. Design and analysis of ChIP-seq experiments for DNA-binding proteins. Nat Biotechnol 26: 1351–1359 [DOI] [PMC free article] [PubMed] [Google Scholar]
- Kharchenko PV, Alekseyenko AA, Schwartz YB, Minoda A, Riddle NC, Ernst J, Sabo PJ, Larschan E, Gorchakov AA, Gu T, et al. 2011. Comprehensive analysis of the chromatin landscape in Drosophila melanogaster. Nature 471: 480–485 [DOI] [PMC free article] [PubMed] [Google Scholar]
- Khil P, Smirnova N, Romanienko P, Camerini-Otero R 2004. The mouse X chromosome is enriched for sex-biased genes not subject to selection by meiotic sex chromosome inactivation. Nat Genet 36: 642–646 [DOI] [PubMed] [Google Scholar]
- Langmead B, Salzberg SL 2012. Fast gapped-read alignment with Bowtie 2. Nat Methods 9: 357–359 [DOI] [PMC free article] [PubMed] [Google Scholar]
- Larracuente AM, Sackton TB, Greenberg AJ, Wong A, Singh ND, Sturgill D, Zhang Y, Oliver B, Clark AG 2008. Evolution of protein-coding genes in Drosophila. Trends Genet 24: 114–123 [DOI] [PubMed] [Google Scholar]
- Larschan E, Alekseyenko AA, Gortchakov AA, Peng S, Li B, Yang P, Workman JL, Park PJ, Kuroda MI 2007. MSL complex is attracted to genes marked by H3K36 trimethylation using a sequence-independent mechanism. Mol Cell 28: 121–133 [DOI] [PubMed] [Google Scholar]
- Lemos B, Branco AT, Hartl DL 2010. Epigenetic effects of polymorphic Y chromosomes modulate chromatin components, immune response, and sexual conflict. Proc Natl Acad Sci 107: 15826–15831 [DOI] [PMC free article] [PubMed] [Google Scholar]
- Lippman Z, Gendrel A, Black M, Vaughn M, Dedhia N, McCombie W, Lavine K, Mittal V, May B, Kasschau K, et al. 2004. Role of transposable elements in heterochromatin and epigenetic control. Nature 430: 471–476 [DOI] [PubMed] [Google Scholar]
- Liu LP, Ni JQ, Shi YD, Oakeley EJ, Sun FL 2005. Sex-specific role of Drosophila melanogaster HP1 in regulating chromatin structure and gene transcription. Nat Genet 37: 1361–1366 [DOI] [PubMed] [Google Scholar]
- McManus CJ, Coolon JD, Duff MO, Eipper-Mains J, Graveley BR, Wittkopp PJ 2010. Regulatory divergence in Drosophila revealed by mRNA-seq. Genome Res 20: 816–825 [DOI] [PMC free article] [PubMed] [Google Scholar]
- Meiklejohn CD, Parsch J, Ranz JM, Hartl DL 2003. Rapid evolution of male-biased gene expression in Drosophila. Proc Natl Acad Sci 100: 9894–9899 [DOI] [PMC free article] [PubMed] [Google Scholar]
- Parsch J, Ellegren H 2013. The evolutionary causes and consequences of sex-biased gene expression. Nat Rev Genet 14: 83–87 [DOI] [PubMed] [Google Scholar]
- Pimpinelli S, Berloco M, Fanti L, Dimitri P, Bonaccorsi S, Marchetti E, Caizzi R, Caggese C, Gatti M 1995. Transposable elements are stable structural components of Drosophila melanogaster heterochromatin. Proc Natl Acad Sci 92: 3804–3808 [DOI] [PMC free article] [PubMed] [Google Scholar]
- Richards S, Liu Y, Bettencourt BR, Hradecky P, Letovsky S, Nielsen R, Thornton K, Hubisz MJ, Chen R, Meisel RP, et al. 2005. Comparative genome sequencing of Drosophila pseudoobscura: chromosomal, gene, and cis-element evolution. Genome Res 15: 1–18 [DOI] [PMC free article] [PubMed] [Google Scholar]
- Riddle NC, Minoda A, Kharchenko PV, Alekseyenko AA, Schwartz YB, Tolstorukov MY, Gorchakov AA, Jaffe JD, Kennedy C, Linder-Basso D, et al. 2011. Plasticity in patterns of histone modifications and chromosomal proteins in Drosophila heterochromatin. Genome Res 21: 147–163 [DOI] [PMC free article] [PubMed] [Google Scholar]
- Schulze SR, Wallrath LL 2007. Gene regulation by chromatin structure: paradigms established in Drosophila melanogaster. Annu Rev Entomol 52: 171–192 [DOI] [PubMed] [Google Scholar]
- Sentmanat MF, Elgin SC 2012. Ectopic assembly of heterochromatin in Drosophila melanogaster triggered by transposable elements. Proc Natl Acad Sci 109: 14104–14109 [DOI] [PMC free article] [PubMed] [Google Scholar]
- Steinemann S, Steinemann M 2005. Y chromosomes: born to be destroyed. Bioessays 27: 1076–1083 [DOI] [PubMed] [Google Scholar]
- Straub T, Becker PB 2007. Dosage compensation: the beginning and end of generalization. Nat Rev Genet 8: 47–57 [DOI] [PubMed] [Google Scholar]
- Trapnell C, Pachter L, Salzberg SL 2009. TopHat: discovering splice junctions with RNA-Seq. Bioinformatics 25: 1105–1111 [DOI] [PMC free article] [PubMed] [Google Scholar]
- Trapnell C, Roberts A, Goff L, Pertea G, Kim D, Kelley DR, Pimentel H, Salzberg SL, Rinn JL, Pachter L 2012. Differential gene and transcript expression analysis of RNA-seq experiments with TopHat and Cufflinks. Nat Protoc 7: 562–578 [DOI] [PMC free article] [PubMed] [Google Scholar]
- Vicoso B, Bachtrog D 2009. Progress and prospects toward our understanding of the evolution of dosage compensation. Chromosome Res 17: 585–602 [DOI] [PMC free article] [PubMed] [Google Scholar]
- Vicoso B, Bachtrog D 2013. Reversal of an ancient sex chromosome to an autosome in Drosophila. Nature 11: e1001643. [DOI] [PMC free article] [PubMed] [Google Scholar]
- Wallrath LL, Elgin SC 1995. Position effect variegation in Drosophila is associated with an altered chromatin structure. Genes Dev 9: 1263–1277 [DOI] [PubMed] [Google Scholar]
- Weiler KS, Wakimoto BT 1995. Heterochromatin and gene expression in Drosophila. Annu Rev Genet 29: 577–605 [DOI] [PubMed] [Google Scholar]
- Wittkopp PJ, Kalay G 2011. Cis-regulatory elements: molecular mechanisms and evolutionary processes underlying divergence. Nat Rev Genet 13: 59–69 [DOI] [PubMed] [Google Scholar]
- Yasuhara JC, Wakimoto BT 2008. Molecular landscape of modified histones in Drosophila heterochromatic genes and euchromatin-heterochromatin transition zones. PLoS Genet 4: e16. [DOI] [PMC free article] [PubMed] [Google Scholar]
- Yin H, Sweeney S, Raha D, Snyder M, Lin H 2011. A high-resolution whole-genome map of key chromatin modifications in the adult Drosophila melanogaster. PLoS Genet 7: e1002380. [DOI] [PMC free article] [PubMed] [Google Scholar]
- Zhang Y, Oliver B 2010. An evolutionary consequence of dosage compensation on Drosophila melanogaster female X-chromatin structure? BMC Genomics 11: 6. [DOI] [PMC free article] [PubMed] [Google Scholar]
- Zhang Y, Sturgill D, Parisi M, Kumar S, Oliver B 2007. Constraint and turnover in sex-biased gene expression in the genus Drosophila. Nature 450: 233–237 [DOI] [PMC free article] [PubMed] [Google Scholar]
- Zhang Y, Liu T, Meyer CA, Eeckhoute J, Johnson DS, Bernstein BE, Nusbaum C, Myers RM, Brown M, Li W, et al. 2008. Model-based analysis of ChIP-Seq (MACS). Genome Biol 9: R137. [DOI] [PMC free article] [PubMed] [Google Scholar]
- Zhou Q, Bachtrog D 2012. Sex-specific adaptation drives early sex chromosome evolution in Drosophila. Science 337: 341–345 [DOI] [PMC free article] [PubMed] [Google Scholar]
- Zhou J, Sackton TB, Martinsen L, Lemos B, Eickbush TH, Hartl DL 2012. Y chromosome mediates ribosomal DNA silencing and modulates the chromatin state in Drosophila. Proc Natl Acad Sci 109: 9941–9946 [DOI] [PMC free article] [PubMed] [Google Scholar]
- Zhou Q, Ellison CE, Kaiser VB, Alekseyenko AA, Gorchakov AA, Bachtrog D 2013. The epigenome of evolving Drosophila neo-sex chromosomes: dosage compensation and heterochromatin formation. PLoS Biol 11: e1001711. [DOI] [PMC free article] [PubMed] [Google Scholar]