

Abstract
Gene expression is determined by genomic elements called enhancers, which contain short motifs bound by different transcription factors (TFs). However, how enhancer sequences and TF motifs relate to enhancer activity is unknown, and general sequence requirements for enhancers or comprehensive sets of important enhancer sequence elements have remained elusive. Here, we computationally dissect thousands of functional enhancer sequences from three different Drosophila cell lines. We find that the enhancers display distinct cis-regulatory sequence signatures, which are predictive of the enhancers’ cell type-specific or broad activities. These signatures contain transcription factor motifs and a novel class of enhancer sequence elements, dinucleotide repeat motifs (DRMs). DRMs are highly enriched in enhancers, particularly in enhancers that are broadly active across different cell types. We experimentally validate the importance of the identified TF motifs and DRMs for enhancer function and show that they can be sufficient to create an active enhancer de novo from a nonfunctional sequence. The function of DRMs as a novel class of general enhancer features that are also enriched in human regulatory regions might explain their implication in several diseases and provides important insights into gene regulation.
Enhancers (Banerji et al. 1981) or cis-regulatory modules (CRMs) are genomic elements that regulate gene expression, thereby controlling development and physiology (Levine 2010). Enhancers function independently of their endogenous contexts, e.g., when placed upstream of a reporter gene (Banerji et al. 1981; Doyle et al. 1989; Visel et al. 2009; Kvon et al. 2012), arguing that the information required for their activity resides within their DNA sequences (Yáñez-Cuna et al. 2012). However, how enhancer sequences relate to enhancer activity is unknown and has remained one of the most important and attractive open questions in today’s biology.
Enhancer sequences contain short DNA sequence motifs that serve as binding sites for transcription factors (TFs), and the combined regulatory cues of all bound TFs determine an enhancer’s activity (Small et al. 1992; Spitz and Furlong 2012). However, which TF motifs or combinations of motifs are required has remained elusive, and predictions of enhancer activity from the enhancer sequence or its motif content still remain challenging (Berman et al. 2004; Yáñez-Cuna et al. 2012). In addition, enhancers with similar functions can have different motif content or TF binding patterns, questioning even the existence of general rules or a “regulatory code” (Brown et al. 2007; Zinzen et al. 2009).
Combinations of motifs that are sufficient for enhancer function are unknown, suggesting that even our understanding of the types or identities of important sequence elements might be incomplete. Indeed, for example, a recent survey of putative regulatory regions in the human genome has led to the discovery of many previously unknown sequence motifs (Thurman et al. 2012). A comprehensive understanding of enhancer sequence elements is an important goal, as it would allow the functional interpretation of noncoding sequence mutations and their impact on gene expression and disease. Such mutations have recently been shown to be relevant for genetic diseases such as polydactyly (e.g., Shh limb enhancer; Sagai et al. 2005) and cancer (Sur et al. 2012; Huang et al. 2013). It is also important as a complete set of sequence elements can allow the prediction of novel enhancers by searching for regions in which such elements are enriched, occur in certain arrangements, or are evolutionarily conserved (Berman et al. 2002; Markstein et al. 2004; Hallikas et al. 2006; Warner et al. 2008; Aerts et al. 2010).
Most of our current understanding about enhancer sequences has come from systematic mutational analyses of individual enhancers such as even-skipped stripe 2 (Small et al. 1992), sparkling (Swanson et al. 2010), or the interferon-β [IFN-β] enhanceosome (Thanos and Maniatis 1995), and such tests have recently been scaled up substantially by the use of transcriptional reporter systems and sequence barcodes (Kwasnieski et al. 2012; Melnikov et al. 2012; Patwardhan et al. 2012; Kheradpour et al. 2013). A promising alternative is the statistical sequence analysis of large sets of independent sequences with identical or similar functions (Roth et al. 1998; Yáñez-Cuna et al. 2013). This approach is based on the assumption that shared functions stem from shared sequence features, which can be identified by means of their statistical overrepresentation (for reviews, see Stormo 2000; Hardison and Taylor 2012). It has been applied frequently and successfully, e.g., to proximal promoters (Roth et al. 1998), TF-binding sites (Heinz et al. 2010; Lin et al. 2010; Yáñez-Cuna et al. 2012) and TF-bound enhancers (Smith et al. 2013; White et al. 2013), sets of co-regulated genes (Philippakis et al. 2006; Elemento et al. 2007; Aerts et al. 2010), and to putative enhancers predicted based on co-factor binding, histone marks, or DNA accessibility (Narlikar et al. 2010; Lee et al. 2011; Burzynski et al. 2012). The application of this approach to large sets of enhancers that are active in different cell types has the potential to reveal novel enhancer features, but has not yet been possible because only a small number of active enhancers have been identified and functionally characterized in any given cell type or species.
Here, we computationally dissect the sequences of thousands of active enhancers from three Drosophila cell lines. We demonstrate that cell type-specific enhancer function can be predicted with high accuracy from enhancer sequences and identified a novel class of general enhancer features, dinucleotide repeat motifs (DRMs). DRMs are required for enhancer activity in cell type-specific enhancers and high numbers are characteristic for enhancers with broad activity. We draw a general model for enhancer activity that incorporates TF and repeat motifs and present a set of motifs that is sufficient for enhancer activity.
Results
Thousands of enhancers with cell type-specific activity
We selected three established Drosophila melanogaster cell lines: hematopoetic S2 cells derived from late embryos (Schneider 1972), neuronal BG3 cells from larvae (Ui et al. 1994), and ovarian somatic cells (OSCs) from adult ovaries (Saito et al. 2009). This selection comprises cell types derived from different tissues and different stages during the Drosophila life cycle and exhibiting distinct gene expression profiles (Cherbas et al. 2011). We previously identified active enhancers in S2 cells and OSCs using STARR-seq, a genome-wide activity-based enhancer screening method (Arnold et al. 2013) and now performed STARR-seq screens in BG3 cells (Supplemental Fig. S1), revealing a total of 14,280 active enhancers, of which thousands were detected in only one of the three cell types and 814 in all three cell types (Fig. 1 A,B).
Figure 1.
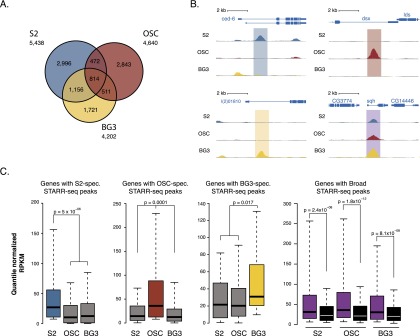
STARR-seq identifies enhancers with different cell type activity profiles. (A) Venn diagram of the STARR-seq enhancers according to their activity in three different Drosophila cell types: S2 (blue), OSC (red), and BG3 (yellow). (B) UCSC Genome Browser screenshot for examples of S2-specific, OSC-specific, BG3-specific, and broadly active enhancers. (C) The expression levels of genes neighboring enhancers from each of the four enhancer classes (quantile-normalized RPKM [reads per kilobase exon model] values; Wilcoxon P-values) in S2 cells, OSCs, and BG3 cells. Black shows a negative control with genes neighboring randomly chosen regions that were inactive in all three cell types, according to STARR-seq.
To determine the sequence features required for cell type-specific enhancer activity, we defined four stringent groups of 500 enhancers each: the 500 strongest enhancers of each cell type that were not active (STARR-seq P > 0.1) in any of the other two cell types (cell type-specific enhancers) and 500 enhancers that were strongly active in each of the three cell types (STARR-seq enrichment ≥2-fold, P ≤ 0.001; broadly active enhancers). In addition, we defined a control set of 1000 sequences that had an identical genomic distribution to that of the active enhancers (i.e., mainly intronic and intergenic) but were inactive in all three cell types according to STARR-seq (Arnold et al. 2013).
As expected for enhancers that are active in their endogenous cellular context (Arnold et al. 2013), the cell type-specific activity of the enhancers in each of the four groups was reflected by the expression levels of the neighboring genes as measured by RNA-seq (Fig. 1C). For example, genes next to S2-specific enhancers were specifically expressed in S2 cells but not in BG3 cells or OSCs, and the equivalent was true for BG3- or OSC-specific enhancers. Genes next to broadly active enhancers were expressed at similar levels in all three cell types and enriched in gene ontology categories related to housekeeping functions such as cytokinesis, cell division, and metabolic processes (Supplemental Fig. S2). Enhancers from all cell types showed a similar overall genomic distribution (Supplemental Fig. S1; Arnold et al. 2013), with a slight enrichment of broadly active enhancers near transcription start sites (TSS) compared with cell type-specific enhancers (Supplemental Fig. S3A).
These defined sets of sequences with functionally characterized enhancer activity across three different cell types together with a large set of experimentally tested negative control sequences constitute an unprecedented resource to study the sequence features that underlie cell type-specific enhancer activity.
Sequence motifs are differentially enriched and predictive for cell type-specific enhancer activity
STARR-seq measures the enhancer activity of defined DNA fragments in the constant sequence environment of a reporter plasmid (Fig. 2A) and thus is independent of the fragments’ genomic contexts and chromatin states (Arnold et al. 2013). We therefore hypothesized that all functional differences between the four classes of enhancers are determined by the underlying enhancer sequences via defined sequence features, which we should be able to discover by sequence analysis.
Figure 2.

Enhancer classes display differential motif content that is predictive. (A) Cartoon of STARR-seq highlighting that a genomic-wide library of candidate fragments is tested for enhancer activity in a constant sequence environment (for details, see Arnold et al. 2013). (B) Definition of nonoverlapping enhancer subsets for subsequent parts of the analysis (schematic). (LOOCV) Leave-one-out cross-validation (see Methods for details). (C) Heatmap showing motif enrichments in four enhancer classes compared with negative control regions (neg). Shown are only motifs with significant enrichments in at least one of the four enhancer classes (FDR adjusted P-value ≤0.01 and fold enrichment ≥2); matrix cells with nonsignificant enrichment values (FDR adjusted P-value ≤0.01) are shown in white. (D) Receiver operating characteristic (ROC) plot for binary enhancer classification of all four enhancer classes versus the negative (dark colors) and positive (light colors) control sets using LOOCV. ([AUC] Area under the ROC curve.) Controls (gray) were performed by randomizing the sequences’ assignments to the enhancer or control groups (see Yáñez-Cuna et al. 2012).
To identify the sequence features responsible for enhancer activity of each of the four groups, we established a rigorous cross-validation protocol in which we used distinct subsets of enhancers for motif discovery, motif enrichment analysis, and predictor training and evaluation (Fig. 2B; Methods). This avoids circular reasoning and prevents overfitting, which have been prevalent problems during regulatory sequence analyses (e.g., Yuan et al. 2007).
We found known TF motifs, computationally identified motifs (Stark et al. 2007), and de novo discovered motifs enriched in enhancer sequences of each functional class compared with control regions that have the same genomic distribution but are inactive in all three cell types (Fig. 2C). Interestingly, the motif enrichments were not uniform but showed clear differences between the four enhancer classes, which is emphasized when comparing the sequences of each class against sequences from the other three classes (Supplemental Fig. S4).
In fact, this differential motif distribution was sufficient to predict the functional classes for enhancers solely based on their sequences with high accuracy (Fig. 2D): We were able to correctly classify between 74.5% and 81.0% of all enhancers against negative controls (AUCs 0.80–0.90) and between 63.9% and 71.6% against the union of positive enhancers from the respective other classes (AUCs 0.67–0.79) using a support vector machine (SVM) and leave-one-out cross-validation (LOOCV) (Supplemental Fig. S5; Yáñez-Cuna et al. 2012; see Supplemental Table S1 for prediction performance using other cross-validation schemes). Similarly, broadly active enhancers could be discriminated from enhancers that are active in two out of the three cell types, suggesting that they constitute a distinct class of enhancers (Supplemental Table S2).
This shows that the difference in motif content is sufficient for the correct discrimination of enhancer activity patterns from enhancer sequences. Furthermore, these results also suggest that sufficiently many different enhancers in each class share the same characteristic motif content such that cis-regulatory motif signatures can be learned from some enhancers to predict novel and unseen enhancers in a cross-validation setting. Successful predictions would not be possible if different enhancers were active due to entirely different motifs.
Cell type-specific motif features
Among the most differentially enriched and discriminative motifs for the three cell type-specific enhancer classes, we found motifs of known TFs. This included, for example, GATA and E-box motifs for S2-specific enhancers, Chorion factor 2- (Cf2) and Pointed- (Pnt) like motifs for BG3-specific enhancers, and Forkhead- (Fkh) and Traffic jam- (Tj) like motifs for OSC-specific enhancers (Fig. 2C; Supplemental Fig. S4). The GATA motif is recognized by the TF Serpent (Srp) which is known to be required in S2 cells (Rehorn et al. 1996; Rämet et al. 2002) and the E-box motif can be recognized by Twist, a master regulator of early mesoderm development expressed in S2 cells (Arnold et al. 2013). Similarly, Tj (a Maf TF) is necessary for the development of OSCs (Li et al. 2003), and is a well-known OSC-specific marker gene (Saito et al. 2009).
To test if GATA and E-box motifs are important for enhancer activity in S2 cells, we performed luciferase assays for three S2 cell-specific enhancers (Fig. 3A). All three wild-type enhancers were active in S2 cells, but when we mutated either the GATA motifs or the E-box motifs, the activity of all enhancers dropped substantially. This suggests that both types of motifs are indeed functionally important for S2 cell-specific enhancers. In contrast, individually mutating three different additional motifs that are all predicted to be nonfunctional did not alter the enhancer activity (Supplemental Fig. S6).
Figure 3.

Predicted transcription factor motifs are important for cell type-specific enhancer activity. (A) Luciferase (Luc) assays in S2 cells of wild-type (light blue) and GATA or E-box motif mutant (dark blue) sequences of three S2-specific enhancers. (B) Luciferase assays in OSCs of wild-type (light red) and Fkh motif mutant (dark red) sequences of three OSC-specific enhancers. Neg denotes a negative control sequence used for normalization (Arnold et al. 2013), and error bars indicate standard deviations of at least three independent biological replicates. Shown are P-values from unpaired t-tests.
Similarly, mutating the Fkh-like motifs in three OSC-specific enhancers substantially decreased or abolished the enhancer activity for all three enhancers. This suggests that the computationally predicted and strongly differentially enriched Fkh-like motif is required for enhancer function in OSCs (Fig. 3B).
The results show that enhancers with shared cell type-specific functions share sequence motifs that can be identified computationally, are predictive, and are required for function.
Dinucleotide repeat motifs are required for broadly active enhancers
In addition to the cell type-specific TF motifs discussed above, we found a set of motifs enriched in all four enhancer classes and required for successful enhancer predictions. This set included some motifs of broadly expressed activators (e.g., AP-1 and STAT) and also motifs that consisted of the repeated dinucleotides CA, GA, or CG (i.e., all possible dinucleotides except TA) (Fig. 2C; Supplemental Figs. S7, S8), which we term dinucleotide repeat motifs (DRMs). Interestingly, while the activator motifs and DRMs were substantially enriched in all three cell type-specific enhancer classes compared with negative controls, they were even more highly enriched in broadly active enhancers (Fig. 4A; Supplemental Figs. S7, S8A,B). In fact, they were the most important features to computationally discriminate broadly active from cell type-specific enhancers (Supplemental Fig. S5). The increased enrichment of DRMs in broadly active enhancers was due to both an increased number of nonoverlapping DRMs and longer stretches of clustered and overlapping DRMs (Supplemental Fig. S8B,C). CA, GA, and CG (but not AT) type DRMs showed increased evolutionary conservation in all enhancer classes compared with negative regions (Supplemental Fig. S9), and their increased abundance and lengths, particularly in broadly active enhancers, were also observed in orthologous genomic regions in D. yakuba and D. pseudoobscura (Supplemental Fig. S10). This suggests that DRMs might constitute a novel class of general enhancer features (Fig. 2C) and that a high number of DRMs might allow broad enhancer activity across several cell types.
Figure 4.

Dinucleotide repeat motifs are enhancer features required for activity. (A) Distribution of dinucleotide repeat motif (DRM) occurrences for the GA DRM Trl/ME137 (left) and the CA DRM Mot15 (right) in negative regions (gray), cell type-specific enhancers (blue, red, yellow), and broadly active enhancers (purple). The whiskers denote the 10th and 90th percentiles and Wilcoxon P-values are shown. (B–C) Luciferase (Luc) assays in S2 cells (blue) and OSCs (red) for three broadly active enhancers and DRM mutant variants. Shown are wild-type (light colors) and mutant (dark colors) sequences, in which GA DRMs (B) or CA DRMs (C) are disrupted. (D) Luciferase assays for disrupting the CA and CG DRMs in the cell type-specific enhancer S2-1. (E) Luciferase assays for disrupting the GATA motif in two broadly active enhancers. (B–E) Neg denotes a negative control sequence used for normalization (Arnold et al. 2013), and error bars indicate standard deviations of at least three independent biological replicates. Shown are P-values from unpaired t-tests. (F) Luciferase assays in S2 cells (blue) and OSCs (red) of a synthetic enhancer (syn) for which the GA and CA DRMs and the AP-1 motif were copied from a Broad enhancer (BA-2) into an inactive genomic region (B.bone, backbone), while preserving their orientation and spacing. The activities of BA-2 and B.bone are shown as controls.
To validate the functional importance of DRMs, we selected three broadly active enhancers and assessed their activities by luciferase assays in both S2 cells and OSCs (Fig. 4B,C). While all three enhancers were active in both cell types, the activity of all mutant variants in which the GA DRMs were mutated was strongly reduced (Fig. 4B). Similarly, mutating the CA DRMs in the two enhancers that contained such motifs disrupted the activity of two out of two enhancers in OSCs and of one out of two enhancers in S2 cells (Fig. 4D). For the second one, the activity was enhanced in S2 cells, presumably because the mutations created another functional motif or because the CA DRM can exert both activating and repressing functions as is also known for other motifs and TFs (Bauer et al. 2010).
Our results show that the GA and CA dinucleotide repeats are indeed required for the activity of broad enhancers in S2 cells and OSCs, as predicted by the computational analyses. Similarly, the AP-1 motif was also required for broad enhancer activity as predicted (Supplemental Fig. S11).
DRMs are also required for cell type-specific enhancer activity
Based on the observation that DRMs were also enriched in cell type-specific enhancers, we speculated that they might constitute more generally important enhancer features. We therefore mutated CA and CG DRMs in an S2-specific enhancer that contained such motifs and found that the mutation of either of the two DRMs indeed strongly impaired the enhancer activity (Fig. 4D).
TF motifs modulate the activity of broadly active enhancers in a cell type-specific manner
The results so far suggest that DRMs are needed for enhancer activity and that they might be sufficient if present in high numbers, as suggested by the cell type independent activity of broadly active enhancers. Despite the enrichment of DRMs in broadly active enhancers compared with cell type-specific enhancers and the prediction that this might explain their broad activity (Fig. 4A; Supplemental Fig. S8), we were wondering about the role of cell type-specific TF motifs (e.g., GATA) in broad enhancers. We therefore mutated the GATA motifs in one of the broadly active enhancers and found a specific 1.7-fold decrease of enhancer activity specifically in S2 cells in which these motifs appear to be important (see above). As expected, we did not observe a drop in activity in OSCs that appear to have different motif requirements (Fig. 4E). Notably however, the remaining activity in S2 cells is still 1.6-fold (P ≤ 0.0017) above the activity when the GA DRMs are mutated. This suggests that the activity of broad enhancers can be modulated by cell type-specific TFs via their sequence motifs.
A set of motifs that is sufficient for enhancer activity
Our results suggest a general model for the sequence requirements of transcriptional enhancers, in which DRMs are required for enhancer activity and can be sufficient if present in high numbers, as is the case for broadly active enhancers. To test this model and the putative sufficiency of a defined set of motifs for enhancer activity directly, we copied the GA, CA, and AP-1 motifs from one of the broadly active enhancers (BA-2) into an inactive sequence. The motifs indeed conferred enhancer activity to the neutral sequence and the resulting synthetic enhancer was active in both S2 cells and OSCs. Notably, in OSCs the synthetic enhancer was as strong as the original enhancer (BA-2), while in S2 cells BA-2 was stronger, presumably because it also contains GATA motifs not included in the synthetic enhancer (Fig. 4F). Enhancer activity was also observed for two out of three additional synthetic enhancers derived from other broadly active enhancers (Supplemental Fig. S12). Importantly, this included one derived from BA-3, from which we exclusively copied DRMs but no additional motif. This suggests that the motifs we discovered indeed carried the necessary features for enhancer function with full enhancer activity in S2 cells likely depending on additional cell type-specific modulatory sequences.
Discussion
Here, we made use of large sets of cell type-specific enhancers for three different Drosophila cell types identified by STARR-seq, a genome-wide enhancer activity assay (Arnold et al. 2013). Importantly, the genome-wide enhancer activity maps obtained by STARR-seq also allowed us to define experimentally validated inactive control regions, which are often not available. Computational sequence analyses revealed that cell type-specific and broadly active enhancers showed strong differential enrichment of TF motifs and DRMs. These cis-regulatory motif signatures were predictive for the different functional enhancer classes in strictly cross-validated settings. This indicates that enhancers with common function share characteristic sequence motifs and we could indeed validate these motifs’ functional importance by motif disrupting mutations.
Our results emphasize an important property of transcriptional enhancers: Several motifs are required for enhancer function, but none of these motifs is sufficient on its own. This strict motif cooperativity allows a limited number of motifs (and the corresponding regulators) to establish the many different regulatory programs and cell types we find in complex organisms. Based on our results, we suggest a general model for enhancer sequence requirements (Fig. 5A) in which two different types of sequence elements are important: (1) motifs for cell type-specific TFs (GATA, E-box, or Fkh motifs) or broadly expressed activators (AP-1 or STAT), and (2) CA, GA, and CG DRMs.
Figure 5.

Model of cell type-specific and broadly active enhancers. (A) Model for motif requirements of enhancer sequences. DRMs and motifs for cell type-specific TFs such as GATA, E-box, or Fkh motifs are required for cell type-specific enhancer activity (middle). Broadly active enhancers contain a higher number of DRMs, as depicted by DRMsn (bottom). These differences in motif content are sufficient to discriminate between enhancer classes and between enhancers and negative regions (top). (B) Enrichment and depletion of DRMs in human regulatory regions defined by DNase I hypersensitive sites (DHS) (left) (Thurman et al. 2012) and by H3K4me1 and H3K27ac (right) (The ENCODE Project Consortium 2012). (C) Luciferase assays in HeLa cells of three human enhancers (light green) and variants in which all instances of one type of DRM are mutated (dark green). Error bars indicate standard deviations of three independent biological replicates. Shown are P-values from unpaired t-tests.
DRMs are novel enhancer features that are enriched and required in cell type-specific enhancers, in which they are complemented by additional motifs for cell type-specific TFs. A high number of DRMs is the main feature of broadly active enhancers, suggesting that they might be sufficient for broad enhancer activity across several cell types. DRMs are enriched in many independent (nonhomologous) enhancer sequences and we validated their functional requirement for four different representative sequences (Fig. 4B–D). We therefore conclude that our findings likely apply to enhancers more generally and that DRMs constitute general enhancer features. Our results are specific to the motifs described here, as both the mutation of three different control motifs that were not important according to our analysis did not impair enhancer function (Supplemental Fig. S6). In addition, unlike the CA, GA, and CG DRMs, the fourth possible dinucleotide repeat sequence TA is depleted from enhancer sequences (Supplemental Fig. S8) and does not show increased evolutionary sequence conservation (Supplemental Fig. S9).
The DRMs described here might be bound by broadly expressed TFs such as Trithorax-like (Trl), which is ubiquitously expressed and recognizes GAGA motifs. Trl is known to interact with nucleosome remodeling factors to restructure the chromatin (Tsukiyama et al. 1994; Xiao et al. 2001) and has been associated with accessible regions characteristic of active enhancers (Farkas et al. 1994). Alternatively, DRMs might function by directly influencing the DNA structure (e.g., major and minor groove shapes or bendability/flexibility) (Htun and Dahlberg 1989), triple-stranded DNA formation (Espinás et al. 1996), or nucleosome occupancy (Struhl and Segal 2013), and thus chromatin properties more generally. The CA DRM for example—for which no TF is known—was found to be highly conserved between different Drosophila species (Elemento and Tavazoie 2005; Stark et al. 2007), and the CA, GA, and CG DRMs are enriched in TF-binding sites and highly occupied target (HOT) regions, which display high TF-binding complexity, are associated with decreased nucleosome density, and function as enhancers (Li et al. 2008; The modENCODE Consortium et al. 2010; Kvon et al. 2012). Interestingly, GA and CA dinucleotide repeats were also enriched in HOT regions in C. elegans (Kvon et al. 2012), even though C. elegans does not have a known Trl homolog (Tsukiyama et al. 1994), suggesting that the motifs could have a generally important role in a wide range of enhancers across species, potentially independent of sequence specific TFs. In addition, mouse retina enhancers have been reported to be GC-rich (White et al. 2012), consistent with the GC content of the DRMs described here. This suggests that DRMs are an important feature of enhancers more generally and across different species, including mammals.
Indeed, we found all three types of DRMs (but not TA dinucleotides) enriched in human regulatory regions as defined by DNase I hypersensitivity (Thurman et al. 2012) or by H3K4me1 and H3K27ac histone marks (Fig. 5B; The ENCODE Project Consortium 2012). Furthermore, using luciferase assays in HeLa cells, we confirmed the importance of the DRMs for enhancer function for two out of three different enhancers (Fig. 5C). This suggests that DRMs might be important for enhancer activity across a wide range of species, including flies and humans.
Our demonstration that DRMs are generally important for enhancer activity has far-reaching implications for our understanding of genome sequences and their functions and of gene regulation during development and disease. It argues that functionally important genomic elements might be missed when dinucleotide repeats are masked during genome sequence analyses and that sequence elements involving DRMs might have been disregarded. Dinucleotide repeat-like motifs have indeed been detected before, e.g., enriched in regions bound by various regulatory proteins (Li et al. 2008; The ENCODE Project Consortium 2012; Wang et al. 2012) but appeared to have received little attention, e.g., during genome annotation or gene regulatory studies. This is despite previous findings from mouse and human that changes in GA and CA repeat lengths in promoters were associated with differences in gene expression (Hamada et al. 1984; Wang et al. 2005; Morris et al. 2010), and even though such repeats have been associated with several diseases including Lupus (Morris et al. 2010) and cancer (Wang et al. 2005). How to treat dinucleotide repeats during sequence analyses and genome annotation and the functional roles of DRMs during gene regulation and potential mechanisms by which they contribute to enhancer activity are important questions for future studies.
Methods
STARR-seq experiment and data analysis
We obtained Drosophila neuronal ML-DmBG3-c2 (BG3) cells from the DGRC and performed STARR-seq and deep sequencing as described previously (Arnold et al. 2013) with the following exceptions: BG3 cells were cultured in M3 BPYE medium supplemented with 10% FCS, 10 µg/mL insulin, 1% P/S at 25°C. Transfection of plasmid libraries (1 µg DNA/1 × 106 cells) was performed with 1 × 10⁹ cells at 70%–80% confluency using Gene Pulser MXcell Electroporation System (24-well plate; Bio-Rad; cat. no. 165-2682). 1 × 10⁷ cells in 800 µL K-PBS (inverted PBS) were subjected to each well (corresponding to a standard 0.4 mm electroporation cuvette), containing 10 µg of plasmid library in 100 µL EB. After 15 min incubation, BG3 cells were pulsed (500V-250µF-1000Ω). BG3 cells were spun down after electroporation and 6 × 10⁷ cells were resuspended in 10 mL growth medium.
Read mapping and peak calling for the STARR-seq screens in BG3 cells were performed as described previously (Arnold et al. 2013). We then defined cell type-specific enhancers as 401-bp regions centered on STARR-seq peak summits that showed a ≥2-fold enrichment over input (P-value ≤ 0.001) in the cell type of interest and a ≤1.41-fold enrichment (P-value > 0.1) in the other two cell types. We defined broadly active enhancers based on S2 cell STARR-seq peaks, if peaks with distances of <500 bp (summit-to-summit distances) were independently called also in the other two cell types with ≥2-fold enrichment over input (P-value ≤ 0.001). We excluded enhancers that were <201 bp from an annotated transposon (Jurka 2000).
Peak-to-gene assignment and GO analysis
We assigned genes to enhancers, if the enhancers were located within 4 kb from the TSS of the genes. We then calculated the enrichment of Gene Ontology (GO) categories (Ashburner et al. 2000) in each class of enhancers against the union of the other three classes. We used the false discovery rate (FDR) correction for multiple testing (R) to adjust P-values, discarded functional categories with a corrected P-value > 0.05, and selected the top categories after sorting by their fold enrichment.
Definition of enhancer classes
We defined stringent classes of cell type-specific and broadly active enhancers by taking the strongest 500 enhancers of each type (see above). We created a set of 1000 negative control regions by randomly selecting genomic regions without STARR-seq enrichment from the genome, preserving the genomic distribution of the functional STARR-seq enhancers according to coding sequence (CDS), introns, etc. In addition, to determine sequence features that discriminate between the different enhancer classes rather than between enhancers and negative sequences, we created an additional control set (positive control). For each enhancer class (i.e., S2-, BG3-, OSC-specific, and broadly active) we defined this positive control set as the union of all enhancers from the other three classes. For the motif analysis (see above), we separated the 500 enhancers of each of the four classes randomly into five nonoverlapping subsets, of which we used one subset for motif de novo discovery, two subsets for feature selection, and two subsets for SVM training and evaluation using LOOCV (see Fig. 2B).
To define human regulatory regions, we first defined as broadly active human enhancers those intergenic regions that were nucleosome depleted in at least 120 cells or tissues by using DNase I hypersensitivity data (Thurman et al. 2012). Additionally, we used ChIP-seq data for the histone marks H3K4me1 and H3K27ac (The ENCODE Project Consortium 2012) and defined as broadly active enhancers regions that had both histone marks in the following cell lines: GM12878, hESC, HMEC, HSMMt, HUVEC, K562, NHA, NHLF, NHEK, and Osteoblasts. In both cases we removed regions closer than 10 kb from a TSS and excluded regions that overlapped with annotated CpG islands (UCSC Genome Browser) to avoid any bias toward CG repeats. We obtained a total of 4285 and 789 regulatory regions using DHS and ChIP-seq data, respectively. As a control, we selected an equal amount of random intergenic regions.
Analysis of gene expression
For the gene expression analysis, we assigned enhancers to all genes with TSSs within 4 kb of the STARR-seq peak summit, allowing for zero, one, or several genes to be assigned to one enhancer. We then considered only genes that were assigned exclusively to enhancers of a single enhancer class. We quantile-normalized available RNA-seq data (The modENCODE Consortium et al. 2010; Arnold et al. 2013) in R and visualized the data with a box plot that shows the median, the 25th, and 75th percentiles (boxes) and the 10th and 90th percentiles (whiskers).
Motif de novo discovery
We performed de novo motif discovery for the comparisons of each enhancer class against the respective positive and negative control sets (S2-spec. vs. Pos, S2-spec. vs. Neg, BG3-spec. vs. Pos, BG3-spec vs. Neg, OSC-spec. vs. Pos, OSC-spec. vs. Neg, Broad vs. Neg, and Broad vs. Pos). For this, we used the one-fifth of the class reserved for motif discovery (see above), and compared the sequences using DREME (Bailey 2011) and BioProspector (Liu et al. 2001). We then combined all resulting de novo motifs from all comparisons with known motifs (from Yáñez-Cuna et al. 2012).
Motif matching and motif count-based enhancer predictions
For the motif-based enhancer predictions, we first counted the occurrences of all TF motifs in the enhancers of each class as before (Yáñez-Cuna et al. 2012) with a position weight matrix (PWM) cutoff P ≤ 9.76 × 10⁻⁴ (1/4096). We performed feature selection by backward elimination as described by Yáñez-Cuna et al. (2012) using only motif counts from two-fifths of the regions. We then assessed the prediction accuracy by LOOCV, fivefold, 10-fold, 15-fold, and 20-fold cross-validation on the remaining two-fifths of the enhancers. By separating our set into nonoverlapping subsets for motif discovery, feature selection, and evaluation and by predicting previously unseen regions, we eliminate the risk of overfitting (Yuan et al. 2007). The SVM was done using libSVM (Chang and Lin 2011) using linear kernel and default parameters. We used as features the motifs mentioned above with three different PWM cutoffs (3.9 × 10⁻³; 1/256, 9.76 × 10⁻⁴; 1/1024, and 2.44 × 10⁻⁴; 1/4096) and as attributes the number of instances within each region for each particular PWM cutoff. For the analysis of enrichment and depletion of DRMs in human regulatory regions, we search for DRMs 6 bp long and compare the amount of DRMs instances against negative regions.
Visualization of differential motif enrichments
To visualize the motif enrichments in each of the classes, we counted the occurrences of all TF motifs in the enhancer sequences of each class and the respective control sets using the same PWM cutoffs as above (P ≤ 9.76 × 10⁻⁴ [1/4096]). Then, we determined the enrichment of each motif between each of the enhancer classes and their control sets and visualized significant enrichments using a heatmap representation. Because the visualization is independent of the motif-based enhancer predictions, we reused the four-fifths of the enhancers from each class not used for motif de novo discovery.
Luciferase assay
To test the functional importance of certain sequence motifs, we used luciferase assays to compare wild-type enhancer sequences with mutant versions in which we disrupted motifs that were predicted to be important. We selected wild-type enhancers that were confidently predicted by our approach (Yáñez-Cuna et al. 2012) and for which we could design primers that defined a ≤500-bp enhancer region. This allowed the PCR amplification of the wild-type sequences from genomic DNA and the chemical synthesis of the mutant versions and of the synthetic enhancers as Integrated DNA Technologies (IDT) gBlocks. We chose three S2-specific enhancers, three OSC-specific enhancers, five broadly active enhancers, and three human enhancers. All Drosophila sequences were cloned into pCR8-TOPO-GW and then shuttled to pGL3_GW_luc+ (Arnold et al. 2013) using Gateway LR Clonase II (Invitrogen) recombination and verified by Sanger sequencing. One hundred thousand Drosophila cells were co-transfected with the respective firefly constructs (100 ng) and Renilla control plasmid ubi-63E-RL (10 ng) using Fugene HD Transfection Reagent (Promega; for OSCs and BG3 cells) and JetPei (Polyplus transfection; for S2 cells). Human enhancers were cloned into modified pGL4-Promotor plasmid (Gateway-cassette was added between KpnI and BglII sites and minimal promoter between BglII and HindIII). Human genomic DNA for PCR amplification of wild-type enhancers was purchased from Promega. Fifteen thousand HeLaS3 cells were assayed as described above, using X-treme HP DNA (Roche) as a transfection reagent and pGL4.75 (Promega) as a transfection control. Enhancer activity was measured by luciferase assay using the Dual luciferase kit (Promega) according to the manufacturer’s instructions.
Data access
All deep sequencing data from this study have been submitted to the NCBI Gene Expression Omnibus (GEO; http://www.ncbi.nlm.nih.gov/geo/) under series accession number GSE49809 and are also available at http://www.starklab.org.
Acknowledgments
We thank Wolfgang Lugmayr (IMP) for administering the IMP/IMBA compute cluster and the Julius Brennecke and Jürgen Knoblich groups (IMBA) for help with OSC and BG3 cells, respectively. Deep sequencing was performed at the CSF Next-Generation Sequencing Unit (http://csf.ac.at). J.O.Y-C. was supported by the Austrian Ministry for Science and Research through the GEN-AU Bioinformatics Integration Network III. J.O.Y-C., C.D.A., L.M.B., and M.R. are supported by a European Research Council (ERC) Starting Grant (no. 242922) awarded to A.S. and the Stark group by the Austrian Science Fund (FWF, F4303-B09). Basic research at the IMP is supported by Boehringer Ingelheim GmbH.
Author contributions: C.D.A. and M.R. performed the STARR-seq experiments. J.O.Y-C. and D.G. performed the computational analyses. J.O.Y-C., G.S., L.M.B., and M.R. performed the luciferase experiments. A.S. conceived and supervised the project. J.O.Y-C. and A.S. wrote the paper.
Footnotes
[Supplemental material is available for this article.]
Article published online before print. Article, supplemental material, and publication date are at http://www.genome.org/cgi/doi/10.1101/gr.169243.113.
Freely available online through the Genome Research Open Access option.
References
- Aerts S, Quan X-J, Claeys A, Naval Sanchez M, Tate P, Yan J, Hassan BA 2010. Robust target gene discovery through transcriptome perturbations and genome-wide enhancer predictions in Drosophila uncovers a regulatory basis for sensory specification. PLoS Biol 8: e1000435. [DOI] [PMC free article] [PubMed] [Google Scholar]
- Arnold CD, Gerlach D, Stelzer C, Boryń ŁM, Rath M, Stark A 2013. Genome-wide quantitative enhancer activity maps identified by STARR-seq. Science 339: 1074–1077 [DOI] [PubMed] [Google Scholar]
- Ashburner M, Ball CA, Blake JA, Botstein D, Butler H, Cherry JM, Davis AP, Dolinski K, Dwight SS, Eppig JT, et al. 2000. Gene ontology: tool for the unification of biology. The Gene Ontology Consortium. Nat Genet 25: 25–29 [DOI] [PMC free article] [PubMed] [Google Scholar]
- Bailey TL 2011. DREME: motif discovery in transcription factor ChIP-seq data. Bioinformatics 27: 1653–1659 [DOI] [PMC free article] [PubMed] [Google Scholar]
- Banerji J, Rusconi S, Schaffner W 1981. Expression of a β-globin gene is enhanced by remote SV40 DNA sequences. Cell 27: 299–308 [DOI] [PubMed] [Google Scholar]
- Bauer DC, Buske FA, Bailey TL 2010. Dual-functioning transcription factors in the developmental gene network of Drosophila melanogaster. BMC Bioinformatics 11: 366. [DOI] [PMC free article] [PubMed] [Google Scholar]
- Berman BP, Nibu Y, Pfeiffer BD, Tomancak P, Celniker SE, Levine M, Rubin GM, Eisen MB 2002. Exploiting transcription factor binding site clustering to identify cis-regulatory modules involved in pattern formation in the Drosophila genome. Proc Natl Acad Sci 99: 757–762 [DOI] [PMC free article] [PubMed] [Google Scholar]
- Berman BP, Pfeiffer BD, Laverty TR, Salzberg SL, Rubin GM, Eisen MB, Celniker SE 2004. Computational identification of developmental enhancers: conservation and function of transcription factor binding-site clusters in Drosophila melanogaster and Drosophila pseudoobscura. Genome Biol 5: R61. [DOI] [PMC free article] [PubMed] [Google Scholar]
- Brown CD, Johnson DS, Sidow A 2007. Functional architecture and evolution of transcriptional elements that drive gene coexpression. Science 317: 1557–1560 [DOI] [PubMed] [Google Scholar]
- Burzynski GM, Reed X, Taher L, Stine ZE, Matsui T, Ovcharenko I, McCallion AS 2012. Systematic elucidation and in vivo validation of sequences enriched in hindbrain transcriptional control. Genome Res 22: 2278–2289 [DOI] [PMC free article] [PubMed] [Google Scholar]
- Chang C-C, Lin C-J 2011. LIBSVM: a library for support vector machines. ACM Trans Intell Syst Technol (TIST) 2: 27 [Google Scholar]
- Cherbas L, Willingham A, Zhang D, Yang L, Zou Y, Eads BD, Carlson JW, Landolin JM, Kapranov P, Dumais J, et al. 2011. The transcriptional diversity of 25 Drosophila cell lines. Genome Res 21: 301–314 [DOI] [PMC free article] [PubMed] [Google Scholar]
- Doyle HJ, Kraut R, Levine M 1989. Spatial regulation of zerknüllt: a dorsal-ventral patterning gene in Drosophila. Genes Dev 3: 1518–1533 [DOI] [PubMed] [Google Scholar]
- Elemento O, Tavazoie S 2005. Fast and systematic genome-wide discovery of conserved regulatory elements using a non-alignment based approach. Genome Biol 6: R18. [DOI] [PMC free article] [PubMed] [Google Scholar]
- Elemento O, Slonim N, Tavazoie S 2007. A universal framework for regulatory element discovery across all genomes and data types. Mol Cell 28: 337–350 [DOI] [PMC free article] [PubMed] [Google Scholar]
- The ENCODE Project Consortium. 2012. An integrated encyclopedia of DNA elements in the human genome. Nature 489: 57–74 [DOI] [PMC free article] [PubMed] [Google Scholar]
- Espinás ML, Jiménez-García E, Martínez-Balbás A, Azorín F 1996. Formation of triple-stranded DNA at d(GA·TC)n sequences prevents nucleosome assembly and is hindered by nucleosomes. J Biol Chem 271: 31807–31812 [DOI] [PubMed] [Google Scholar]
- Farkas G, Gausz J, Galloni M, Reuter G, Gyurkovics H, Karch F 1994. The Trithorax-like gene encodes the Drosophila GAGA factor. Nature 371: 806–808 [DOI] [PubMed] [Google Scholar]
- Hallikas O, Palin K, Sinjushina N, Rautiainen R, Partanen J, Ukkonen E, Taipale J 2006. Genome-wide prediction of mammalian enhancers based on analysis of transcription-factor binding affinity. Cell 124: 47–59 [DOI] [PubMed] [Google Scholar]
- Hamada H, Seidman M, Howard BH, Gorman CM 1984. Enhanced gene expression by the poly(dT-dG) · poly(dC-dA) sequence. Mol Cell Biol 4: 2622–2630 [DOI] [PMC free article] [PubMed] [Google Scholar]
- Hardison RC, Taylor J 2012. Genomic approaches towards finding cis-regulatory modules in animals. Nat Rev Genet 13: 469–483 [DOI] [PMC free article] [PubMed] [Google Scholar]
- Heinz S, Benner C, Spann N, Bertolino E, Lin YC, Laslo P, Cheng JX, Murre C, Singh H, Glass CK 2010. Simple combinations of lineage-determining transcription factors prime cis-regulatory elements required for macrophage and B cell identities. Mol Cell 38: 576–589 [DOI] [PMC free article] [PubMed] [Google Scholar]
- Htun H, Dahlberg JE 1989. Topology and formation of triple-stranded H-DNA. Science 243: 1571–1576 [DOI] [PubMed] [Google Scholar]
- Huang FW, Hodis E, Xu MJ, Kryukov GV, Chin L, Garraway LA 2013. Highly recurrent TERT promoter mutations in human melanoma. Science 339: 957–959 [DOI] [PMC free article] [PubMed] [Google Scholar]
- Jurka J 2000. Repbase update: a database and an electronic journal of repetitive elements. Trends Genet 16: 418–420 [DOI] [PubMed] [Google Scholar]
- Kheradpour P, Ernst J, Melnikov A, Rogov P, Wang L, Zhang X, Alston J, Mikkelsen TS, Kellis M 2013. Systematic dissection of regulatory motifs in 2000 predicted human enhancers using a massively parallel reporter assay. Genome Res 23: 800–811 [DOI] [PMC free article] [PubMed] [Google Scholar]
- Kvon EZ, Stampfel G, Yáñez-Cuna JO, Dickson BJ, Stark A 2012. HOT regions function as patterned developmental enhancers and have a distinct cis-regulatory signature. Genes Dev 26: 908–913 [DOI] [PMC free article] [PubMed] [Google Scholar]
- Kwasnieski JC, Mogno I, Myers CA, Corbo JC, Cohen BA 2012. Complex effects of nucleotide variants in a mammalian cis-regulatory element. Proc Natl Acad Sci 109: 19498–19503 [DOI] [PMC free article] [PubMed] [Google Scholar]
- Lee D, Karchin R, Beer MA 2011. Discriminative prediction of mammalian enhancers from DNA sequence. Genome Res 21: 2167–2180 [DOI] [PMC free article] [PubMed] [Google Scholar]
- Levine M 2010. Transcriptional enhancers in animal development and evolution. Curr Biol 20: R754–R763 [DOI] [PMC free article] [PubMed] [Google Scholar]
- Li MA, Alls JD, Avancini RM, Koo K, Godt D 2003. The large Maf factor Traffic Jam controls gonad morphogenesis in Drosophila. Nat Cell Biol 5: 994–1000 [DOI] [PubMed] [Google Scholar]
- Li X-Y, MacArthur S, Bourgon R, Nix D, Pollard DA, Iyer VN, Hechmer A, Simirenko L, Stapleton M, Luengo Hendriks CL, et al. 2008. Transcription factors bind thousands of active and inactive regions in the Drosophila blastoderm. PLoS Biol 6: e27. [DOI] [PMC free article] [PubMed] [Google Scholar]
- Lin YC, Jhunjhunwala S, Benner C, Heinz S, Welinder E, Mansson R, Sigvardsson M, Hagman J, Espinoza CA, Dutkowski J, et al. 2010. A global network of transcription factors, involving E2A, EBF1 and Foxo1, that orchestrates B cell fate. Nat Immunol 11: 635–643 [DOI] [PMC free article] [PubMed] [Google Scholar]
- Liu X, Brutlag DL, Liu JS 2001. BioProspector: discovering conserved DNA motifs in upstream regulatory regions of co-expressed genes. Pac Symp Biocomput 127–138 [PubMed] [Google Scholar]
- Markstein M, Zinzen R, Markstein P, Yee K-P, Erives A, Stathopoulos A, Levine M 2004. A regulatory code for neurogenic gene expression in the Drosophila embryo. Development 131: 2387–2394 [DOI] [PubMed] [Google Scholar]
- Melnikov A, Murugan A, Zhang X, Tesileanu T, Wang L, Rogov P, Feizi S, Gnirke A, Callan CG, Kinney JB, et al. 2012. Systematic dissection and optimization of inducible enhancers in human cells using a massively parallel reporter assay. Nat Biotechnol 30: 271–277 [DOI] [PMC free article] [PubMed] [Google Scholar]
- The modENCODE Consortium, Roy S, Ernst J, Kharchenko PV, Kheradpour P, Nègre N, Eaton ML, Landolin JM, Bristow CA, Ma L, et al. 2010. Identification of functional elements and regulatory circuits by Drosophila modENCODE. Science 330: 1787–1797 [DOI] [PMC free article] [PubMed] [Google Scholar]
- Morris EE, Amria MY, Kistner-Griffin E, Svenson JL, Kamen DL, Gilkeson GS, Nowling TK 2010. A GA microsatellite in the Fli1 promoter modulates gene expression and is associated with systemic lupus erythematosus patients without nephritis. Arthritis Res Ther 12: R212. [DOI] [PMC free article] [PubMed] [Google Scholar]
- Narlikar L, Sakabe NJ, Blanski AA, Arimura FE, Westlund JM, Nobrega MA, Ovcharenko I 2010. Genome-wide discovery of human heart enhancers. Genome Res 20: 381–392 [DOI] [PMC free article] [PubMed] [Google Scholar]
- Patwardhan RP, Hiatt JB, Witten DM, Kim MJ, Smith RP, May D, Lee C, Andrie JM, Lee S-I, Cooper GM, et al. 2012. Massively parallel functional dissection of mammalian enhancers in vivo. Nat Biotechnol 30: 265–270 [DOI] [PMC free article] [PubMed] [Google Scholar]
- Philippakis AA, Busser BW, Gisselbrecht SS, He FS, Estrada B, Michelson AM, Bulyk ML 2006. Expression-guided in silico evaluation of candidate cis regulatory codes for Drosophila muscle founder cells. PLoS Comput Biol 2: e53. [DOI] [PMC free article] [PubMed] [Google Scholar]
- Rämet M, Manfruelli P, Pearson A, Mathey-Prevot B, Ezekowitz RAB 2002. Functional genomic analysis of phagocytosis and identification of a Drosophila receptor for E. coli. Nature 416: 644–648 [DOI] [PubMed] [Google Scholar]
- Rehorn KP, Thelen H, Michelson AM, Reuter R 1996. A molecular aspect of hematopoiesis and endoderm development common to vertebrates and Drosophila. Development 122: 4023–4031 [DOI] [PubMed] [Google Scholar]
- Roth FP, Hughes JD, Estep PW, Church GM 1998. Finding DNA regulatory motifs within unaligned noncoding sequences clustered by whole-genome mRNA quantitation. Nat Biotechnol 16: 939–945 [DOI] [PubMed] [Google Scholar]
- Sagai T, Hosoya M, Mizushina Y, Tamura M, Shiroishi T 2005. Elimination of a long-range cis-regulatory module causes complete loss of limb-specific Shh expression and truncation of the mouse limb. Development 132: 797–803 [DOI] [PubMed] [Google Scholar]
- Saito K, Inagaki S, Mituyama T, Kawamura Y, Ono Y, Sakota E, Kotani H, Asai K, Siomi H, Siomi MC 2009. A regulatory circuit for piwi by the large Maf gene traffic jam in Drosophila. Nature 461: 1296–1299 [DOI] [PubMed] [Google Scholar]
- Schneider I 1972. Cell lines derived from late embryonic stages of Drosophila melanogaster. J Embryol Exp Morphol 27: 353–365 [PubMed] [Google Scholar]
- Small S, Blair A, Levine M 1992. Regulation of even-skipped stripe 2 in the Drosophila embryo. EMBO J 11: 4047–4057 [DOI] [PMC free article] [PubMed] [Google Scholar]
- Smith RP, Taher L, Patwardhan RP, Kim MJ, Inoue F, Shendure J, Ovcharenko I, Ahituv N 2013. Massively parallel decoding of mammalian regulatory sequences supports a flexible organizational model. Nat Genet 45: 1021–1028 [DOI] [PMC free article] [PubMed] [Google Scholar]
- Spitz F, Furlong EEM 2012. Transcription factors: from enhancer binding to developmental control. Nat Rev Genet 13: 613–626 [DOI] [PubMed] [Google Scholar]
- Stark A, Lin MF, Kheradpour P, Pedersen JS, Parts L, Carlson JW, Crosby MA, Rasmussen MD, Roy S, Deoras AN, et al. 2007. Discovery of functional elements in 12 Drosophila genomes using evolutionary signatures. Nature 450: 219–232 [DOI] [PMC free article] [PubMed] [Google Scholar]
- Stormo GD 2000. DNA binding sites: representation and discovery. Bioinformatics 16: 16–23 [DOI] [PubMed] [Google Scholar]
- Struhl K, Segal E 2013. Determinants of nucleosome positioning. Nat Struct Mol Biol 20: 267–273 [DOI] [PMC free article] [PubMed] [Google Scholar]
- Sur IK, Hallikas O, Vaharautio A, Yan J, Turunen M, Enge M, Taipale M, Karhu A, Aaltonen LA, Taipale J 2012. Mice lacking a Myc enhancer that includes human SNP rs6983267 are resistant to intestinal tumors. Science 338: 1360–1363 [DOI] [PubMed] [Google Scholar]
- Swanson CI, Evans NC, Barolo S 2010. Structural rules and complex regulatory circuitry constrain expression of a Notch- and EGFR-regulated eye enhancer. Dev Cell 18: 359–370 [DOI] [PMC free article] [PubMed] [Google Scholar]
- Thanos D, Maniatis T 1995. Virus induction of human IFN β gene expression requires the assembly of an enhanceosome. Cell 83: 1091–1100 [DOI] [PubMed] [Google Scholar]
- Thurman RE, Rynes E, Humbert R, Vierstra J, Maurano MT, Haugen E, Sheffield NC, Stergachis AB, Wang H, Vernot B, et al. 2012. The accessible chromatin landscape of the human genome. Nature 489: 75–82 [DOI] [PMC free article] [PubMed] [Google Scholar]
- Tsukiyama T, Becker PB, Wu C 1994. ATP-dependent nucleosome disruption at a heat-shock promoter mediated by binding of GAGA transcription factor. Nature 367: 525–532 [DOI] [PubMed] [Google Scholar]
- Ui K, Nishihara S, Sakuma M, Togashi S, Ueda R, Miyata Y, Miyake T 1994. Newly established cell lines from Drosophila larval CNS express neural specific characteristics. In Vitro Cell Dev Biol Anim 30: 209–216 [DOI] [PubMed] [Google Scholar]
- Visel A, Blow MJ, Li Z, Zhang T, Akiyama JA, Holt A, Plajzer-Frick I, Shoukry M, Wright C, Chen F, et al. 2009. ChIP-seq accurately predicts tissue-specific activity of enhancers. Nature 457: 854–858 [DOI] [PMC free article] [PubMed] [Google Scholar]
- Wang B, Ren J, Ooi LLPJ, Chong SS, Lee CGL 2005. Dinucleotide repeats negatively modulate the promoter activity of Cyr61 and is unstable in hepatocellular carcinoma patients. Oncogene 24: 3999–4008 [DOI] [PubMed] [Google Scholar]
- Wang J, Zhuang J, Iyer S, Lin X, Whitfield TW, Greven MC, Pierce BG, Dong X, Kundaje A, Cheng Y, et al. 2012. Sequence features and chromatin structure around the genomic regions bound by 119 human transcription factors. Genome Res 22: 1798–1812 [DOI] [PMC free article] [PubMed] [Google Scholar]
- Warner JB, Philippakis AA, Jaeger SA, He FS, Lin J, Bulyk ML 2008. Systematic identification of mammalian regulatory motifs’ target genes and functions. Nat Methods 5: 347–353 [DOI] [PMC free article] [PubMed] [Google Scholar]
- White MA, Parker DS, Barolo S, Cohen BA 2012. A model of spatially restricted transcription in opposing gradients of activators and repressors. Mol Syst Biol 8: 1–9 [DOI] [PMC free article] [PubMed] [Google Scholar]
- White MA, Myers CA, Corbo JC, Cohen BA 2013. Massively parallel in vivo enhancer assay reveals that highly local features determine the cis-regulatory function of ChIP-seq peaks. Proc Natl Acad Sci 110: 11952–11957 [DOI] [PMC free article] [PubMed] [Google Scholar]
- Xiao H, Sandaltzopoulos R, Wang HM, Hamiche A, Ranallo R, Lee KM, Fu D, Wu C 2001. Dual functions of largest NURF subunit NURF301 in nucleosome sliding and transcription factor interactions. Mol Cell 8: 531–543 [DOI] [PubMed] [Google Scholar]
- Yáñez-Cuna JO, Dinh HQ, Kvon EZ, Shlyueva D, Stark A 2012. Uncovering cis-regulatory sequence requirements for context-specific transcription factor binding. Genome Res 22: 2018–2030 [DOI] [PMC free article] [PubMed] [Google Scholar]
- Yáñez-Cuna JO, Kvon EZ, Stark A 2013. Deciphering the transcriptional cis-regulatory code. Trends Genet 29: 11–22 [DOI] [PubMed] [Google Scholar]
- Yuan Y, Guo L, Shen L, Liu JS 2007. Predicting gene expression from sequence: a reexamination. PLoS Comput Biol 3: e243. [DOI] [PMC free article] [PubMed] [Google Scholar]
- Zinzen RP, Girardot C, Gagneur J, Braun M, Furlong EEM 2009. Combinatorial binding predicts spatio-temporal cis-regulatory activity. Nature 462: 65–70 [DOI] [PubMed] [Google Scholar]