

Abstract
The Drosophila melanogaster Genetic Reference Panel (DGRP) is a community resource of 205 sequenced inbred lines, derived to improve our understanding of the effects of naturally occurring genetic variation on molecular and organismal phenotypes. We used an integrated genotyping strategy to identify 4,853,802 single nucleotide polymorphisms (SNPs) and 1,296,080 non-SNP variants. Our molecular population genomic analyses show higher deletion than insertion mutation rates and stronger purifying selection on deletions. Weaker selection on insertions than deletions is consistent with our observed distribution of genome size determined by flow cytometry, which is skewed toward larger genomes. Insertion/deletion and single nucleotide polymorphisms are positively correlated with each other and with local recombination, suggesting that their nonrandom distributions are due to hitchhiking and background selection. Our cytogenetic analysis identified 16 polymorphic inversions in the DGRP. Common inverted and standard karyotypes are genetically divergent and account for most of the variation in relatedness among the DGRP lines. Intriguingly, variation in genome size and many quantitative traits are significantly associated with inversions. Approximately 50% of the DGRP lines are infected with Wolbachia, and four lines have germline insertions of Wolbachia sequences, but effects of Wolbachia infection on quantitative traits are rarely significant. The DGRP complements ongoing efforts to functionally annotate the Drosophila genome. Indeed, 15% of all D. melanogaster genes segregate for potentially damaged proteins in the DGRP, and genome-wide analyses of quantitative traits identify novel candidate genes. The DGRP lines, sequence data, genotypes, quality scores, phenotypes, and analysis and visualization tools are publicly available.
Studies in Drosophila melanogaster have revealed basic principles and mechanisms underlying fundamental genetic concepts of linkage and recombination and were instrumental in identifying canonical and evolutionarily conserved cell signaling pathways. Most D. melanogaster genes are evolutionarily conserved, leading to fly models for understanding common human diseases and behavioral disorders, dipteran disease vectors, and insects impacting agriculture, medicine, and forensics. Despite nearly a century of research on D. melanogaster, however, a large fraction of its coding and noncoding sequence has no known function (McQuilton et al. 2012). Recent efforts to induce mutations in every protein coding gene utilize transposable elements (Bellen et al. 2004, 2011), which have a different spectrum of allelic effects than SNPs and small insertions and deletions (indels). Comprehensive efforts to identify regulatory DNA elements in Drosophila (The modENCODE Consortium et al. 2010) have attributed functional effects to noncoding DNA, further complicating efforts to dissect the genotype-phenotype map. In addition, the vast majority of genetic analyses in D. melanogaster have used a few “wild type” strains representing a tiny sample of genetic diversity. Mutational effects in one genetic background are often enhanced or suppressed in other backgrounds (Mackay 2014). Such epistatic interactions provide a window for visualizing genetic interaction networks. In addition, D. melanogaster has a rich history as a model organism for population and quantitative genetics, generating inferences about regions under purifying natural selection independent of functional analyses and highlighting the contribution of common and rare variants in protein coding as well as regulatory sequences to the genetic architecture of complex traits (Flint and Mackay 2009; Mackay et al. 2009).
Efforts to utilize naturally occurring genetic variation in D. melanogaster to add to our understanding of functional DNA elements have been greatly expedited by the Drosophila Genetic Reference Panel (DGRP), a publicly available population of 205 sequenced inbred lines. Previously, we cataloged SNPs segregating in 168 DGRP lines (DGRP Freeze 1.0) (Mackay et al. 2012) and non-SNP variants in a subset of 39 lines (Massouras et al. 2012; Zichner et al. 2013). Here, we report the DGRP Freeze 2.0 with sequences of all lines and genotypes for SNP and non-SNP variants (indels, tandem duplications, and complex variants). We describe cytogenetic analysis of inversions, Wolbachia infection status, variation in genome size, molecular population genetics of indels and inversions, functional analyses of segregating variants, and online tools for association mapping of complex traits.
Results
Catalog of molecular polymorphism in the DGRP
We obtained Illumina sequences for 48 DGRP lines that were not sequenced previously or for which only 454 sequence data were available, as well as for six DGRP lines with low Freeze 1.0 coverage (Supplemental Data File S1). We aligned sequence reads to the D. melanogaster genome using BWA (Li and Durbin 2010) and Novoalign (Novocraft.com), recalibrated base quality scores, and locally realigned reads. The average mapped sequence coverage was 27× per line (Supplemental Data File S1).
There are many algorithms for detecting SNP and non-SNP variants from short-read sequence data (Massouras et al. 2010; McKenna et al. 2010; Medvedev et al. 2010; Shen et al. 2010; Alkan et al. 2011; Rausch et al. 2012; Stone 2012). Identification of non-SNP variants is challenging with short reads (Onishi-Seebacher and Korbel 2011), since structural variants can produce alternative alignments and variant calls for the same variant. Methods combining several approaches to generate a consensus variant list give a lower false positive rate than individual methods (Mills et al. 2011; Zichner et al. 2013). Variant call quality can be further enhanced by genotyping to test if variants in the population are also present in the line under consideration (Waszak et al. 2010; Handsaker et al. 2011). In regions of low read depth, such genotyping may be possible even though variants cannot be discovered de novo. In this study, we used seven variant callers and integrated genotyping (Fig. 1) to comprehensively map genomic variation in 205 DGRP lines.
Figure 1.

Flowchart of the integrated genotyping procedure used to call SNP and non-SNP variants. Seven different variant calling methods were used to derive a consensus list of variant calls. The variant calls were grouped into haplotype bins (indicated by dashed vertical lines) such that there is a region on both sides of each region containing two or more regions of at least 110 bp with no non-SNP variants in any line. The variable regions and their 110-bp flanking regions were used to derive the sequences of alternative haplotypes against which reads are aligned. Finally, reads were aligned and genotypes called, followed by quality filtering that accounted for the experimental design.
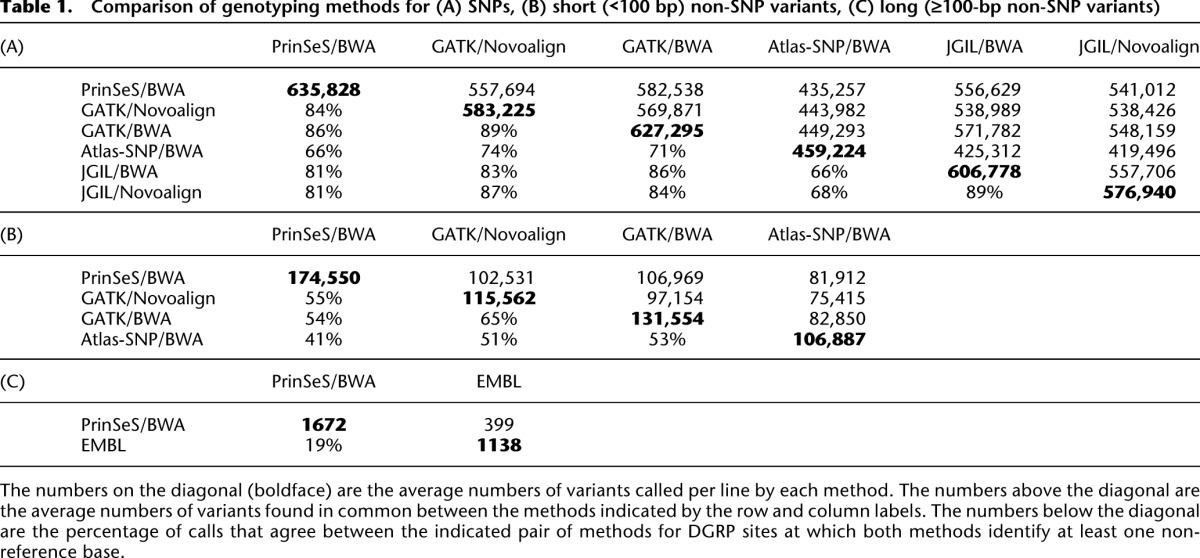
On average, the methods called over 580,000 SNPs, and 130,000 small (<100 bp) and 1400 large (≥100 bp) non-SNP variants per line; however, there was heterogeneity in the number of variants called by each method and the overall concordance among methods (Table 1). Therefore, we implemented an integrated genotyping algorithm, first using the combined data from all variant calling methods to update the genotypes of each DGRP line, then using the 205 variant call lists to genotype each DGRP line (Fig. 1). We identified 6,149,882 unique variants, including 4,853,802 SNPs and 1,296,080 non-SNP variants. The majority (98.28%) of the non-SNP variants were <100 bp.
Table 1.
Comparison of genotyping methods for (A) SNPs, (B) short (<100 bp) non-SNP variants, (C) long (≥100-bp non-SNP variants)
Validation of genotype calls
We used three strategies to validate genotype calls. First, we targeted 384 small (1–18 bp) indels affecting coding regions and 384 randomly chosen larger (30–313 bp) indels for validation by Sanger sequencing in five DGRP lines. A total of 315 small and 384 large indels were successfully assayed with Sanger technology for at least three lines. Of the 1463 small indel/line and 1876 large indel/line combinations with both Sanger and Illumina calls, 1458 (99.66%) and 1872 (99.79%), respectively, were concordant (Supplemental Data Files S2, S3).
Second, we performed high-density tiling microarray-based validation experiments using published data for six DGRP lines (Zichner et al. 2013) to assess the accuracy of the genotyping of larger deletions (>25 bp). We evaluated 3930 deletions ranging in size from 27 to 7533 bp. Of 5957 deletion/line comparisons, 5170 (86.8%) were true positives and 787 (13.2%) were false positives (Supplemental Fig. S1).
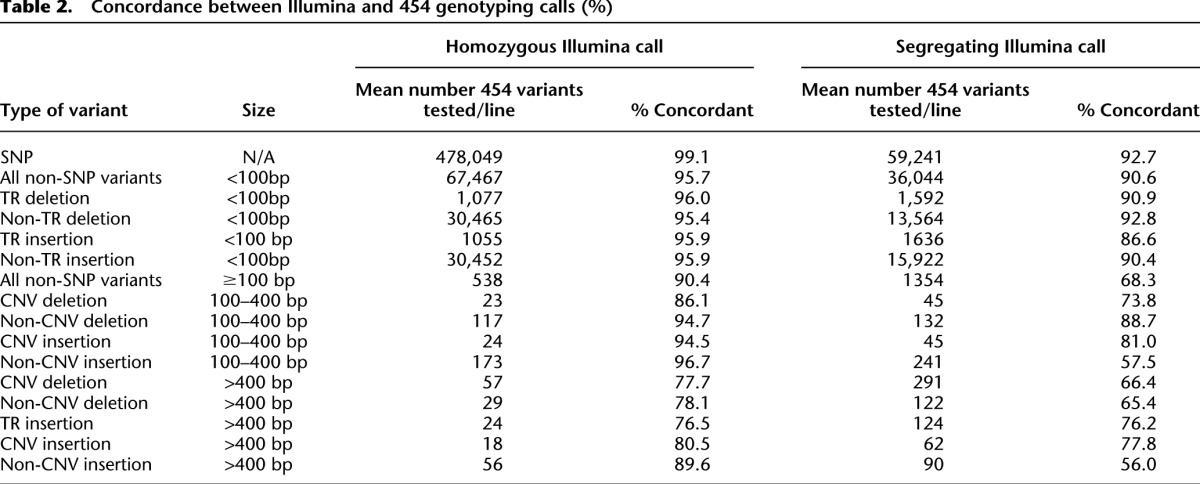
Third, we used the 454 sequence data from 38 lines (Mackay et al. 2012; Supplemental Table S1) to validate SNP and non-SNP calls. We used our integrated genotyping algorithm to call variants but restricted the input variant list to the final calls from the Illumina genotyping analysis. Using the same genotyping pipeline but a different sequencing chemistry serves to validate the Illumina data generation process. We used Fisher’s exact test to statistically evaluate whether the Illumina and 454 genotypes were concordant or discordant, using a nominal 5% significance threshold to declare discordance (Table 2; Supplemental Data File S4). Concordance was greater for homozygous than segregating Illumina calls for all variant types, was best for SNPs, and declined with increasing size of insertions and deletions. We conclude that our calls of homozygous SNP and small non-SNP genotypes, which comprise the vast majority of variants, are accurate and that large insertions and deletions should be independently confirmed using other methods.
Table 2.
Concordance between Illumina and 454 genotyping calls (%)
We compared Freeze 2.0 variants and genotypes with the Freeze 1.0 SNP calls. Of the 5,222,888 polymorphic SNPs in the 158 lines with Freeze 1.0 Illumina data, 4,215,573 are present in the initial Freeze 2.0 call set. The reduction in number of SNP calls was mostly attributable to low frequency SNPs and/or SNPs near indels (Supplemental Fig. S2), suggesting that our integrated variant calling approach eliminated false SNPs near indels. Using a model tailored to the experimental design (Stone 2012), we generated quality scores for each of the 6,149,882 variants and for each genotype in each line. We filtered the genotypes based on the quality scores and limited all subsequent analyses to the 4,438,427 biallelic variants meeting the thresholds. For SNPs that were present in both freezes, the concordance rate between the homozygous genotypes was uniformly high (0.9988–0.9996) in all lines.
Variation in numbers of segregating sites
The DGRP lines were derived by 20 generations of full-sib inbreeding and have an expected inbreeding coefficient of F = 0.986 (Falconer and Mackay 1996). Therefore, we expect that 1.4% of the variants will remain segregating, under the assumption of selective neutrality. Deleterious variants may be eliminated more rapidly than expected, while an increase in the number of segregating variants could occur from overdominant variants or from de novo mutations. Natural selection favoring heterozygotes can oppose fixation by inbreeding if there is true overdominance for fitness at individual loci or associative overdominance arising from complementary deleterious alleles that are closely linked in repulsion. If complementary deleterious alleles are embedded in polymorphic genetically divergent inversions, inversion heterozygotes may be polymorphic over the entire inverted region. Finally, the appearance of segregating sites can be generated if duplicate, divergent paralogous genes were mapped to a single gene of the pair.
We assessed the number of segregating sites for each line by chromosome (Supplemental Data File S5) and found substantial variation in the number of segregating sites between and within chromosomes. Approximately 96% of the lines had 2% or fewer segregating X-linked variants, while on average 84% of the lines had 2% or fewer segregating autosomal variants (Fig. 2). Therefore, inbreeding was successful for the majority of variants. However, the distribution of the number of segregating sites on the autosomes was bimodal. In total, 62 of the 820 DGRP line/autosome combinations had ≥9% variants segregating; ≥20% variants remained segregating in 28 chromosomes (Supplemental Data File S5; Fig. 2).
Figure 2.
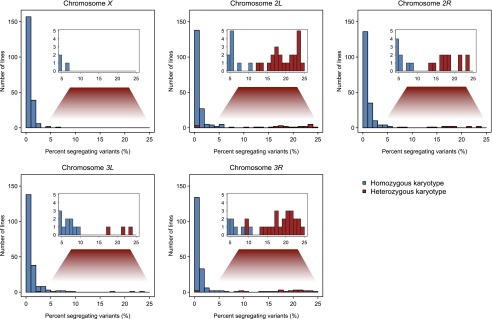
Distributions of the percent segregating variants in 205 DGRP lines, by chromosome. The distributions for homozygous standard or inverted karyotypes are given in blue, and the distributions for inversion/standard heterozygotes are given in red.
Inversion genotypes
D. melanogaster populations harbor polymorphic inversions (Stalker 1976; Mettler et al. 1977; Corbett-Detig and Hartl 2012). Recombination is suppressed between the inverted sequence and standard karyotype, leading to divergence between inversions and homo-sequential regions (Navarro et al. 1997, 2000; Andolfatto et al. 2001) and the potential for evolution of coadapted gene complexes (Kirkpatrick and Barton 2006; Hoffmann and Rieseberg 2008). A likely explanation for the large numbers of segregating autosomal variants in specific regions of some lines could be heterozygosity for inversions that are genetically divergent from the standard karyotype. Therefore, we determined inversion genotypes of the DGRP lines by cytogenetic analysis of polytene salivary gland chromosomes.
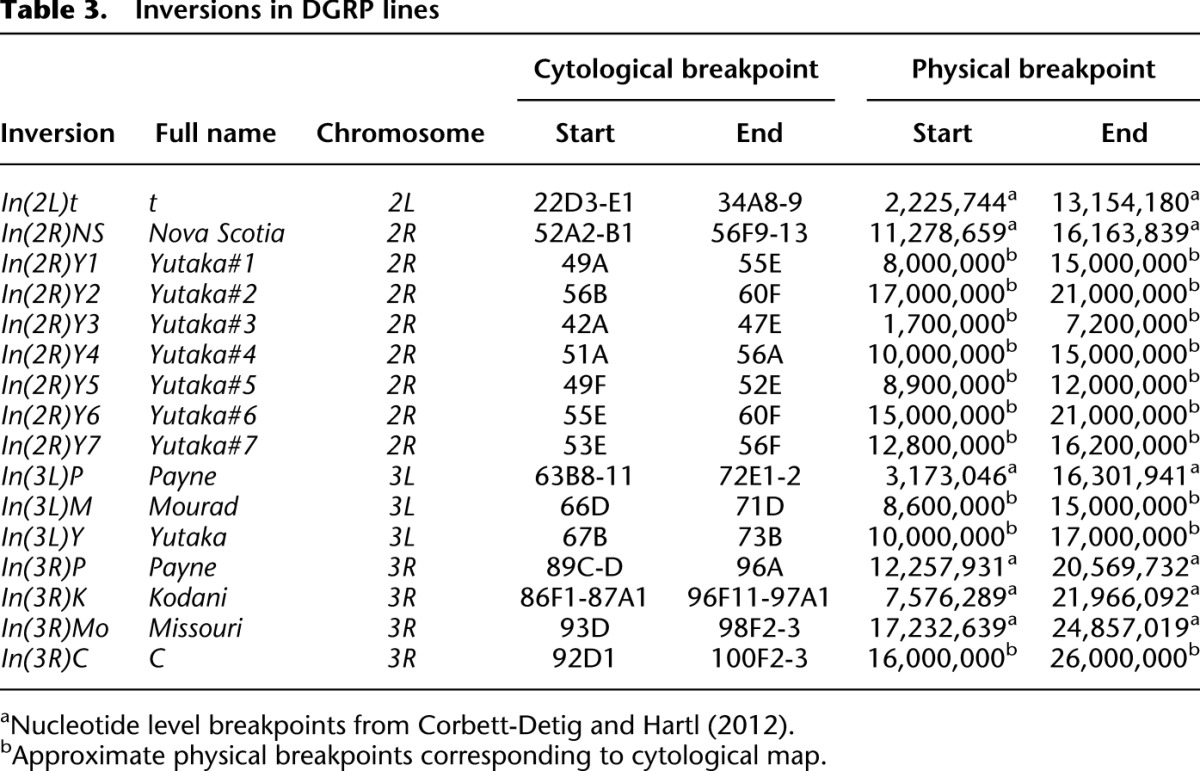
We identified 16 different segregating autosomal inversions (Table 3; Supplemental Data File S6). Of the 62 autosome/DGRP line combinations with >9% segregating sites, 60 had at least one heterozygous inversion, while two were the standard karyotype (Fig. 2). A possible explanation for the two exceptional karyotypes is that an inversion segregated in these lines when they were sequenced, but the standard karyotype was fixed in the interval between sequencing and the cytological analysis. Of the 758 autosome/DGRP line combinations with fewer than 9% segregating sites, 752 were homozygous for either the inverted or standard sequence (Fig. 2). However, six inversion heterozygotes (one for In[3L]Y, two for In[3R]Mo, and three for In[2L]t) had very low numbers of segregating sites. In(3L)Y is only present as a single heterozygote in the sample and could be of recent origin and hence not genetically differentiated from the standard karyotype. However, other chromosomes heterozygous for In(3R)Mo and In(2L)t had large numbers of segregating sites (Supplemental Data Files S4, S5). Possibly, these inversions do not have a single origin, and the old and new inverted sequences are segregating in the DGRP; or they could have undergone an even number of recombination events as heterokaryotypes, recovering a standard nucleotide configuration. Nevertheless, there is nearly a perfect correlation between large numbers of segregating sites and inversion heterozygosity (Fisher’s exact test P = 1.91 × 10−81).
Table 3.
Inversions in DGRP lines
Wolbachia infection
Wolbachia pipientis is a maternally transmitted endosymbiotic bacterium that infects ∼20% of all insects (Dunning Hotopp et al. 2007). Wolbachia can manipulate host biology to increase production of infected females, and hence its own transmission (Hoffmann et al. 1986). D. melanogaster populations worldwide are polymorphic for Wolbachia infection (Richardson et al. 2012). Wolbachia infection in D. melanogaster has been associated with resistance to infection by RNA viruses (Teixeira et al. 2008), but the full range of effects of Wolbachia on development, physiology, reproduction, and quantitative traits is unknown. We determined the Wolbachia infection status of the Freeze 2.0 DGRP lines, finding that ∼53% of the lines are infected (Supplemental Data File S7). Wolbachia sequences have been inserted into eukaryotic genomes (Dunning Hotopp et al. 2007). Therefore, we examined the DGRP lines for evidence of similar lateral gene transfer events and found that all infected lines had predicted insertions of ∼180-bp Wolbachia sequence at two genomic locations (Supplemental Fig. 3). However, PCR-based analyses revealed that only four DGRP lines contained the Wolbachia insertions (Supplemental Fig. S3). The insertions were incorrectly called in the remaining lines infected with Wolbachia because Wolbachia sequence reads were present for these lines, and the genotyping algorithm assigned them to the location to which they uniquely mapped in the four lines. This artifact did not occur for any other large insertions, all of which were either unique, as expected for a new D. melanogaster sequence present in DGRP lines but not the reference strain, or were homologous to other D. melanogaster sequences, as expected from insertions arising from transposable elements (TEs), local tandem duplications, and nonhomologous recombination.
Variation in genome size
The large numbers of insertions and deletions suggest that the DGRP lines may vary in genome size. We estimated total genome size for each line using flow cytometry (Hare and Johnston 2011). There is significant variation in genome size (ANOVA F204, 811 = 2.61, P < 0.0001), ranging from 169.7 to 192.8 Mb (Supplemental Fig. S4; Supplemental Data File S8). Genome size differences were verified by the presence of double peaks in copreparations from lines with different average genome size (Ellis et al. 2014). The mean genome size of all lines (175.6 Mb) is close to that of the reference strain (175 Mb). The distribution is skewed toward the accumulation of large genomes, suggesting greater constraint on genome reduction than expansion.
Lines homozygous for In(2R)NS, In(3L)P, and In(3R)K and heterozygous for In(3L)Y had larger average genome sizes than the corresponding standard homozygous karyotypes, whereas lines homozygous or heterozygous for all other inversions had smaller average genome sizes than the standard karyotypes. We regressed genome size on the total number of “smaller” inversions and found a significant negative effect (b = −0.52, F1,203 = 8.25, P = 0.0045) (Supplemental Fig. S5). Although inversions account for only 4% of the variation in genome size, the magnitude of the effect is substantial at 0.5 Mb per inverted region.
Population genomics of indels
Previously, we performed a population genomic analysis of SNPs in the DGRP Freeze 1.0 (Mackay et al. 2012). The SNP genotype calls are highly correlated between Freeze 1.0 and Freeze 2.0. Spearman rank order correlations (ρ) for estimates of SNP nucleotide polymorphisms (π) (Nei 1987) among 100-kb nonoverlapping windows range from ρ = 0.94 for the X chromosome to ρ = 0.99 for 3R (Supplemental Table S1). Since population genomic inferences from analyses of SNP variation remain the same, we primarily focus here on indel variation.
We defined insertions and deletions in our variant calling algorithm with respect to the reference sequence. For population genetic inferences, we polarized insertion/deletion status evolutionarily with respect to Drosophila simulans and determined the ancestral and derived status of 210,268 biallelic indels. We found that 86% of “deletions” and 74% of “insertions” inferred from the reference genome were true deletions and insertions according to the polarized estimates.
Evolutionarily derived deletions (n = 145,015; 69%) outnumber insertions (n = 65,253; 31%) by 2.2:1 (Supplemental Table S2; Supplemental Fig. S6). This estimate is among the highest estimates of the deletion:insertion ratio for D. melanogaster but is consistent with previous estimates that indicate a bias toward higher deletion than insertion rates (Petrov 2002; Ometto et al. 2005; Assis and Kondrashov 2012; Leushkin et al. 2013). There are, on average, 60% fewer deletions ( = 3815, P = 0) and 74% fewer insertions (
 = 645.6, P = 0) on the X chromosome than on the major autosomal chromosomal arms (Supplemental Table S1), consistent with stronger selection against indels on the X chromosome. The observed bias toward deletions is not an artifact of the greater difficulty of calling large insertions than deletions. We called approximately equal numbers of insertions and deletions except for the largest variants, where we called more deletions than insertions relative to the reference (Table 2). Thus the calling bias is only for variants >400 bp. Since such variants are a very small fraction of the total, this bias cannot account for the excess of evolutionarily derived deletions.
Although most indels are small (1–2 bp), deletions are, on average, larger than insertions (Supplemental Table S2; Supplemental Fig. S6). However, the longest indels are insertions, most of which correspond to P transposable elements which have recently colonized the D. melanogaster genome (Kidwell 1993). Most large insertions are located in centromeric regions. The distributions of indel size are similar for 3′ and 5′ UTRs, large and small introns, and intergenic regions, while the size distribution of indels in coding regions has discrete “peaks” for indel sizes in multiples of 3 bp (Supplemental Fig. S7). This pattern suggests strong negative selection against frame-shifting indels compared to more relaxed selection for insertions and deletions spanning complete codons, a phenomenon previously reported for 39 DGRP lines (Massouras et al. 2012) and in humans (Montgomery et al. 2013).
The minor allele frequency (MAF) spectra (Supplemental Fig. S8) show an excess of low MAF indels compared to SNPs for all functional classes. Given that lower MAF variants are likely enriched for variants under purifying selection, these data are consistent with deleterious fitness effects of indels (Massouras et al. 2012). Insertions and deletions causing coding sequence frame-shifts are highly overrepresented among the low derived allele frequency (DAF) class (Supplemental Fig. S9), reinforcing the conclusion that negative selection is intense on this indel class. Relative to presumed neutral variants (synonymous SNPs and SNPs in small introns), all deletion classes have an excess of low-frequency derived alleles on all chromosomes. In contrast, the number of low-frequency derived insertion alleles is similar to or less than presumed neutral SNPs for insertions in small introns and nonframe shifting coding sequence insertions on the X chromosome. There is also a slight excess of high-frequency derived insertions compared to SNPs in all chromosomes and all functional categories except frame-shift insertions. This could indicate more positive selection on insertions than deletions.
These results suggest that natural selection acts differently on insertions and deletions, with stronger purifying selection on deletions (Petrov 2002; Assis and Kondrashov 2012; Leushkin et al. 2013). This is consistent with the mutational equilibrium theory for genome size evolution (Petrov 2002), where optimal genome size is maintained by purifying selection on small deletions and less selection on long insertions, compensating for sequence loss. This inference from population genomic analysis is consistent with the skewed distribution of genome sizes toward larger genomes.
Nonrandom distribution of SNPs and indels
Previously, we found that SNP nucleotide polymorphism (π) in the DGRP was reduced near centromeres and telomeres and was positively associated with local recombination rate (for recombination rates < 2 cM/Mb) (Mackay et al. 2012). The pattern of πindel along chromosomes is similar to that of SNP nucleotide diversity (Supplemental Fig. S10). There is a strong positive correlation between indel and nucleotide diversity for all chromosome arms (Supplemental Table S3; Massouras et al. 2012). Several biological mechanisms have been proposed for the clustering of SNPs and indels, which appears to be ubiquitous in prokaryotes and eukaryotes (Tian et al. 2008; Hodgkinson and Eyre-Walker 2011; McDonald et al. 2011; Jovelin and Cutter 2013). Possibly indels (Tian et al. 2008; Jovelin and Cutter 2013) and repeats (McDonald et al. 2011) are mutagenic because they induce error-prone DNA polymerase replication near the indel or repeat (Yang and Woodgate 2007); the regions in which SNPs and indels occur are inherently mutagenic; or SNPs and indels are subject to the same population genomic processes.
To test the hypothesis that indels are mutagenic, we plotted the number of SNPs ± 100 bp from indels with MAF between 0.4 and 0.5, for different SNP minor allele counts. Intermediate-frequency SNPs are clustered near intermediate-frequency indels (Fig. 3A). Assuming intermediate-frequency indels are older than low-frequency indels, we expect enrichment for SNPs of all minor allele counts near them, since they would continuously generate new mutations. We did not observe this pattern (Fig. 3A). The same analysis for SNPs near intermediate-frequency noncoding focal SNPs also shows an elevated density of SNPs surrounding the focal SNPs (Fig. 3B), indicating that variant clustering is not unique to indel-containing regions. Thus, variant clustering is unlikely to be driven by indels. To test the hypothesis that regions containing increased polymorphism for SNPs and indels have elevated mutation rates, we performed similar analyses for the same regions, but using the lines that do not contain the focal indel alleles. The regions lacking indels contained fewer variants than those with the respective indels (Fig. 3), refuting the locally increased mutation rate hypothesis.
Figure 3.

Nonrandom distribution of variants. The average number of SNPs (y-axis) for each distance in bp (x-axis) from either side of a variant of high frequency (MAF 40%–50%). Solid lines represent the number of SNPs of a given range of allele counts in lines that have the variant in question, whereas dashed lines show the number of SNPs in lines that do not have the variant. (A) Indels. (B) Noncoding SNPs.
Evolutionary models of hitchhiking and background selection predict a positive correlation between recombination and polymorphism for all variants (Begun and Aquadro 1992; Charlesworth et al. 1993). We replicated our previous observation (Mackay et al. 2012) that SNP polymorphism is positively correlated with the local recombination rate, and extended this observation to insertions and deletions (Supplemental Table S3). Thus, local recombination rate affects the patterning of all types of variants, implicating evolutionary processes as the likely explanation for the observed clustering of variants. The lack of correlation between recombination and divergence for SNPs and indels (Spearman ρ = 0.037 genome-wide, P = 0.205) excludes mutations associated with recombination as the cause of the correlation between π and local recombination.
Distribution of variants in chromatin domains
We determined enrichment or depletion of variants for five chromatin types (Supplemental Data File S9; Filion et al. 2010). Broadly expressed euchromatic genes that perform universal housekeeping functions are depleted of variants, consistent with purifying selection on these genes. Narrowly expressed euchromatic genes associated with more specific biological processes (Filion et al. 2010; van Steensel 2011) are enriched for variants, particularly in coding regions, suggesting that they are under less purifying selection and potentially more rapidly evolving than genes in other chromatin classes. Genes bound by Polycomb Group protein complexes and enriched for the repressive histone mark H3K27me3 are also enriched for variants, which is surprising because Polycomb-associated genes typically regulate developmental processes and are thought to be under strong purifying selection. Genes marked by Heterochromatin Protein 1 binding are located in pericentric regions and are strongly depleted for SNPs and small (<100 bp) indels, but enriched for larger (≥100 bp) indels, consistent with our observation that centromeric regions have reduced nucleotide and indel diversity and larger insertions. Interestingly, segmental duplications are highly biased toward centromeric regions in the human genome (She et al. 2004). The most prevalent type of repressive chromatin covers 48% of the genome and marks genes with low expression levels that are generally enriched for variants. While the chromatin classes were derived from one cell type and should be interpreted with caution, our results show that variants are nonrandomly distributed with respect to the chromatin state of the underlying DNA sequence.
Population genomics of inversions
Levels and patterning of polymorphism are affected by the recombinational landscape and natural selection, both of which are different for regions bearing chromosomal inversions (Navarro et al. 1997; Andolfatto et al. 2001). Recombination is reduced in inversions and is pronounced near the breakpoints of paracentric inversions such that the sequence immediately adjacent to the inversion breakpoint rarely recombines. Recombination is also reduced in inversion heterozygotes because single recombination events within the inverted region lead to inviable aneuploid gametes. However, genetic exchange still occurs in inverted segments from multiple recombination events and/or gene conversion. Thus, we expect young inversions to have reduced genetic diversity but little divergence from their standard karyotype progenitor, while regions harboring older inversions will separately accumulate mutations in the standard and inverted sequences that lead to differentiation between them. We expect polymorphism to be less within inversion karyotypes, and genetic differentiation to be greater between inversion karyotypes in the regions proximal to the breakpoints than the more central regions of the inverted sequence (Navarro et al. 2000).
Our observation that lines polymorphic for inverted and standard karyotypes have large numbers of segregating sites indeed implies that the inverted and standard karyotypes are genetically divergent. We calculated π for the inverted regions within lines with inverted and standard karyotypes, as well as between the inverted and standard karyotypes (Fig. 4). In all cases, the divergence between karyotypes is higher than the average nucleotide diversity within standard and inverted karyotypes (Fig. 4). However, local variation in polymorphism and diversity swamps any signal of reduction in polymorphism within and increase in diversity between inversion karyotypes near the breakpoints relative to the central regions (Supplemental Fig. S11).
Figure 4.

Nucleotide diversity (π) within standard karyotypes (blue bars), within inverted karyotypes (red bars), and between standard and inverted karyotypes (purple bars) within genomic regions encompassed by common polymorphic inversions. The calculation was based on nonmissing genotypes only, with indels (>1 bp) or multiple nucleotide polymorphisms receiving the same weight as SNPs regardless of their length.
Functional annotation of segregating variants
We annotated functional consequences (Supplemental Table S4) of individual segregating variants, identifying 6637 potentially damaging variants that affect splice donor or acceptor sites, cause frame-shift mutations, loss of start or stop codons, or lead to premature stop codons. Collectively, they affect 3868 genes in at least one DGRP line. The allele frequency distribution of these potentially damaging variants is shifted to the lower end of the frequency spectrum relative to those of less damaging variants (Supplemental Fig. S12), as expected if they have deleterious fitness effects.
Next, we identified closely linked cosegregating variants that might ameliorate these potentially damaging variants (Gan et al. 2010). We found pairs of compensatory variants (SNPs that rescue a premature stop codon variant and indels in the same genes that compensate each other to avoid frame-shifts) in an average of 50 genes per line and a total of 403 compensated genes in all lines. These compensatory variants are largely in close physical proximity (1–2 bp) and in near complete linkage disequilibrium (D′ ∼ 1) (Supplemental Fig. S13). In all cases, variants that would otherwise introduce a premature stop codon are present only in lines carrying the compensatory variants. Given their close proximity, recombination events are unlikely to occur between pairs of adjacent compensated variants. This suggests that the compensatory variants at these codons most likely occurred first in the population, thus allowing the second mutation to occur without introducing a stop codon. Consistent with our inferred timeline of mutations, these compensated variants segregate at higher frequency in the DGRP than other potentially damaging variants (Supplemental Fig. S14).
Finally, we performed gene-centric annotation by integrating all sequence variations overlapping coding regions in each DGRP line to take into account the widespread occurrence of multiple variants in single genes. We found 2169 genes whose proteins are damaged by the combination of all variants in them in at least one DGRP line (∼15% of Drosophila protein coding genes) (Supplemental Data File S10). On average, each of these affected genes is damaged in ∼13 of the 205 DGRP lines, and each line contains ∼136 potentially damaged genes (Fig. 5). These potentially damaging variants and genes are a new source of novel mutations for functional analyses. Gene ontology enrichment analysis showed that multigene families affecting chemosensation, detoxification of xenobiotic substances, immune and defense response, and proteolysis are enriched for damaged genes (Supplemental Data File S11). The same gene families are rapidly evolving along the Drosophila phylogeny (Drosophila 12 Genomes Consortium 2007).
Figure 5.

Histograms of the numbers of DGRP lines containing each damaged gene (left) and the number of damaged genes per DGRP line (right).
Genetic relationships among DGRP lines
Genetic diversity is highly elevated between inverted and standard karyotypes in the region of the inversion. Thus, we expect that individuals of the same inversion karyotype will be more related to each other than to individuals of the standard karyotype. Therefore, we quantified patterns of genetic relatedness among the DGRP lines by constructing the genetic relationship matrix between all pairs of DGRP lines (Supplemental Fig. S15; Van Raden 2008; Ober et al. 2012). The distribution of relatedness is bimodal with the major peak centering around zero and the vast majority of pairwise relatedness within the range of distance to the reference strain (Fig. 6). The minor peak consists of 567 pairs (2.7% of all possible pairs) with relatedness greater than 0.05. There are 11 pairs (0.05% of all possible pairs) among 16 lines that have a genomic relationship greater than 0.5. Therefore, most DGRP lines are unrelated, consistent with sampling from a large, randomly mating population. However, some lines have higher genomic relatedness due to cryptic genetic relatedness (Astle and Balding 2009), possibly caused by sampling siblings from the natural population and/or shared inversion karyotypes.
Figure 6.

Histogram of genomic relationships among DGRP lines (20,910 possible pairs). The distribution of the relationship between all DGRP lines and the reference sequence is displayed as a box plot.
Principal component (PC) analysis reveals clusters of related lines that carry major inversions. The first two PCs separate lines carrying both In(2L)t and In(3R)Mo from all other lines (Fig. 7A), while the first and third PCs discriminate lines with In(2L)t from those with In(3R)Mo (Fig. 7B). The PC clustering by inversions disappears when variants within the inverted regions are excluded (Fig. 7C). Lines with the same inversions are more related to each other than are lines homozygous for the standard karyotype (Supplemental Fig. S16), confirming that the PC clusters are driven by increased average genomic relationships within inversions.
Figure 7.
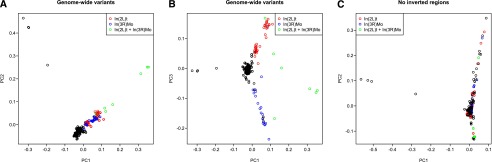
Principal component analysis of DNA sequence variation in the DGRP. Principal components (PCs) are computed using EIGENSTRAT. (A) PC plot of PC1 versus PC2. (B) PC plot of PC1 versus PC3. (C) PC plot of PC1 versus PC2 after PCs were recomputed excluding all variants in regions encompassing major inversions (In[2L]t, In[2R]NS, In[3R]P, In[3R]K, In[3R]Mo). With the exception of four highly related pairs of lines, there is no apparent clustering of karyotype groups.
We also computed genomic relationships separately for each chromosome arm (Supplemental Fig. S17). The chromosome-wide relationships among the lines are specific to each arm and are different from the genome-wide pattern (Supplemental Fig. S17). The genomic heterogeneity of relatedness among chromosomal arms suggests that population structure other than the known inversions is likely minimal; otherwise, inter-chromosomal correlation of relatedness would arise.
Linkage disequilibrium
We assessed pairwise linkage disequilibrium (LD) between polymorphic variants using the r2 parameterization (Hill and Robertson 1966). Average LD decays rapidly as the distance between the variants increases, and the rate of decay is substantially lower on the X chromosome than autosomes (Fig. 8A), consistent with previous observations based on fewer DGRP lines and SNP variants only (Mackay et al. 2012). There is substantial variation in local LD along the genome (Fig. 8B). In general, LD near centromeres and telomeres is significantly greater than in other chromosomal regions.
Figure 8.
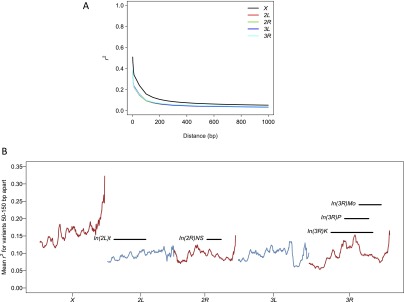
Patterns of LD. (A) Decay in LD with physical distance, by chromosome arm. (B) Genome-wide spatial variation in LD. Mean r2 between variants within 50–150 bp of each other in sliding windows (in 100-kb steps) of 1 Mb is plotted.
The rapid decline in local LD with physical distance is favorable for identifying causal genes and possibly variants in genome-wide association (GWA) studies using the DGRP. However, long-range LD could significantly impair our ability to identify QTLs. For each of 1000 randomly sampled variants with a specified number of minor alleles in the population, we counted variants that are in strong LD (r2 > 0.95) with it locally (within 1 kb) and genome-wide. There are consistently very few (mean = 1.43) variants in high local LD with the focal variant. However, the number of long-range variants in high LD with focal variants depends on the minor allele count of the focal variant and can be in the thousands for very low frequency variants (Fig. 9). Although local LD does not seem to differ for the regions with or without inversions (Fig. 8B), long-range LD as measured by the number of nonlocal variants in high LD is greater for variants within inversions (Fig. 9). Therefore, GWA studies based on individual variants should be restricted to common polymorphisms and also take into account inversions.
Figure 9.
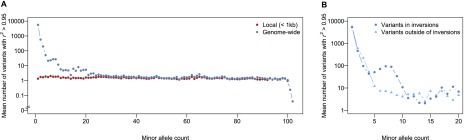
Relationship between LD and minor allele count. For each of the minor allele counts, 1000 random variants are sampled, and the mean number of variants genome-wide or locally (<1 kb) in strong LD (r2 > 0.95) with the focal variant is calculated. (A) Relationship between the mean number of variants in strong LD with the focal variant and minor allele count. (B) Relationship between the mean number of variants in strong LD with the focal variant and minor allele count, stratified according to the location of the focal variant (within or outside of inversions).
Associations between quantitative traits, Wolbachia, inversions, and genome size
The range and magnitude of effects of Wolbachia infection and segregating inversions on organismal phenotypes is not known. Therefore, we assessed to what extent inversion genotypes and Wolbachia infection status are associated with starvation resistance, startle response, time to recover from chill coma (Mackay et al. 2012), resistance to acute (Weber et al. 2012) and chronic (Jordan et al. 2012) oxidative stress, several sleep phenotypes (Harbison et al. 2013), and olfactory behavior (Swarup et al. 2013). The effect of Wolbachia is only significant for acute and chronic resistance to oxidative stress (Supplemental Table S5). In(3R)K is associated with starvation resistance in females and acute oxidative stress resistance in males; In(2L)t, In(2R)NS, and In(3R)Mo are associated, often strongly and in a sex-specific manner, with sleep traits; and In(2L)t and In(3R)Mo are associated with olfactory behavior in both sexes (Supplemental Table S5). The DGRP lines vary significantly in genome size, which could also affect variation in quantitative trait phenotypes. However, correlations of quantitative traits with genome size were small for all traits and not significant in any analysis.
Genome-wide association analyses in the DGRP
Prior to performing GWA analyses using the DGRP, we must adjust the phenotypic data to account for cryptic genetic relatedness, effects of inversions (lines with the same inversion karyotype have higher relatedness, and there is elevated LD within inverted regions) and Wolbachia infection status. Association tests can be performed for individual variants or by gene. The former can identify putative causal alleles but is restricted to the 1,920,276 variants with minor allele frequencies ≥0.05 to avoid spurious associations due to LD caused by limited sample size (Fig. 9). Gene-based tests can interrogate the remaining variants with low allele frequencies, which should contribute substantial variation if variation in the trait is maintained by mutation-selection balance (Turelli 1984), and can also evaluate effects of common variants and all variants. However, they are sensitive to the exact methods used for weighting variants within a gene (Madsen and Browning 2009; Han and Pan 2010; Wu et al. 2010, 2011; Lee et al. 2012). In either scenario, we perform associations on the adjusted phenotypic values using a model that accounts for cryptic relatedness among the lines. For single marker association, we use a mixed model that incorporates the relationship matrix, whereas for the gene-based tests, we add covariates corresponding to the major principal components that account for relatedness. We performed GWA analyses for starvation resistance, a classic quantitative trait, Wolbachia infection status (in this case, the data were not corrected for Wolbachia infection), and genome size (Supplemental Data Files S12, S13; Supplemental Text S1).
The need to adjust for Wolbachia and inversions and account for relatedness is illustrated by quantile-quantile plots (Supplemental Fig. S18) from single variant GWA analysis of starvation resistance in females, which is associated with In(3R)K (Supplemental Table S5). Unadjusted data show substantial systematic inflation of test statistics, while adjusting for Wolbachia and inversions and accounting for relatedness using a mixed model significantly alleviate the inflation. The top associations for the individual and gene-based tests for all three traits are only partially overlapping, highlighting the complementary nature of these tests. Only a few variants/genes reached conservative Bonferroni-adjusted significant thresholds, and all suggest novel candidate genes affecting the traits. Examples include a SNP in genghis khan (gek, a protein kinase), associated with female starvation resistance, and SNPs in pointed (pnt, a transcription factor) and CG32521 (a gene of unknown function), associated with genome size. myotubularin (mtm), which is involved in chromosome segregation and the mitotic cell cycle (McQuilton et al. 2012), is a plausible candidate gene associated with genome size and reached Bonferroni-level significance in the gene-based tests of association with this trait.
Discussion
Here, we present a molecular polymorphism map for 205 sequenced inbred D. melanogaster lines comprising Freeze 2.0 of the DGRP. We utilized seven different algorithms for detecting variants to produce a consensus variant list, and further fine-tuned the variant calls for each line using an integrated genotyping strategy that borrows power from the variant calls in all lines. We further provide quality scores for all 4,853,802 SNP and 1,296,080 non-SNP variants using a method that takes into account the experimental design used to generate the DGRP. Independent validation of variant calls gives low false positive rates for SNPs and small (<100 bp) indels, which comprise >98% of all variants. We performed a cytogenetic analysis of large segregating inversions, genotyped all lines for the presence of the maternally transmitted Wolbachia endosymbiont, and estimated genome size by flow cytometry. These data provide a comprehensive characterization of natural variation in genome architecture in this powerful genetic model organism that can be used to gain insights about natural selection and the evolution of genome size, and enhance the functional annotation of the D. melanogaster genome. We also describe improved statistical methodology for genome-wide association mapping of quantitative traits in a scenario where all variants are known and the rapid decay in LD with physical distance enables high-resolution mapping.
Our molecular population genomic analysis of evolutionarily polarized deletion and insertion variants showed that deletions outnumber insertions by a ratio of greater than 2:1, consistent with previous studies on smaller data sets, suggesting a bias toward the deletion mutation rate in Drosophila (Petrov 2002; Assis and Kondrashov 2012; Leushkin et al. 2013). Site frequency spectra show an excess of low-frequency polymorphisms compared to SNPs for insertions and deletions from all functional categories but especially for frame-shifting indels, implicating strong purifying selection against these variants. However, the site frequency spectra suggest stronger selection on deletions than insertions, which could lead to the maintenance of an optimal genome size (Petrov 2002). Our direct observation of variation in genome size in the DGRP, which varies by ∼14%, is in accord with this hypothesis. This variation in genome size is similar to that observed for an Arabidopsis thaliana population in Sweden (Long et al. 2013). The distribution of genome size variation is skewed toward larger genomes, consistent with stronger purifying selection against deletions than insertions.
As observed previously (Tian et al. 2008; McDonald et al. 2011; Massouras et al. 2012; Jovelin and Cutter 2013), we found a strong positive correlation between the genomic distribution of indels and SNPs. These correlated patterns of polymorphism are, in turn, correlated with local recombination, suggesting that the nonrandom distributions are due to hitchhiking and background selection (Begun and Aquadro 1992; Charlesworth et al. 1993). Alternative explanations that indels are mutagenic or that the highly polymorphic regions have high mutation rates were not supported by our analyses.
Inversions are islands of genomic divergence in this D. melanogaster population. Nucleotide diversity is elevated between inverted and homo-sequential genomic regions relative to the average diversity of inverted and standard regions, and consequently, lines heterozygous for inversions have large numbers of segregating sites in the region encompassed by the inversion. There is a greater extent of long-range LD within inverted sequences than the same regions on the standard karyotypes, indicative of lower recombination rates and effective population sizes of inversions. It is intriguing that variation in genome size is significantly associated with inversions. The mechanistic basis of increased or decreased genome size in the different inversion karyotypes is an open question for future study. Previously, we inferred that there was little global population structure in the DGRP from our eigen-decomposition of the genetic covariance matrix, but noted that the large variance in this decline did not preclude local structure due to structural variation (Mackay et al. 2012). Here, we performed a more comprehensive analysis of variation in genetic relatedness in the DGRP and showed that individuals with the same inversion karyotype are more related to each other than to individuals of the standard karyotype, accounting for most of the variation in relatedness among the DGRP lines and local structure. Inversions can harbor “coadapted gene complexes” associated with fitness (Dobzhansky 1937), and indeed, many fitness-related traits have been associated with inversion polymorphism in Drosophila species (Hoffmann and Rieseberg 2008). We showed that variation in starvation and oxidative stress resistance, sleep traits, and olfactory behavior are all associated with inversion polymorphism, and future evaluation of more quantitative traits in the DGRP will provide a detailed picture of effects of inversions on complex traits.
Lateral gene transfer of Wolbachia sequences into insect genomes is common, most likely because its presence in developing gametes is a favorable scenario for germline integration (Dunning Hotopp et al. 2007). Lateral gene transfer is a potential mechanism for the acquisition of novel genes, but to date has not been reported for Wolbachia sequences in D. melanogaster. We identified two different insertions of small Wolbachia insertions in four DGRP lines. Future analyses of the transcriptomes of these lines will reveal whether the insertions are transcribed and potentially functional. The forces maintaining Wolbachia infection in D. melanogaster populations near 50% remain mysterious. Although infection status has been associated with resistance to infection by RNA viruses (Teixeira et al. 2008), effects of Wolbachia infection on the quantitative traits assessed in the DGRP are rarely significant.
The goal of the Berkeley Drosophila Genome Project (BDGP) Gene Disruption Project (Bellen et al. 2004, 2011) is to generate mutations in all D. melanogaster genes as tools for functional analysis, and that of the Drosophila modENCODE Project (The modENCODE Consortium et al. 2010) is to identify sequence-based functional elements in Drosophila. The DGRP complements these efforts. The millions of molecular variants segregating in the DGRP are novel mutations for functional analysis and represent a different functional class from the transposon-tagged mutations produced from the BDGP Gene Disruption Project. Indeed, 15% of all D. melanogaster genes segregate for potentially damaged proteins in the DGRP, yet these damaged genes are compatible with live, fertile flies (at least under standard laboratory conditions). Molecular population genomic analyses using the DGRP highlight genomic regions under purifying selection, complementing modENCODE functional motifs. GWA analyses of quantitative traits in the DGRP provide new functional annotation of the D. melanogaster genome by identifying novel candidate genes associated with these traits. These genes typically have well-described effects on other traits, play key roles in early developmental processes, or are computationally defined genes with no known function, but have never been associated with the focal trait. Subsequently, the full power of Drosophila genetics can be applied to validating marker-trait associations: mutations, RNAi constructs, and outbred QTL mapping populations (Huang et al. 2012; Jordan et al. 2012; Weber et al. 2012; Harbison et al. 2013; Swarup et al. 2013). The future of understanding the genetic architecture of quantitative traits lies in our ability to progress from one-gene-at-a-time associations to understanding how entire genetic and transcriptional networks causally affect complex organismal phenotypes. The DGRP is an ideal resource for systems genetics (Ayroles et al. 2009; Massouras et al. 2012) and epistatic interaction network analyses (Yamamoto et al. 2009; Huang et al. 2012; Swarup et al. 2013) of molecular and complex organismal traits.
The DGRP lines, sequence data, genotypes, quality scores, and phenotypes are publicly available. The DGRP website (http://dgrp2.gnets.ncsu.edu) hosts an updated pipeline for single marker GWA analysis which accounts for effects of Wolbachia infection and major inversions as well as cryptic relatedness among the DGRP lines; a new genome browser track for visualizing individual line genotypes and functional annotations for any specified genomic region; and all published phenotypes. These data will be useful for testing new analytical methods as well as for teaching general principles of population and quantitative genetics.
Methods
DGRP lines
We established isofemale lines from gravid females collected in Raleigh, NC, and inbred them by 20 generations of full-sib mating, followed by random mating (Mackay et al. 2012). All flies were reared and all phenotypes assessed under standard culture conditions (cornmeal-molasses-agar-medium, 25°C, 60%–75% relative humidity, 12-h light-dark cycle) unless otherwise specified.
DNA isolation, library construction, and sequencing
We extracted genomic DNA from ∼500–1000 flies per DGRP line using the Gentra Puregene Tissue Kit (Qiagen) and purified the samples by phenol-chloroform extraction. We constructed high molecular weight double-strand genomic DNA samples into Illumina paired-end libraries according to the manufacturer’s protocol (Illumina) (Supplemental Text S2) and sequenced shotgun DNA libraries on the Illumina HiSeq 2000 or GAII platforms, according to the manufacturer’s specifications.
Sequence read mapping and initial genotyping
We aligned Illumina sequence reads to the Dmel 5.13 reference genome (http://flybase.org) with BWA (v0.5.9-r16) (Li and Durbin 2010) and Novoalign (Novocraft.com) using default parameters. We used GATK (v1.0.5506) (McKenna et al. 2010) software to remove duplicate sequence reads, recalibrate base quality scores, and locally realign regions around indels for BWA alignments (DePristo et al. 2011). We excluded positions with >2000 coverage and mapped reads with phred scores <25 and/or mapping quality <10. We applied GATK (v1.0.5506) (McKenna et al. 2010) and JGIL (Stone 2012) to the BWA and Novoalign alignments, and Atlas-SNP (Shen et al. 2010) and PrinSeS (Massouras et al. 2010) to the BWA alignments to genotype SNPs. We genotyped non-SNP variants <100 bp using GATK, Atlas-SNP, and PrinSeS. We genotyped non-SNP vaiants ≥100 bp using PrinSeS, DELLY (Rausch et al. 2012), Pindel (v0.2.4d) (Ye et al. 2009), CNVnator (v0.2.2) (Abyzov et al. 2011), and Genome STRiP (v1.0.4) (Handsaker et al. 2011) as described in Zichner et al. (2013).
Integrated genotyping
We performed integrative genotyping in two stages. First, we genotyped each line separately using all SNP and non-SNP variants from the output of the individual variant calling methods to provide the alternative haplotypes from which to choose variants. In the second stage, we again performed genotyping for each line, using the 205 variant lists resulting from the first stage (Supplemental Text S2). The resulting 6,149,882 nonredundant variants were then assigned variant and genotype quality scores using JGIL (Stone 2012). We retained for subsequent analyses nonoverlapping biallelic variants whose phred scale quality scores were at least 500 and genotypes whose sequencing depths were at least one and genotype quality scores at least 20. The final VCF genotype file (http://dgrp2.gnets.ncsu.edu) containing 4,438,427 variants gives the number of supporting and opposing reads for each variant in each line, genotypes with the maximum posterior probability, and the corresponding quality scores (Stone 2012).
Validation
We used three strategies to validate genotype calls. First, we performed Sanger sequencing for 384 small (1–18 bp) indels affecting coding regions and 384 larger (30–313 bp) randomly chosen indels on five DGRP lines (DGRP_304, DGRP_324, DGRP_354, DGRP_355, DGRP_395). Second, we used previously published data (Zichner et al. 2013) on genomic DNA hybridization to Affymetrix GeneChip Drosophila 1.0R tiling arrays for six DGRP lines (DGRP_208, DGRP_304, DGRP_313, DGRP_315, DGRP_437, DGRP_555) and the reference strain to validate deletions >25 bp (Supplemental Text S2). Finally, we used 454 sequence (Roche) data from 38 DGRP lines (Mackay et al. 2012) to validate SNP and non-SNP calls (Supplemental Text S2). We used our integrated genotyping algorithm to count supporting and opposing reads of alleles for variants and tested the allele counts from Illumina and 454 for concordance using a Fisher’s exact test.
Inversion karyotypes
We assessed inversion genotypes by cytogenetic analysis of polytene salivary gland chromosomes of third instar larvae by staining with lactic-acetic orcein. We identified inversions by comparison to the standard map of Bridges (1935). We initially examined two larvae from each DGRP line and subsequently confirmed inversion heterozygotes or segregating inversions by examining additional larvae and/or F1 hybrids of the DGRP line with the standard Canton S karyotype.
Wolbachia status
We used PCR to determine the infection status of each line with respect to the endosymbiont, Wolbachia pipientis (Braig et al. 1998; Richardson et al. 2012; Supplemental Text S2). We used DGRP_101 and DGRP_105 as negative controls and DGRP_142 and DGRP_149 as positive controls. We also developed PCR assays to genotype all DGRP lines for insertions of Wolbachia genome at 2R:16,594,660 and 2R:19,117,791 (Supplemental Text S2). We purified PCR products for lines positive for Wolbachia insertions using the Zymo Clean and Concentrator kit (Zymo Research Corporation) and subjected them to Sanger sequencing using the ABI 3730XL platform.
Genome size
We estimated genome sizes for 1016 individual females (at least three individuals per line) using flow cytometry with Drosophila virilis (1C = 328 Mb) as an internal standard, as described in Hare and Johnston (2011) but with a final concentration of propidium iodide stain at 25 mg/mL. The estimate of genome size was the proportion of stain uptake (expressed as a channel number by the flow cytometer) of the sample relative to the standard times the amount of DNA in the standard. We calculated the average genome size and standard deviation of genome size and performed additional replicate measurements as needed to produce a standard error of 0.5%. We tested whether the differences in genome sizes were true by flow cytometry analysis of copreparations of females from lines with different average genome size. We evaluated the association of segregating inversions with variation in genome size using the ANOVA model Y = μ + G + ε, where Y is the standard deviation of genome size within a line and G is the number of segregating inversions (0, 1, 2, 3, or 4) within lines.
Population genomics
We used 357,708 JGIL-filtered, biallelic indels present in at least 101 lines to conduct the indel population genomics analyses. We assigned indels to one of six functional classes (coding sequence, 5′ and 3′ UTR, long [>100 bp] and short [≤100 bp] introns, intergenic sequence) using the 5.49 version annotations of the D. melanogaster reference genome (Marygold et al. 2013). We discarded indels spanning more than one functional class, leaving 357,608 indels with a valid functional class. We analyzed insertions and deletions separately, after first polarizing ancestral and derived states with respect to the high quality second-generation assembly genome of D. simulans (Hu et al. 2013) as an outgroup (Supplemental Text S2). We inferred the derived allele status for 210,268 indels. We manually checked a sample of 500 derived indels to which our polarizing protocol was applied; all were correct. Therefore, we conclude that the specificity of our procedure is very high, although we excluded 41% of the original indel data set from our evolutionary analyses.
We used πindel to describe indel polymorphism, a measure analogous to nucleotide diversity (π), which does not take into account indel size. We used an analogous measure to estimate divergence (k) (Librado and Rozas 2009). We estimated fixed indel divergence for D. melanogaster, D. simulans, and D. yakuba using the multiple alignments D. melanogaster Oct. 2006 from the VISTA Browser (Frazer et al. 2004). We estimated these diversity measures for the whole genome and by chromosome arm (X, 2L, 2R, 3L, 3R, 4) in 100-kb nonoverlapping windows. We also estimated the minor allele frequency (MAF) distribution for indels and the derived allele frequency (DAF) distributions for both deletions and insertions. We used the nonparametric Spearman rank correlation coefficient (ρ) to test for covariation among the diversity estimates. We used the recent high resolution recombination map of D. melanogaster (Comeron et al. 2012) to correlate recombination with the diversity measures.
Functional annotation of variants
We annotated the functional consequences of variants on annotated genes (FlyBase R5.49) (Marygold et al. 2013) using SnpEff (v3.1m) (Cingolani et al. 2012). We considered variants annotated as SPLICE_SITE_ACCEPTOR, SPLICE_SITE_DONOR, START_LOST, FRAME_SHIFT, STOP_GAINED, STOP_LOST to be “potentially damaging” for the affected proteins. We also performed a line-specific annotation integrating all homozygous variants each line carries. For each gene, we translated the variant transcript using the standard genetic code and compared the variant protein to the reference protein using the global alignment “stretcher” utility in EMBOSS (v6.5.7) (Rice et al. 2000). We considered the variant protein to be potentially damaged if the START or STOP codon was lost or the sequence identity with the reference protein was smaller than 90%. We considered a gene to be potentially damaged if all of its splice variants were affected.
Analysis of relatedness and population structure
We calculated the realized genome-wide relationship matrix G among all DGRP lines using biallelic common variants (MAF > 0.05) with a call rate >80%. This computation was performed using the Van Raden (2008) formula implemented in the rrBLUP R package (v4.0) (Endelman 2011). The relationship matrix was normalized by the mean value of the diagonal elements. For analysis of population structure, we performed a principal component analysis (PCA) using EIGENSTRAT (v4.2) (Price et al. 2006). We pruned LD using the LD pruning utility in PLINK (v1.07) (Purcell et al. 2007) such that in a moving window of every 500 variants, the maximum pairwise r2 was smaller than 0.2. We excluded variants within 2 Mb of the major inversions (2L:0.4Mb-14.9Mb, 2R:9Mb-18Mb, 3R:6Mb-27Mb) from this analysis. We tested the significance of the top eigenvalues using the Tracy-Widom statistic implemented in EIGENSTRAT.
Variant-based association mapping
We performed genome-wide association studies in two stages. In the first stage, we adjusted the data for the effects of Wolbachia infection and major inversions [In(2L)t, In(2R)NS, In(3R)P, In(3R)K, and In(3R)Mo] based on mean phenotypic values of each line. We then used the adjusted line means to fit a linear mixed model in the form of y = Xb + Zu + e, where y is the adjusted phenotypic values, X is the design matrix for the fixed SNP effect b, Z is the incidence matrix for the random polygenic effect u, and e is the residual. The vector of polygenic effects u has a covariance matrix in the form of Aσ2, where σ2 is the polygenic variance component. We fitted this linear mixed model using the FastLMM program (v1.09) (Lippert et al. 2011).
Gene-based association mapping
We performed a burden test and a nonburden sequence kernel association test (SKAT) to assess the cumulative effect of all variants within one kilobase of each annotated gene. The weighted burden test weights the contribution of each variant in a gene by the reciprocal of the standard deviation of its estimated minor allele frequency and uses the weighted averages to estimate a score statistic (Madsen and Browning 2009; Han and Pan 2010). The SKAT kernel function builds a relationship matrix detailing relatedness of individuals based upon all variants within a gene. This relationship matrix is fit as the covariance matrix of a random effect in a linear mixed model framework and used to estimate a variance component score to discern the significance of a trait association (Wu et al. 2011). The SKAT kernel function used was linear and did not up-weight the relative contribution of minor alleles.
We performed both the weighted burden test and SKAT using the SKAT package (Wu et al. 2011) in R v3.0.1 (R Development Core Team 2013). For both methods, male and female starvation resistance and genome size were fit with an identity link function and fixed effect covariates for Wolbachia infection status, major inversions, and the 11 principal components explaining the most genetic variation in the DGRP (Tracy-Winom P-value < 0.01). Wolbachia infection status was fit with a logit link function in a likewise manner, excluding the fixed effect of Wolbachia infection status. We performed gene-based tests for all variants, and for common (MAF ≥ 0.05) and rare (MAF < 0.05) variants separately.
Data access
The DGRP lines are available from the Bloomington Drosophila Stock Center (http://flystocks.bio.indiana.edu/Browse/DGRP.php) (see Supplemental Data File S1 for stock numbers). Raw sequence data have been submitted to the NCBI Sequence Read Archive (SRA; http://www.ncbi.nlm.nih.gov/sra) under accession numbers listed in Supplemental Data File S1, and to the Baylor College of Medicine Human Genome Sequencing Center (https://www.hgsc.bcm.edu/arthropods/drosophila-genetic-reference-panel). The genotypes, quality scores, phenotypes, and web-based analysis tools are available from the DGRP website (http://dgrp2.gnets.ncsu.edu).
Acknowledgments
The work was supported by NIH grants NHGRI U54 HG003273 (R.A.G.), GM R01 GM45146 (T.F.C.M., R.R.H.A., E.A.S.), R01 GM076083 (T.F.C.M., R.R.H.A., E.A.S.), R01 AA016560 (T.F.C.M., R.R.H.A.), and R01 GM 59469 (R.R.H.A., T.F.C.M); the Swiss National Science Foundation grant CRSI33_127485 (B.D.); institutional support from the École Polytechnique Fédérale de Lausanne (EPFL) and VITAL-IT for computational analyses (B.D.); the German Research Foundation Emmy Noether Fellowship grant KO 4037/1-1 (J.O.K., T.Z.); NSF grant REU-BIO-1062178 (C.E.H.); National Institute of Justice Grant 2012-DN-BX-K024 (A.M.T.); Spanish Ministerio Ciencia e Innovación grant BFU2009-09504 (A.B.); and startup funds from Texas AgriLife Research and the Texas A&M University College of Agriculture and Life Sciences (A.M.T.). Points of view in this document are those of the authors and do not necessarily represent the official position or policies of the US Department of Justice.
Author contributions: Conceived the project: T.F.C.M., R.A.G., S.R.; Illumina sequencing: S.L., J.J., K.B., C.W., Y.M.Z., Y.Q.Z., M.M., L.L.P., L.P., N.S., S.P., Y.Q.W., Y.H., M.J., F.O., D.K., M.A.C.; variant discovery: A.M., T.Z., D.Z., G.H., J.O.K., D.M., E.A.S., B.D., T.F.C.M.; genotyping: A.M., W.H., E.A.S., B.D., T.F.C.M.; Sanger validation: S.F., L.L., A.P., A.W., R.R., K.C., S.R.; population genomics: A.B., M.R., W.H., A.M., B.D.; inversion karyotypes: Y.I., A.Y.; Wolbachia analysis: L.T., M.M.M., W.H.; genome size analysis: J.S.J., A.M.T., L.L.E., C.E.H.; functional annotation: W.H.; population structure: W.H., E.A.S; starvation resistance data: S.M.R.; GWA analyses: W.H., J.P., M.M.M.; DGRP construction, maintenance, and Bloomington Drosophila Stock Center liaison: R.F.L.; website development and implementation: W.H., J.R.J., M.M.M., E.A.S.;managed project: S.L., D.M.M., R.R.H.A., R.A.G., A.B., J.S.J., E.A.S., B.D., S.R., T.F.C.M.; wrote and prepared manuscript: T.F.C.M., W.H., A.M., J.P., M.R., A.M.T., T.Z., A.B., J.S.J., E.A.S., S.R., B.D.
Footnotes
[Supplemental material is available for this article.]
Article published online before print. Article, supplemental material, and publication date are at http://www.genome.org/cgi/doi/10.1101/gr.171546.113.
Freely available online through the Genome Research Open Access option.
References
- Abyzov A, Urban AE, Snyder M, Gerstein M 2011. CNVnator: an approach to discover, genotype and characterize typical and atypical CNVs from family and population genome sequencing. Genome Res 21: 974–984 [DOI] [PMC free article] [PubMed] [Google Scholar]
- Alkan C, Coe BP, Eichler EE 2011. Genome structural variation discovery and genotyping. Nat Rev Genet 12: 363–376 [DOI] [PMC free article] [PubMed] [Google Scholar]
- Andolfatto P, Depaulis F, Navarro A 2001. Inversion polymorphisms and nucleotide variability in Drosophila. Genet Res 77: 1–8 [DOI] [PubMed] [Google Scholar]
- Assis R, Kondrashov AS 2012. A strong deletion bias in nonallelic gene conversion. PLoS Genet 8: e1002508. [DOI] [PMC free article] [PubMed] [Google Scholar]
- Astle W, Balding DJ 2009. Population structure and cryptic relatedness in genetic association studies. Stat Sci 24: 451–471 [Google Scholar]
- Ayroles JF, Carbone MA, Stone EA, Jordan KW, Lyman RF, Magwire MM, Rollmann SM, Duncan LH, Lawrence F, Anholt RRH, et al. 2009. Systems genetics of complex traits in Drosophila melanogaster. Nat Genet 41: 299–307 [DOI] [PMC free article] [PubMed] [Google Scholar]
- Begun DJ, Aquadro CF 1992. Levels of naturally occurring DNA polymorphism correlate with recombination rates in D. melanogaster. Nature 356: 519–520 [DOI] [PubMed] [Google Scholar]
- Bellen HJ, Levis RW, Liao G, He Y, Carlson JW, Tsang G, Evans-Holm M, Hiesinger PR, Schulze KL, Rubin GM, et al. 2004. The BDGP gene disruption project: single transposon insertions associated with 40% of Drosophila genes. Genetics 167: 761–781 [DOI] [PMC free article] [PubMed] [Google Scholar]
- Bellen HJ, Levis RW, He Y, Carlson JW, Evans-Holm M, Bae E, Kim J, Metaxakis A, Savakis C, Schulze KL, et al. 2011. The Drosophila gene disruption project: progress using transposons with distinctive site specificities. Genetics 188: 731–743 [DOI] [PMC free article] [PubMed] [Google Scholar]
- Braig HR, Zhou W, Dobson SL, O’Neill SL 1998. Cloning and characterization of a gene encoding the major surface protein of the bacterial endosymbiont Wolbachia pipientis. J Bacteriol 180: 2373–2378 [DOI] [PMC free article] [PubMed] [Google Scholar]
- Bridges CB 1935. Salivary chromosome maps with a key to the banding of the chromosomes of Drosophila melanogaster. J Hered 26: 60–64 [Google Scholar]
- Charlesworth B, Morgan MT, Charlesworth D 1993. The effect of deleterious mutations on neutral molecular variation. Genetics 134: 1289–1303 [DOI] [PMC free article] [PubMed] [Google Scholar]
- Cingolani P, Platts A, Wang L, Coon M, Nguyen T, Wang L, Land SJ, Lu X, Ruden DM 2012. A program for annotating and predicting the effects of single nucleotide polymorphisms, SnpEff: SNPs in the genome of Drosophila melanogaster strain w1118; iso-2; iso-3. Fly (Austin) 6: 80–92 [DOI] [PMC free article] [PubMed] [Google Scholar]
- Comeron JM, Ratnappan R, Bailin S 2012. The many landscapes of recombination in Drosophila melanogaster. PLoS Genet 8: e1002905. [DOI] [PMC free article] [PubMed] [Google Scholar]
- Corbett-Detig RB, Hartl DL 2012. Population genomics of inversion polymorphisms in Drosophila melanogaster. PLoS Genet 8: e1003056. [DOI] [PMC free article] [PubMed] [Google Scholar]
- DePristo MA, Banks E, Poplin R, Garimella KV, Maguire JR, Hartl C, Philippakis AA, del Angel G, Rivas MA, Hanna M, et al. 2011. A framework for variation discovery and genotyping using next-generation DNA sequencing data. Nat Genet 43: 491–498 [DOI] [PMC free article] [PubMed] [Google Scholar]
- Dobzhansky T. 1937. Genetics and the origin of species. Columbia University Press, New York. [Google Scholar]
- Drosophila 12 Genomes Consortium. 2007. Evolution of genes and genomes on the Drosophila phylogeny. Nature 450: 203–218 [DOI] [PubMed] [Google Scholar]
- Dunning Hotopp JC, Clark ME, Oliveira DC, Foster JM, Fischer P, Muñoz Torres MC, Giebel JD, Kumar N, Ishmael N, Wang S, et al. 2007. Widespread lateral gene transfer from intracellular bacteria to multicellular eukaryotes. Science 317: 1753–1756 [DOI] [PubMed] [Google Scholar]
- Endelman JB 2011. Ridge regression and other kernels for genomic selection with R package rrBLUP. The Plant Genome 4: 250–255 [Google Scholar]
- Ellis LL, Huang W, Quinn AM, Ahuja A, Alfrejd B, Gomez FE, Hjelmen CE, Moore CL, Mackay TFC, Johnston JS, et al. 2014. Intrapopulation genome size variation in D. melanogaster reflects life history variation and plasticity. PLoS Genet (in press) [DOI] [PMC free article] [PubMed] [Google Scholar]
- Falconer DS, Mackay TFC 1996. Introduction to quantitative genetics, 4th ed. Addison Wesley Longman, Harlow, United Kingdom [Google Scholar]
- Filion GJ, van Bemmel JG, Braunschweig U, Talhout W, Kind J, Ward LD, Brugman W, de Castro IJ, Kerkhoven RM, Bussemaker HJ, et al. 2010. Systematic protein location mapping reveals five principal chromatin types in Drosophila cells. Cell 143: 212–224 [DOI] [PMC free article] [PubMed] [Google Scholar]
- Flint J, Mackay TFC 2009. Genetic architecture of quantitative traits in mice, flies and humans. Genome Res 19: 723–733 [DOI] [PMC free article] [PubMed] [Google Scholar]
- Frazer KA, Pachter L, Poliakov A, Rubin EM, Dubchak I 2004. VISTA: computational tools for comparative genomics. Nucleic Acids Res 32: W273–W279 [DOI] [PMC free article] [PubMed] [Google Scholar]
- Gan X, Stegle O, Behr J, Steffen JG, Drewe P, Hildebrand KL, Lyngsoe R, Schultheiss SJ, Osborne EJ, Sreedharan VT, et al. 2010. Multiple reference genomes and transcriptomes for Arabidopsis thaliana. Nature 477: 419–423 [DOI] [PMC free article] [PubMed] [Google Scholar]
- Han F, Pan W 2010. A data-adaptive sum test for disease association with multiple common or rare variants. Hum Hered 70: 42–54 [DOI] [PMC free article] [PubMed] [Google Scholar]
- Handsaker RE, Korn JM, Nemesh J, McCarroll SA 2011. Discovery and genotyping of genome structural polymorphism by sequencing on a population scale. Nat Genet 43: 269–276 [DOI] [PMC free article] [PubMed] [Google Scholar]
- Harbison ST, McCoy LJ, Mackay TFC 2013. Genome-wide association study of sleep in Drosophila melanogaster. BMC Genomics 14: 281. [DOI] [PMC free article] [PubMed] [Google Scholar]
- Hare EE, Johnston JS 2011. Genome size determination using flow cytometry of propidium iodide-stained nuclei. Methods Mol Biol 772: 3–12 [DOI] [PubMed] [Google Scholar]
- Hill WG, Robertson A 1966. The effect of linkage on limits to artificial selection. Genet Res 8: 269–294 [PubMed] [Google Scholar]
- Hodgkinson A, Eyre-Walker A 2011. Variation in the mutation rate across mammalian genomes. Nat Rev Genet 12: 756–766 [DOI] [PubMed] [Google Scholar]
- Hoffmann AA, Rieseberg LH 2008. Revisiting the impact of inversions in evolution: from population genetic markers to drivers of adaptive shifts and speciation? Annu Rev Ecol Evol Syst 39: 21–42 [DOI] [PMC free article] [PubMed] [Google Scholar]
- Hoffmann A, Turelli M, Simmons GM 1986. Unidirectional incompatibility between populations of Drosophila simulans. Evolution 40: 692–701 [DOI] [PubMed] [Google Scholar]
- Hu TT, Eisen MB, Thornton KR, Andolfatto P 2013. A second generation assembly of the Drosophila simulans genome provides new insights into patterns of lineage-specific divergence. Genome Res 23: 89–98 [DOI] [PMC free article] [PubMed] [Google Scholar]
- Huang W, Richards S, Carbone MA, Zhu D, Anholt RRH, Ayroles JF, Duncan L, Jordan KW, Lawrence F, Magwire MM, et al. 2012. Epistasis dominates the genetic architecture of Drosophila quantitative traits. Proc Natl Acad Sci 109: 15553–15559 [DOI] [PMC free article] [PubMed] [Google Scholar]
- Jordan KW, Craver KL, Magwire MM, Cubilla CE, Mackay TFC, Anholt RRH 2012. Genome wide association for sensitivity to chronic oxidative stress in Drosophila melanogaster. PLoS ONE 7: e38722. [DOI] [PMC free article] [PubMed] [Google Scholar]
- Jovelin R, Cutter AD 2013. Fine-scale signatures of molecular evolution reconcile models of indel-associated mutation. Genome Biol Evol 5: 978–986 [DOI] [PMC free article] [PubMed] [Google Scholar]
- Kidwell MG 1993. Lateral transfer in natural populations of eukaryotes. Annu Rev Genet 27: 236–256 [DOI] [PubMed] [Google Scholar]
- Kirkpatrick M, Barton N 2006. Chromosome inversions, local adaptation and speciation. Genetics 173: 419–434 [DOI] [PMC free article] [PubMed] [Google Scholar]
- Lee S, Emond MJ, Bamshad MJ, Barnes KC, Rieder MJ, Nickerson DA, Christiani DC, Wurfel MM, Lin X 2012. Optimal unified approach for rare-variant association testing with application to small-sample case-control whole-exome sequencing studies. Am J Hum Genet 91: 224–237 [DOI] [PMC free article] [PubMed] [Google Scholar]
- Leushkin EV, Sutormin RA, Nabieva ER, Penin AA, Kondrashov AS, Logacheva MD 2013. Strong mutational bias toward deletions in the Drosophila melanogaster genome is compensated by selection. BMC Genomics 14: 476. [DOI] [PMC free article] [PubMed] [Google Scholar]
- Li H, Durbin R 2010. Fast and accurate long-read alignment with Burrows-Wheeler transform. Bioinformatics 26: 589–595 [DOI] [PMC free article] [PubMed] [Google Scholar]
- Librado P, Rozas J 2009. DnaSP v5: a software for comprehensive analysis of DNA polymorphism data. Bioinformatics 25: 1451–1452 [DOI] [PubMed] [Google Scholar]
- Lippert C, Listgarten J, Liu Y, Kadie CM, Davidson RI, Heckerman D 2011. FaST linear mixed models for genome-wide association studies. Nat Methods 8: 833–835 [DOI] [PubMed] [Google Scholar]
- Long Q, Rabanal FA, Meng D, Huber CD, Farlow A, Platzer A, Zhang Q, Vilhjálmsson BJ, Korte A, Nizhynska V, et al. 2013. Massive genomic variation and strong selection in Arabidopsis thaliana lines from Sweden. Nat Genet 45: 884–890 [DOI] [PMC free article] [PubMed] [Google Scholar]
- Mackay TFC 2014. Epistasis and quantitative traits: using model organisms to study gene-gene interactions. Nat Rev Genet 15: 22–33 [DOI] [PMC free article] [PubMed] [Google Scholar]
- Mackay TFC, Stone EA, Ayroles JF 2009. The genetics of quantitative traits: challenges and prospects. Nat Rev Genet 10: 565–577 [DOI] [PubMed] [Google Scholar]
- Mackay TFC, Richards S, Stone EA, Barbadilla A, Ayroles JF, Zhu D, Casillas S, Han Y, Magwire MM, Cridland JM, et al. 2012. The Drosophila melanogaster Genetic Reference Panel. Nature 482: 173–178 [DOI] [PMC free article] [PubMed] [Google Scholar]
- Madsen BO, Browning SR 2009. A groupwise association test for rare mutations using a weighted sum statistic. PLoS Genet 5: e1000384. [DOI] [PMC free article] [PubMed] [Google Scholar]
- Marygold SJ, Leyland PC, Seal RL, Goodman JL, Thurmond JR, Strelets VB, Wilson RJ, the FlyBase consortium. 2013. FlyBase: improvements to the bibliography. Nucleic Acids Res 41: D751–D757 [DOI] [PMC free article] [PubMed] [Google Scholar]
- Massouras A, Hens K, Gubelmann C, Uplekar S, Decouttere F, Rougemont J, Cole ST, Deplancke B 2010. Primer-initiated sequence synthesis to detect and assemble structural variants. Nat Methods 7: 485–486 [DOI] [PubMed] [Google Scholar]
- Massouras A, Waszak SM, Albarca-Aguilera M, Hens K, Holcombe W, Ayroles JF, Dermitzakis ET, Stone EA, Jensen JD, Mackay TFC, et al. 2012. Genomic variation and its impact on gene expression in Drosophila melanogaster. PLoS Genet 8: e1003055. [DOI] [PMC free article] [PubMed] [Google Scholar]
- McDonald MJ, Wang W-C, Huang H-D, Leu J-Y 2011. Clusters of nucleotide substitutions and insertion/deletion mutations are associated with repeat sequences. PLoS Biol 9: e1000622. [DOI] [PMC free article] [PubMed] [Google Scholar]
- McKenna A, Hanna M, Banks E, Sivachenko A, Cibulskis K, Kernytsky A, Garimella K, Altshuler D, Gabriel S, Daly M, et al. 2010. The Genome Analysis Toolkit: a MapReduce framework for analyzing next-generation DNA sequencing data. Genome Res 20: 1297–1303 [DOI] [PMC free article] [PubMed] [Google Scholar]
- McQuilton P, St Pierre S, Thurmond J, FlyBase Consortium. 2012. FlyBase 101–the basics of navigating FlyBase. Nucleic Acids Res 40: D706–D714 [DOI] [PMC free article] [PubMed] [Google Scholar]
- Medvedev P, Fiume M, Dzamba M, Smith T, Brudno M 2010. Detecting copy number variation with mated short reads. Genome Res 20: 1613–1622 [DOI] [PMC free article] [PubMed] [Google Scholar]
- Mettler LE, Voelker RA, Mukai T 1977. Inversion clines in populations of Drosophila melanogaster. Genetics 87: 169–176 [DOI] [PMC free article] [PubMed] [Google Scholar]
- Mills RE, Walter K, Stewart C, Handsaker RE, Chen K, Alkan C, Abyzov A, Yoon SC, Ye K, Cheetham RK, et al. 2011. Mapping copy number variation by population-scale genome sequencing. Nature 470: 59–65 [DOI] [PMC free article] [PubMed] [Google Scholar]
- The modENCODE Consortium, Roy S, Ernst J, Kharchenko PV, Kheradpour P, Negre N, Eaton ML, Landolin JM, Bristow CA, Ma L, et al. 2010. Identification of functional elements and regulatory circuits by Drosophila modENCODE. Science 330: 1787–1797 [DOI] [PMC free article] [PubMed] [Google Scholar]
- Montgomery SB, Goode DL, Kvikstad E, Albers CA, Zhang ZD, Mu XJ, Ananda G, Howie B, Karczewski KJ, Smith KS, et al. 2013. The origin, evolution and functional impact of short insertion-deletion variants identified in 179 human genomes. Genome Res 23: 749–761 [DOI] [PMC free article] [PubMed] [Google Scholar]
- Navarro A, Betran E, Barbadilla A, Ruiz A 1997. Recombination and gene flux caused by gene conversion and crossing over in inversion heterokaryotypes. Genetics 146: 695–709 [DOI] [PMC free article] [PubMed] [Google Scholar]
- Navarro A, Barbadilla A, Ruiz A 2000. Effect of inversion polymorphism on the neutral nucleotide variability of linked chromosomal regions in Drosophila. Genetics 155: 685–698 [DOI] [PMC free article] [PubMed] [Google Scholar]
- Nei M. 1987. Molecular evolutionary genetics. Columbia University Press, New York. [Google Scholar]
- Ober U, Ayroles JF, Stone EA, Richards S, Zhu D, Stricker C, Gianola D, Schlather M, Mackay TFC, Simianer H 2012. Using whole-genome sequence data to predict quantitative trait phenotypes in Drosophila melanogaster. PLoS Genet 8: e1002685. [DOI] [PMC free article] [PubMed] [Google Scholar]
- Ometto L, Stephan W, De Lorenzo D 2005. Insertion/deletion and nucleotide polymorphism data reveal constraints in Drosophila melanogaster introns and intergenic regions. Genetics 169: 1521–1527 [DOI] [PMC free article] [PubMed] [Google Scholar]
- Onishi-Seebacher M, Korbel JO 2011. Challenges in studying genomic structural variant formation mechanisms: the short-read dilemma and beyond. Bioessays 33: 840–850 [DOI] [PubMed] [Google Scholar]
- Petrov DA 2002. Mutational equilibrium model of genome size evolution. Theor Popul Biol 61: 533–546 [DOI] [PubMed] [Google Scholar]
- Price AL, Patterson NJ, Plenge RM, Weinblatt ME, Shadick NA, Reich D 2006. Principal components analysis corrects for stratification in genome-wide association studies. Nat Genet 38: 904–909 [DOI] [PubMed] [Google Scholar]
- Purcell S, Neale B, Todd-Brown K, Thomas L, Ferreira MA, Bender D, Maller J, Sklar P, de Bakker PI, Daly MJ, et al. 2007. PLINK: a tool set for whole-genome association and population-based linkage analyses. Am J Hum Genet 81: 559–575 [DOI] [PMC free article] [PubMed] [Google Scholar]
- R Development Core Team. 2013. R: a language and environment for statistical computing. R Foundation for Statistical Computing, Vienna, Austria. http://www.R-project.org
- Rausch T, Zichner T, Schlattl A, Stütz AM, Benes V, Korbel JO 2012. DELLY: structural variant discovery by integrated paired-end and split-read analysis. Bioinformatics 28: i333–i339 [DOI] [PMC free article] [PubMed] [Google Scholar]
- Rice P, Longden I, Bleasby A 2000. EMBOSS: the European Molecular Biology Open Software Suite. Trends Genet 16: 276–277 [DOI] [PubMed] [Google Scholar]
- Richardson MF, Weinert LA, Welch JJ, Linheiro RS, Magwire MM, Jiggins FM, Bergman CM 2012. Population genomics of the Wolbachia endosymbiont in Drosophila melanogaster. PLoS Genet 8: e1003129. [DOI] [PMC free article] [PubMed] [Google Scholar]
- She X, Jiang Z, Clark RA, Liu G, Cheng Z, Tuzun E, Church DM, Sutton G, Halpern AL, Eichler EE 2004. Shotgun sequence assembly and recent segmental duplications within the human genome. Nature 431: 927–930 [DOI] [PubMed] [Google Scholar]
- Shen Y, Wan Z, Coarfa C, Drabek R, Chen L, Ostrowski EA, Liu Y, Weinstock GM, Wheeler DA, Gibbs RA, et al. 2010. A SNP discovery method to assess variant allele probability from next-generation resequencing data. Genome Res 20: 273–280 [DOI] [PMC free article] [PubMed] [Google Scholar]
- Stalker HD 1976. Chromosome studies in wild populations of Drosophila melanogaster. Genetics 82: 323–347 [DOI] [PMC free article] [PubMed] [Google Scholar]
- Stone EA 2012. Joint genotyping on the fly: identifying variation among a sequenced panel of inbred lines. Genome Res 22: 966–974 [DOI] [PMC free article] [PubMed] [Google Scholar]
- Swarup S, Huang W, Mackay TFC, Anholt RRH 2013. Analysis of natural variation reveals neurogenetic networks for Drosophila olfactory behavior. Proc Natl Acad Sci 110: 1017–1022 [DOI] [PMC free article] [PubMed] [Google Scholar]
- Teixeira L, Ferreira A, Ashburner M 2008. The bacterial symbiont Wolbachia induces resistance to RNA viral infections in Drosophila melanogaster. PLoS Biol 6: e2. [DOI] [PMC free article] [PubMed] [Google Scholar]
- Tian D, Wang Q, Zhang P, Araki H, Yang S, Kreitman M, Nagylaki T, Hudson R, Bergelson J, Chen J-Q 2008. Single-nucleotide mutation rate increases close to insertions/deletions in eukaryotes. Nature 455: 105–108 [DOI] [PubMed] [Google Scholar]
- Turelli M 1984. Heritable genetic variation via mutation-selection balance: Lerch’s ζ meets the abdominal bristle. Theor Popul Biol 25: 138–193 [DOI] [PubMed] [Google Scholar]
- Van Raden PM 2008. Efficient methods to compute genomic predictions. J Dairy Sci 91: 4414–4423 [DOI] [PubMed] [Google Scholar]
- van Steensel B 2011. Chromatin: constructing the big picture. EMBO J 30: 1885–1895 [DOI] [PMC free article] [PubMed] [Google Scholar]
- Waszak SM, Hasin Y, Zichner T, Olender T, Keydar I, Khen M, Stütz AM, Schlattl A, Lancet D, Korbel JO 2010. Systematic inference of copy-number genotypes from personal genome sequencing data reveals extensive olfactory receptor gene content diversity. PLoS Comput Biol 6: e1000988. [DOI] [PMC free article] [PubMed] [Google Scholar]
- Weber AL, Khan GF, Magwire MM, Tabor CL, Mackay TFC, Anholt RRH 2012. Genome-wide association for oxidative stress resistance in Drosophila melanogaster. PLoS ONE 7: e34745. [DOI] [PMC free article] [PubMed] [Google Scholar]
- Wu MC, Kraft P, Epstein MP, Taylor DM, Chanock SJ, Hunter DJ, Lin X 2010. Powerful SNP-set analysis for case-control genome-wide association studies. Am J Hum Genet 86: 929–942 [DOI] [PMC free article] [PubMed] [Google Scholar]
- Wu MC, Lee S, Cai T, Li Y, Boehnke M, Lin X 2011. Rare-variant association testing for sequencing data with the sequence kernel association test. Am J Hum Genet 89: 82–93 [DOI] [PMC free article] [PubMed] [Google Scholar]
- Yamamoto A, Anholt RRH, Mackay TFC 2009. Epistatic interactions attenuate mutations affecting startle behaviour in Drosophila melanogaster. Genet Res 91: 373–382 [DOI] [PubMed] [Google Scholar]
- Yang W, Woodgate R 2007. What a difference a decade makes: insights into translesion DNA synthesis. Proc Natl Acad Sci 104: 15591–15598 [DOI] [PMC free article] [PubMed] [Google Scholar]
- Ye K, Schulz MH, Long Q, Apweiler R, Ning Z 2009. Pindel: a pattern growth approach to detect break points of large deletions and medium sized insertions from paired-end short reads. Bioinformatics 25: 2865–2871 [DOI] [PMC free article] [PubMed] [Google Scholar]
- Zichner T, Garfield DA, Rausch T, Stütz AM, Cannavó E, Braun M, Furlong EE, Korbel JO 2013. Impact of genomic structural variation in Drosophila melanogaster based on population-scale sequencing. Genome Res 23: 568–579 [DOI] [PMC free article] [PubMed] [Google Scholar]