

Abstract
How endurance training alters muscle lipid metabolism while preserving insulin sensitivity remains unclear. Because acute free fatty acid (FFA) elevation by lipid infusion reduces insulin sensitivity, we hypothesized that training status would alter accumulation of muscle triacylglycerol (TAG), diacylglycerol (DAG), ceramide, and acylcarnitine during acute FFA elevation. Trained (n = 15) and sedentary (n = 13) participants matched for age, sex, and BMI received either a 6-h infusion of lipid (20% Intralipid at 90 ml/h) or glycerol (2.25 g/100 ml at 90 ml/h) during a hyperinsulinemic euglycemic clamp. Muscle biopsies were taken at 0, 120, and 360 min after infusion initiation to measure intramyocellular concentrations of TAG, DAG, ceramides, and acylcarnitines by liquid chromatography-tandem mass spectrometry. Trained participants had a higher V̇o2 max and insulin sensitivity than sedentary participants. The lipid infusion produced a comparable elevation of FFA (594 ± 90 μmol/l in trained, 721 ± 30 μmol/l in sedentary, P = 0.4) and a decline in insulin sensitivity (−44.7% trained vs. −47.2% sedentary, P = 0.89). In both groups, lipid infusion increased the linoleic and linolenic acid content of TAG without changing total TAG. In the sedentary group, lipid infusion increased total, oleic, and linoleic acid and linolenic acid content of DAG. Regardless of training status, lipid infusion did not alter total ceramide, saturated ceramide, palmitoyl-carnitine, or oleoyl-carnitine. We conclude that during acute FFA elevation, trained adults have a similar decline in insulin sensitivity with less accumulation of muscle DAG than sedentary adults, suggesting that lipid-induced insulin resistance can occur without elevation of total muscle DAG.
Keywords: training, intramyocellular lipid, diacylglycerol, insulin sensitivity, free fatty acids
insulin resistance is a critical contributor to type 2 diabetes mellitus (T2DM), a disease that adversely affects millions of Americans. Insulin resistance has a well-established association with the metabolic syndrome (15) and predates T2DM (32). Because skeletal muscle is the largest site of insulin resistance (16, 43), there is intense interest in understanding the mechanism of insulin resistance in these tissues.
In sedentary humans, muscle insulin resistance has been attributed to lipotoxicity, which is defined as the elevation of lipids and/or lipid metabolites within blood or tissues with subsequent metabolic derangement. Several lines of evidence support this theory. Despite hyperinsulinemia, free fatty acid (FFA) levels are roughly two times higher in humans with obesity (2), insulin resistance (2), or T2DM (39) than in healthy humans. FFA elevation, in turn, increases intramyocellular lipid (IMCL) levels (10), a measurement that in sedentary humans is inversely associated with insulin sensitivity (30, 35). Although FFA elevation was initially thought to increase muscle insulin resistance by increasing IMCL (10), subsequent work has suggested that lipid metabolites such as diacylglycerol (DAG) (26, 46), ceramides (33), and long-chain acyl-CoAs (31) play more direct, causative roles.
The mechanism by which training alters muscle lipid metabolism while preserving muscle insulin sensitivity remains unclear. Aerobic exercise improves insulin sensitivity (18, 41) and reduces T2DM incidence (24). Yet, an intriguing “athlete's paradox” has been documented, whereby endurance-trained humans exhibit normal insulin sensitivity despite having IMCL content similar to those seen in T2DM (22). Research addressing this paradox (6, 12, 18) has suggested that training alters not only IMCL levels but also lipid metabolite levels, composition, and localization. This could indicate a more nuanced mechanism by which muscle lipid metabolism can alter insulin sensitivity, which may be modified by endurance training.
The goals of our study were to determine the effect of endurance training, compared with a sedentary control condition, on lipid and lipid metabolite accumulation during acute, moderate FFA elevation. The use of a lipid infusion to acutely elevate FFA in humans is an established model for lipid-induced insulin resistance (3, 8, 9). Although early studies used a lipid plus heparin infusion to elevate FFA to high physiological levels (8, 9), more recent studies (3, 13), including our own (13), used non-heparin infusion protocols to elevate FFA within the physiological range. This moderate FFA elevation reduces insulin sensitivity (3, 13) with a concomitant disruption of muscle insulin signaling (3). However, whether endurance training modifies the muscle response to lipid infusion remains uncertain, as mixed results of training on lipid infusion-induced insulin resistance have been reported (13, 37).
This study expands upon our previous work (13) to examine whether training may modify lipid and lipid metabolite accumulation during acute, moderate FFA elevation. The analyses reported here test the hypothesis that moderate FFA elevation from lipid infusion will increase muscle levels of triacylglycerol (TAG), DAG, and ceramide levels and that the observed changes in lipid and lipid metabolite levels will be similar in trained and sedentary participants.
MATERIALS AND METHODS
Research design and methods.
The recruitment and protocol for this study have been published previously (13). A portion of the data in Table 1 has been used in a previous publication (13). The previous study reported on 28 participants (14 trained and 14 sedentary). The current study included 26 participants (13 trained and 13 sedentary) from the previous analysis. Because of the availability of the muscle lipid for analysis, one sedentary and one trained participant from the previous analysis were removed, and two trained participants, not reported previously, were added. The reported values in Table 1 for sex, age, body mass index (BMI), percent body fat, fasting glucose, FFA, triglycerides, insulin, V̇o2 max, baseline glucose infusion rate, decline in glucose infusion rate after 6 h of lipid infusion, and change in FFA during lipid/glycerol infusion include data from the previous analysis (13 trained and 13 sedentary) and the new participants (2 trained) not published previously. The main analysis of this study, baseline muscle lipid content and the subsequent response to lipid or glycerol infusion, has not been reported previously. This study was approved by the University of Minnesota Institutional Review Board. This study is registered with www.clinicaltrials.gov (NCT00786487).
Table 1.
Baseline characteristics of trained and sedentary participants
| Characteristics | Trained (n = 15) | Sedentary (n = 13) | P Value |
|---|---|---|---|
| Sex (males/females) | 8/7 | 7/6 | 0.98 |
| Age, yr | 24.1 ± 1.0 | 21.7 ± 0.6 | 0.06 |
| Body mass index, kg/m2 | 22.4 ± 0.5 | 21.5 ± 0.6 | 0.29 |
| FFM, kg | 52.7 ± 3.2 | 43.2 ± 1.9 | 0.02 |
| Body fat, % | 18.4 ± 1.7 | 26 ± 2.6 | 0.02 |
| Fasting glucose, mmol/l | 4.5 ± 0.2 | 4.5 ± 0.1 | 0.98 |
| Free fatty acids, μM/l | 337 ± 73 | 437 ± 67 | 0.33 |
| Triglycerides, mmol/l | 0.94 ± 0.1 | 0.77 ± 0.1 | 0.1 |
| Insulin, pmol/l | 15.6 ± 4.4 | 28.2 ± 5.7 | 0.1 |
| V̇o2max, ml·kg−1·min−1 | 48.7 ± 1.7 | 39.0 ± 1.4 | <0.01 |
| Muscle TAG, μg/mg tissue | 4.0 ± 0.5 | 3.9 ± 0.5 | 0.86 |
| Muscle DAG, μg/mg tissue | 0.14 ± 0.05 | 0.21 ± 0.05 | 0.11 |
| Muscle saturated DAG, μg/mg tissue | 0.09 ± 0.01 | 0.13 ± 0.03 | 0.1 |
| Muscle ceramide, ng/mg tissue | 42.6 ± 4.6 | 30.3 ± 2.7 | 0.03 |
| Muscle saturated ceramide, ng/mg/tissue | 38.5 ± 4.4 | 27.7 ± 2.5 | 0.05 |
| Baseline GIR, μmol glucose infused·kg FFM−1·min−1 | 68 ± 4 | 49 ± 4 | <0.01 |
| Decline in GIR after 6-h lipid Infusion | −44.70% | −47.20% | 0.89 |
Results are reported as means ± SE for continuous variables. FFM, fat-free mass; TAG, triacylglycerol; DAG, diacylglycerol; GIR, glucose infusion rate. Signifcant values are in boldface.
Protocol.
Briefly, healthy, lean trained (n = 16) and sedentary (n = 14) individuals were recruited and gave written informed consent. Participants were matched for sex, age (±5 yr), and BMI (±1.5 kg/m2). Training was self-reported using the short form International Physical Activity Questionnaire, a validated physical activity questionnaire (14). Individuals who participated in 30 min or less of active exercise weekly were classified as sedentary. Individuals who participated in a regular running program (≥45 min/day, ≥5 days/wk), preferably with recent marathon experience, were classified as trained.
The protocol was approved by the University of Minnesota Institutional Review Board. Participants underwent three visits at the Masonic Clinical Research Unit (MCRU). Prior to each visit, participants abstained from active exercise (≥48 h) and food intake (8 h). Visit 1 was a screening visit, including fasting blood draw, height, weight, EKG and treadmill V̇o2 max (Medgraphics CPX-D metabolic cart). Visit 2 took place for ≥1 wk and ≤1 mo after visit 1. Body composition was measured by dual-energy X-ray absorptometry (Lunar Prodigy), followed by a 3-h hyperinsulinemic euglycemic clamp (1.5 mU·kg fat-free mass−1·min−1) to measure insulin sensitivity. Visit 3 took place within 1 mo of the second visit. For women, all studies were performed during the follicular phase of their menstrual cycle.
Participants arrived at the MCRU on the evening of the third visit, consumed a standard dinner (27% protein, 32% fat, and 41% carbohydrate), remained on bed rest with bathroom privileges, and consumed no other food until study completion. At 8 AM the next day, participants underwent a muscle biopsy on the right vastus lateralis under local anesthesia (34). After the first biopsy (Bx1) was obtained (0 min), a 6-h infusion of lipid (20% Intralipid at 90 ml/h) or glycerol (2.25 g/100 ml at 90 ml/h) was started. Infusion of Intralipid, comprised predominantly of polyunsaturated fatty acids [linoleic (44–62%), oleic (19–30%), palmitic (7–14%), linolenic (4–11%) and stearic (1.4–5.5%)] (19), is an established model for producing lipid-induced insulin resistance (9). To limit the effect of the lipid infusion to FFA elevation, the control infusion was a glycerol infusion matched to the glycerol content of the lipid infusion. Participants were assigned to either a lipid or glycerol infusion to maintain matching between activity groups. In addition, a hyperinsulinemic euglycemic clamp was started (1.5 mU·kg fat-free mass−1·min−1 insulin, KPO4 at 50 ml/h, dextrose 20% titrated to keep glucose at 4.7–5.3 mmol/l) and continued for 6 h. After the lipid/glycerol infusion was initiated, the second biopsy (Bx2; 120 min) was obtained from the right vastus lateralis 6 in. proximal to the first biopsy site, and the third biopsy (Bx3; 360 min) was obtained from the left vastus lateralis. For each muscle biopsy (∼200 mg), the tissue was trimmed of excess fat at the bedside, immediately frozen in isopentane cooled by liquid nitrogen, and stored at −80°C.
Muscle lipid analysis.
The frozen muscle was processed as described previously (23). Briefly, the extramyocellular fat was removed and the resultant muscle pulverized to a fine powder using a stainless-steel mortar and pestle on dry ice. The powder was extracted for total lipids (21). The extract was divided into three aliquots for specific isolating procedures, as described below.
Muscle TAG and DAG were determined by liquid chromatography mass spectrometry (LC-MS) after undergoing the Supelco SPE procedure for fractionating lipids (Supelclean LC-NH2 solid-phase extraction-SPE tube; Sigma-Aldrich, St. Louis, MO). The fractions were hydrolyzed together with the respective standard curves into FFAs prior to LC-MS analysis (36). Total TAG and total DAG were considered the sum of the following components in each fraction: myristic acid (14:0), palmitic acid (16:0), palmitoleic acid (16:1), stearic acid (18:0), oleic acid (18:1), linoleic acid (18:2), linolenic acid (18:3), arachidonic acid (20:4), and elaidic acid (trans 18:1). Saturated DAG was considered the sum of the following components: myristic acid (14:0), palmitic acid (16:0), and stearic acid (18:0).
Ceramides (7) were quantified by ultraperformance liquid chromatography/tandem mass spectrometry (UPLC/MS-MS), as described previously. Total ceramide was considered the sum of the following: myristic acid (14:0), palmitic acid (16:0), stearic acid (18:0), oleic acid (18:1), arachidic acid (20:0), lignoceric acid (24:0), and nervonic acid (24:1). Saturated ceramide was considered the sum of myristic acid (14:0), palmitic acid (16:0), stearic acid (18:0), arachidic acid (20:0), and lignoceric acid (24:0).
Intramyocellular palmitoyl-carnitine and oleoyl-carnitine concentrations were measured by LC-MS/MS (27).
Statistical analysis.
Baseline data are reported as means ± SE. Significant differences at baseline between groups were determined using two-tailed t-tests for continuous variables and the Chi-square test for categorical variables. Multiple group comparisons of muscle lipid levels were performed: 1) trained lipid vs. trained glycerol, 2) sedentary lipid vs. sedentary glycerol, 3) trained lipid vs. sedentary lipid, and 4) trained glycerol vs. sedentary glycerol. Linear mixed-effects models (PROC MIXED), with random intercepts to account for repeated measurements within subjects, were used to examine these group differences as well as differences over the infusion (across biopsies). Muscle lipid levels are reported as least square means ± SE. Pairwise differences between biopsies were performed using post hoc tests. Statistical significance was set to 0.05. All analyses were conducted with SAS (version 9.2; SAS Institute, Cary, NC).
RESULTS
Baseline characteristics.
Fifteen trained (8 males and 7 females) and 13 sedentary (7 males and 6 females) subjects had complete data for analysis. Their clinical characteristics are shown in Table 1. The participants were matched on age and BMI. The trained participants had higher fat-free mass, lower body fat, higher V̇o2 max, and higher insulin sensitivity, as measured by the hyperinsulinemic euglycemic clamp. Similar to our previous analysis with expansion to include additional participants (13), both the trained and sedentary participants had similar (P = 0.89) significant (−44.7 to −47.2%) reductions in insulin sensitivity with lipid infusion relative to their respective glycerol control group (P < 0.01).
Baseline muscle total TAG, total DAG, and saturated DAG were not different between the trained and sedentary groups. Individual fatty acid species in DAG (myristic acid, palmitic acid, palmitoleic acid, stearic acid, oleic acid, linoleic acid, linolenic acid, and arachidonic acid) were also not different between trained and sedentary groups (data not shown).
Muscle total ceramides (P = 0.03) and saturated ceramides (P = 0.05) were greater in the trained participants than in the sedentary participants.
Baseline insulin sensitivity, as determined at visit 2, did not correlate significantly with any of the initial (Bx1) levels of muscle lipids, including total muscle TAG, individual fatty acid components of TAG, total DAG, saturated DAG, or individual fatty acid components of DAG, total ceramide, or total saturated ceramide (data not shown).
FFA levels during the lipid or glycerol infusion.
During the hyperinsulinemic euglycemic clamp, lipid infusion produced comparable FFA elevation (594 ± 90 μmol/l in trained and 721 ± 30 μmol/l in sedentary, P = 0.4). During the hyperinsulinemic euglycemic clamp, glycerol infusion was associated with comparable FFA suppression between both activity groups (P = 0.4), which was likely due to the hyperinsulinemia.
Muscle TAG levels.
Figure 1 depicts muscle TAG by time of biopsy and study group. Neither lipid nor glycerol infusion changed muscle TAG concentrations significantly for either trained or sedentary (Bx1 vs. each of Bx2 and Bx3, Fig. 1; actual values reported in Supplemental Table S1; Supplemental Material for this article can be found online at the AJP-Endocrinology and Metabolism website). However, lipid infusion significantly increased linoleic acid content (+63 to 70%, P < 0.05, for each of Bx2 and Bx3 compared with Bx1 within fitness category and infusion status) and linolenic acid content of TAG (+70 to 88%, P < 0.05, for each of Bx2 and Bx3 compared with Bx1 within fitness category and infusion status) but not oleic acid. In response to the lipid infusion, the sedentary group increased linoleic and linolenic acid content faster (by Bx2) than the trained group (by Bx3). The increase in linoleic (P = 0.88) and linolenic acid (P = 0.2) by the end of lipid infusion was similar between the trained and sedentary groups. Glycerol infusion did not alter linoleic, linolenic, or oleic acid levels.
Fig. 1.

A 6-h Intralipid infusion alters intramyocellular triacylglycerol (TAG) composition. Total TAG is the sum of myristic (14:0), palmitic (16:0), palmitoleic (16:1), stearic (18:0), oleic (18:1), linoleic (18:2), linolenic (18:3), arachidonic (20:4), and elaidic acids (trans 18:1). Biopsies (Bx) were performed at baseline (Bx1), after 120 min (Bx2), and after 360 min (Bx3) of lipid or glycerol infusion. #Significance relative to Bx1 given fitness category and infusion status; △significance relative to Bx2 given fitness category and infusion status; +significance between glycerol and lipid groups within fitness category for equivalent biopsies.
Muscle DAG levels.
Figure 2 depicts muscle DAG by time of biopsy and study group (actual values reported in Supplemental Table S1). At Bx3 after infusion, total DAG concentrations were greatest in the sedentary lipid group, which was also increased significantly compared with their own baseline (P = 0.03 compared with Bx1, P = 0.002 compared with Bx2), the sedentary glycerol group (P = 0.0003 at Bx3), and the trained lipid group (P = 0.01 at Bx3). In contrast, lipid infusion did not significantly alter total DAG in the trained group compared with its own baseline (Bx1) or the trained glycerol group (Bx3).
Fig. 2.

A 6-h Intralipid infusion alters muscle diacylglycerol (DAG) content and composition in sedentary but not trained participants. Total DAG is sum of myristic (14:0), palmitic (16:0), palmitoleic (16:1), stearic (18:0), oleic (18:1), elaidic (trans 18:1), linoleic (18:2), linolenic (18:3), and arachidonic acids (20:4). Saturated DAG is sum of myristic (14:0), palmitic (16:0), and stearic acid (18:0). Biopsies were performed Bx1, Bx2, and Bx3 of lipid or glycerol infusion. #Significance relative to Bx1 given fitness category and infusion status; △significance relative to Bx2 given fitness category and infusion status; +significance between glycerol and lipid groups within fitness category for equivalent biopsies; *significance between trained and sedentary groups for equivalent biopsies and infusion status.
We examined whether muscle DAG composition changed with lipid infusion. In the sedentary group, the increase in muscle DAG from lipid infusion appears to be driven by increases in oleic acid, linoleic acid, and linolenic acid. Specifically, lipid infusion significantly increased oleic acid (+50%; P = 0.04 for Bx3 compared with Bx1, P = 0.01 for Bx3 compared with Bx2), linoleic acid (+135%; P < 0.01 for Bx3 compared with Bx1, P < 0.01 for Bx3 compared with Bx2), and linolenic acid (+250%; P < 0.01 for Bx3 compared with Bx1 P < 0.01 for Bx3 compared with Bx2). In the sedentary group, lipid infusion did not significantly increase saturated DAG, eladic acid, or arachidonic acid levels relative to baseline. However, sedentary participants who received lipid infusion maintained higher saturated DAG (P = 0.02) and arachidonic acid levels (P = 0.01) and reduced elaidic acid (P = 0.003) significantly relative to the glycerol control by Bx3. Regardless of training status, participants who received lipid infusion did not significantly increase DAG myristic acid, palmitic acid, palmitoleic acid, or stearic acid relative to their own baseline. In the trained group, lipid infusion did not change total DAG or composition of DAG relative to the participants' own baseline or the trained glycerol control.
Muscle ceramide levels.
Figure 3 compares muscle ceramides by time of biopsy and study group. Regardless of training status, lipid infusion did not alter total or saturated ceramide (Fig. 3; actual values reported in Supplemental Table S1). In the sedentary group, glycerol infusion temporarily increased total and saturated ceramide levels (Bx2) relative to baseline (P < 0.05), which was not sustained by the end of infusion (P = 0.60). Linoleic and linolenic acid levels in muscle ceramides were not measured.
Fig. 3.
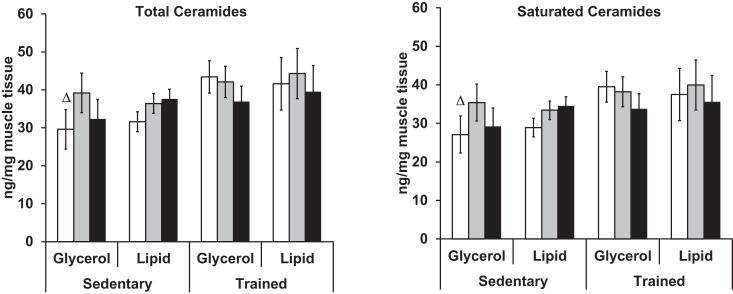
A 6-h Intralipid infusion does not alter muscle ceramide content or composition. Total ceramide is the sum of myristic (14:0), palmitic (16:0), stearic (18:0), oleic (18:1), arachidic (20:0), lignoceric (24:0), and nervonic acids (24:1). Saturated ceramides is the sum myristic (14:0), palmitic (16:0), stearic (18:0), arachidic (20:0), and lignoceric acids (24:0). Biopsies were performed at Bx1, Bx2, and Bx3 of lipid or glycerol infusion. △Significance relative to Bx2 given fitness category and infusion status.
Muscle acylcarnitine levels.
To see whether lipid infusion might alter muscle acylcarnitine content, palmitoyl-carnitine and oleoyl-carnitine were quantified from the serial muscle biopsies. At baseline, palmitoyl-carnitine was significantly higher (P = 0.03) in trained participants (0.006 ± 0.001 μg/mg tissue) than in sedentary participants (0.004 ± 0.001 μg/mg tissue). At baseline, oleoyl-carnitine was significantly higher (P = 0.001) in trained participants (0.03 ± 0.003 μg/mg tissue) than in sedentary participants (0.01 ± 0.001 μg/mg tissue). Neither lipid infusion nor glycerol infusion altered palmitoyl-carnitine or oleoyl-carnitine levels in either activity group (values reported in Supplemental Table S1).
DISCUSSION
This study examined the effect of training on lipid and lipid metabolite accumulation in muscle during acute, moderate FFA elevation from Intralipid infusion. We were interested in whether training might alter muscle lipid accumulation during acute FFA elevation and whether this might mirror the decline in insulin sensitivity with acute FFA elevation. Similarly to our previous analysis of a subset of the presented data (13), insulin sensitivity decreased to a similar degree in both trained and sedentary participants in response to the lipid infusion. Under these conditions, we did not see an overall increase in muscle levels of TAG, but we did observe accumulation of linoleic and linolenic acid in muscle TAG, reflecting the lipid infusion. In sedentary participants, acute FFA increased DAG levels, with DAG composition reflecting the FFA exposure. In contrast, acute FFA elevation did not alter total DAG or composition of DAG in trained participants. Acute FFA elevation did not alter muscle ceramide levels (total or saturated) or muscle acylcarnitine (palmitoyl-carnitine or oleoyl-carnitine) levels in trained or sedentary participants. These findings suggest that lipid-induced insulin resistance may be dissociated from total muscle TAG, DAG, and ceramide accumulation, particularly for trained humans.
The majority of the current literature examining training effects on muscle lipid has focused on a single time point. In trained participants, the maintenance of insulin sensitivity in the setting of high muscle lipid has generally been attributed to alteration in muscle metabolites, specifically lower total DAG (5, 18), lower saturated DAG (5), alterations in DAG localization (5), reduced total ceramide content (12, 18), and reduced saturated ceramide content (12). This literature, however, remains mixed as training has also been shown to be associated with higher total DAG (1), no change in total DAG (17), and no change in total ceramides (1, 17). The use of lipid plus heparin to significantly increase FFA two- to fourfold above baseline in sedentary participants does not alter muscle DAG (as measured by DAG-kinase assay) (45) or ceramide content (25, 45). Our findings extend this literature by using serial biopsies to examine how training modifies muscle lipid accumulation, as measured by liquid chromatography/tandem mass spectrometry, in response to a more modest FFA exposure.
The mechanism for muscle lipid accumulation and reduction in insulin sensitivity from acute FFA elevation appears to be distinct. Intralipid is comprised predominantly of polyunsaturated fatty acids [linoleic (44–62%), oleic (19–30%), palmitic (7–14%), linolenic (4–11%), and stearic acid (1.4–5.5%)] (19). Because lipid infusion increased both linolenic and linoleic acid in TAG, plasma FFA appears to be incorporated into muscle TAG. The lipid infusion caused statistically significant increases in oleic acid, linolenic acid, and linoleic acid in DAG in the sedentary participants, with a trend toward an increase in trained participants. This suggests that plasma FFAs are more likely to accumulate in DAG in the sedentary than in trained humans, which could theoretically be due to increased FFA incorporation into DAG, reduced transition from DAG to TAG, or a combination of these two mechanisms.
Our data suggest that the plasma FFA kinetics through the DAG pool is different between sedentary and trained subjects. Given the serial biopsies in this study, alterations in muscle TAG and DAG reflective of the lipid infusion appear earlier in sedentary participants than in trained participants. This suggests that in the sedentary participants, FFAs from the lipid infusion may enter more readily into DAG and more rapidly transition to TAG than the trained group. It is possible that the FFAs from lipid infusion in trained adults might be trafficked preferentially to phospholipid synthesis for a period of time before beginning to appear in DAG and then TAG (40). Future studies that employ FFA stable isotope infusions will be important to distinguish the possible fates of intramyocellular fatty acids and the response to training (27, 28).
Yet regardless of the differences in lipid accumulation, both trained and sedentary groups had a profound reduction in insulin sensitivity with acute FFA elevation. Although the reduction in insulin sensitivity in our trained participants was more profound than that reported by an independent group (37), this group (37) observed that acute FFA elevation reduced oxidative glucose disposal. Thus, a potential mechanism for our observed decline in insulin sensitivity with FFA exposure may trace back to the Randle theory, which states that increased fat utilization occurs at the expense of glucose utilization (38). It has been shown previously that lipid infusion increases pyruvate dehydrogenase kinase-4 phosphorylation (37), suggesting that the Randle cycle contributes to the reduced glucose oxidation. The stability of muscle palmitoyl-carnitine and oleoyl-carnitine content regardless of infusion suggests that lipid infusion does not indiscriminately increase acylcarnitines. Whether this reflects increased muscle fat oxidation or a mismatch between fatty acid oxidation and TCA cycle flux (29) as a reason for reduced insulin sensitivity remains unknown, as other acyl-carnitines, not measured due to the lack of comprehensive long-chain acyl-carnitine standards at the time of the analyses, might be increased (29).
The clinical relevance of our findings is that regardless of training status, moderate, acute FFA elevation is sufficient to reduce insulin sensitivity independently of muscle TAG, DAG, ceramide, and acylcarnitine accumulation. Our study contrasts with earlier studies that have attributed lipid-induced insulin resistance to accumulation of total DAG (26) or ceramides (44) and suggests that factors beyond lipotoxicity (42) may also contribute to lipid-induced insulin resistance. Our findings will direct future studies to examine how training alters muscle lipid accumulation and turnover and to determine whether this would have implications on maintaining insulin sensitivity outside of acute FFA exposure.
This study has several strengths. One strength is the use of serial biopsies to evaluate lipid and lipid metabolites prospectively over moderate FFA infusion, which showed that alterations in muscle TAG and DAG that are reflective of the lipid infusion occur earlier in sedentary than in trained humans. Another strength is the use of cutting edge mass spectroscopy to quantify the composition of DAG, ceramides, and acylcarnitine to provide a more nuanced perspective beyond total levels of lipid metabolites. Yet another strength is the ability to specifically examine the effect of acute FFA elevation by using a glycerol control matched to the glycerol content of the lipid infusion. We acknowledge several limitations of the study. This study did not measure glucose oxidation or nonoxidative glucose disposal. The study did not examine lipid droplet size, number, or localization relative to mitochondria, all of which may play a role in lipid mobilization separately from total muscle TAG levels (17). We did not determine DAG localization relative to the membrane or cytosol, which may play an important role in DAG's effects (5). Finally, we did not measure whole body lipid oxidation (20) or muscle lipid oxidation (4), which may influence muscle lipid accumulation.
CONCLUSIONS
We found that regardless of activity status, moderate FFA elevation profoundly reduces insulin sensitivity and alters muscle TAG composition. Training status is associated with a divergence in DAG accumulation with moderate FFA elevation and appears to affect muscle lipid storage in response to FFA exposure. These findings suggest that lipid-induced insulin resistance may be dissociated from total muscle TAG, DAG, and ceramide accumulation, particularly for trained humans. These findings also suggest that the increase in total muscle DAG is not necessary for acute fatty acid-induced insulin resistance in athletes and suggest the need to reconsider DAG as the causative factor for muscle insulin resistance. Whether this reflects the mechanism by which training preserves muscle insulin sensitivity outside of acute FFA elevation requires further study.
GRANTS
This work was supported by the National Institutes of Health [5K12-RR-023247-02, DK-50456, UL1 TR000135 (Mayo CTSA)], the Minnesota Medical Foundation, the Pennock Family Foundation, the University of Minnesota (CTSA: NIH UL1TR000114), and the Metabolic Studies Core of the Minnesota Obesity Center.
DISCLOSURES
No author has any conflict of interest, financial or otherwise, with this study.
AUTHOR CONTRIBUTIONS
L.S.C. and E.R.S. conception and design of research; L.S.C., D.G.M., and X.-M.P. performed experiments; L.S.C., E.A., L.E.E., E.R.S., and M.D.J. analyzed data; L.S.C., D.G.M., E.A., L.E.E., E.R.S., and M.D.J. interpreted results of experiments; L.S.C. and L.E.E. prepared figures; L.S.C., E.A., L.E.E., and X.-M.P. drafted manuscript; L.S.C., D.G.M., E.A., L.E.E., X.-M.P., M.T.M., E.R.S., and M.D.J. edited and revised manuscript; L.S.C., D.G.M., E.A., L.E.E., X.-M.P., M.T.M., E.R.S., and M.D.J. approved final version of manuscript.
Supplementary Material
ACKNOWLEDGMENTS
We acknowledge the assistance of Dr. Anne Marie Weber-Main, Department of Medicine, University of Minnesota, for critical review and editing of manuscript drafts.
REFERENCES
- 1.Amati F, Dube JJ, Alvarez-Carnero E, Edreira MM, Chomentowski P, Coen PM, Switzer GE, Bickel PE, Stefanovic-Racic M, Toledo FGS, Goodpaster BH. Skeletal muscle triglycerides, diacylglycerols, and ceramides in insulin resistance: another paradox in endurance-trained athletes? Diabetes 60: 2588–2597, 2011. [DOI] [PMC free article] [PubMed] [Google Scholar]
- 2.Baldeweg SE, Golay A, Natali A, Balkau B, Del Prato S, Coppack SW. Insulin resistance, lipid and fatty acid concentrations in 867 healthy Europeans. European Group for the Study of Insulin Resistance (EGIR). Eur J Clin Invest 30: 45–52, 2000. [DOI] [PubMed] [Google Scholar]
- 3.Belfort R, Mandarino L, Kashyap S, Wirfel K, Pratipanawatr T, Berria R, DeFronzo RA, Cusi K. Dose-response effect of elevated plasma free fatty acid on insulin signaling. Diabetes 54: 1640–1648, 2005. [DOI] [PubMed] [Google Scholar]
- 4.Berggren JR, Boyle KE, Chapman WH, Houmard JA. Skeletal muscle lipid oxidation and obesity: influence of weight loss and exercise. Am J Physiol Endocrinol Metab 294: E726–E732, 2008. [DOI] [PubMed] [Google Scholar]
- 5.Bergman BC, Hunerdosse DM, Kerege A, Playdon MC, Perreault L. Localisation and composition of skeletal muscle diacylglycerol predicts insulin resistance in humans. Diabetologia 55: 1140–1150, 2012. [DOI] [PMC free article] [PubMed] [Google Scholar]
- 6.Bergman BC, Perreault L, Hunerdosse DM, Koehler MC, Samek AM, Eckel RH. Increased intramuscular lipid synthesis and low saturation relate to insulin sensitivity in endurance-trained athletes. J Appl Physiol 108: 1134–1141, 2010. [DOI] [PMC free article] [PubMed] [Google Scholar]
- 7.Blachnio-Zabielska AU, Persson XM, Koutsari C, Zabielski P, Jensen MD. A liquid chromatography/tandem mass spectrometry method for measuring the in vivo incorporation of plasma free fatty acids into intramyocellular ceramides in humans. Rapid Commun Mass Spectrom 26: 1134–1140, 2012. [DOI] [PMC free article] [PubMed] [Google Scholar]
- 8.Boden G, Chen X. Effects of fat on glucose uptake and utilization in patients with non-insulin-dependent diabetes. J Clin Invest 96: 1261–1268, 1995. [DOI] [PMC free article] [PubMed] [Google Scholar]
- 9.Boden G, Jadali F, White J, Liang Y, Mozzoli M, Chen X, Coleman E, Smith C. Effects of fat on insulin-stimulated carbohydrate metabolism in normal men. J Clin Invest 88: 960–966, 1991. [DOI] [PMC free article] [PubMed] [Google Scholar]
- 10.Brechtel K, Dahl DB, Machann J, Bachmann OP, Wenzel I, Maier T, Claussen CD, Häring HU, Jacob S, Schick F. Fast elevation of the intramyocellular lipid content in the presence of circulating free fatty acids and hyperinsulinemia: a dynamic 1H-MRS study. Magn Reson Med 45: 179–183, 2001. [DOI] [PubMed] [Google Scholar]
- 12.Bruce CR, Thrush AB, Mertz VA, Bezaire V, Chabowski A, Heigenhauser GJ, Dyck DJ. Endurance training in obese humans improves glucose tolerance and mitochondrial fatty acid oxidation and alters muscle lipid content. Am J Physiol Endocrinol Metab 291: E99–E107, 2006. [DOI] [PubMed] [Google Scholar]
- 13.Chow LS, Seaquist ER, Eberly LE, Mashek MT, Schimke JM, Nair KS, Mashek DG. Acute free fatty acid elevation eliminates endurance training effect on insulin sensitivity. J Clin Endocrinol Metab 97: 2890–2897, 2012. [DOI] [PMC free article] [PubMed] [Google Scholar]
- 14.Craig CL, Marshall AL, Sjöström M, Bauman AE, Booth ML, Ainsworth BE, Pratt M, Ekelund U, Yngve A, Sallis JF, Oja P. International physical activity questionnaire: 12-country reliability and validity. Med Sci Sports Exerc 35: 1381–1395, 2003. [DOI] [PubMed] [Google Scholar]
- 15.Defronzo RA, Ferrannini E. Insulin resistance. A multifaceted syndrome responsible for NIDDM, obesity, hypertension, dyslipidemia, and atherosclerotic cardiovascular disease. Diabetes Care 14: 173–194, 1991. [DOI] [PubMed] [Google Scholar]
- 16.Defronzo RA, Jacot E, Jequier E, Maeder E, Wahren J, Felber JP. The effect of insulin on the disposal of intravenous glucose. Results from indirect calorimetry and hepatic and femoral venous catheterization. Diabetes 30: 1000–1007, 1981. [DOI] [PubMed] [Google Scholar]
- 17.Devries MC, Samjoo IA, Hamadeh MJ, McCready C, Raha S, Watt MJ, Steinberg GR, Tarnopolsky MA. Endurance training modulates intramyocellular lipid compartmentalization and morphology in skeletal muscle of lean and obese women. J Clin Endocrinol Metab 98: 4852–4862, 2013. [DOI] [PubMed] [Google Scholar]
- 18.Dubé JJ, Amati F, Stefanovic-Racic M, Toledo FG, Sauers SE, Goodpaster BH. Exercise-induced alterations in intramyocellular lipids and insulin resistance: the athlete's paradox revisited. Am J Physiol Endocrinol Metab 294: E882–E888, 2008. [DOI] [PMC free article] [PubMed] [Google Scholar]
- 19.FBP. Major Vegetable Fats. Cambridge, UK: Chapman and Hall, 1986. [Google Scholar]
- 20.Felber JP, Ferrannini E, Golay A, Meyer HU, Theibaud D, Curchod B, Maeder E, Jequier E, DeFronzo RA. Role of lipid oxidation in pathogenesis of insulin resistance of obesity and type II diabetes. Diabetes 36: 1341–1350, 1987. [DOI] [PubMed] [Google Scholar]
- 21.Folch J, Lees M, Sloane Stanley GH. A simple method for the isolation and purification of total lipides from animal tissues. J Biol Chem 226: 497–509, 1957. [PubMed] [Google Scholar]
- 22.Gsoodpaster BH, He J, Watkins S, Kelley DE. Skeletal muscle lipid content and insulin resistance: evidence for a paradox in endurance-trained athletes. J Clin Endocrinol Metab 86: 5755–5761, 2001. [DOI] [PubMed] [Google Scholar]
- 23.Guo ZK, Mishra P, Macura S. Sampling the intramyocellular triglycerides from skeletal muscle. J Lipid Res 42: 1041–1048, 2001. [PubMed] [Google Scholar]
- 24.Helmrich SP, Ragland DR, Leung RW, Paffenbarger RS. Physical activity and reduced occurrence of non-insulin-dependent diabetes-mellitus. N Engl J Med 325: 147–152, 1991. [DOI] [PubMed] [Google Scholar]
- 25.Hoeks J, Mensink M, Hesselink MK, Ekroos K, Schrauwen P. Long- and medium-chain fatty acids induce insulin resistance to a similar extent in humans despite marked differences in muscle fat accumulation. J Clin Endocrinol Metab 97: 208–216, 2012. [DOI] [PubMed] [Google Scholar]
- 26.Itani SI, Ruderman NB, Schmieder F, Boden G. Lipid-induced insulin resistance in human muscle is associated with changes in diacylglycerol, protein kinase C, and IkappaB-alpha. Diabetes 51: 2005–2011, 2002. [DOI] [PubMed] [Google Scholar]
- 27.Kanaley JA, Shadid S, Sheehan MT, Guo Z, Jensen MD. Hyperinsulinemia and skeletal muscle fatty acid trafficking. Am J Physiol Endocrinol Metab 305: E540–E548, 2013. [DOI] [PMC free article] [PubMed] [Google Scholar]
- 28.Kanaley JA, Shadid S, Sheehan MT, Guo Z, Jensen MD. Relationship between plasma free fatty acid, intramyocellular triglycerides and long-chain acylcarnitines in resting humans. J Physiol 587: 5939–5950, 2009. [DOI] [PMC free article] [PubMed] [Google Scholar]
- 29.Koves TR, Ussher JR, Noland RC, Slentz D, Mosedale M, Ilkayeva O, Bain J, Stevens R, Dyck JR, Newgard CB, Lopaschuk GD, Muoio DM. Mitochondrial overload and incomplete fatty acid oxidation contribute to skeletal muscle insulin resistance. Cell Metab 7: 45–56, 2008. [DOI] [PubMed] [Google Scholar]
- 30.Krssak M, Falk Petersen K, Dresner A, DiPietro L, Vogel SM, Rothman DL, Roden M, Shulman GI. Intramyocellular lipid concentrations are correlated with insulin sensitivity in humans: a 1H NMR spectroscopy study. Diabetologia 42: 113–116, 1999. [DOI] [PubMed] [Google Scholar]
- 31.Laybutt DR, Schmitz-Peiffer C, Saha AK, Ruderman NB, Biden TJ, Kraegen EW. Muscle lipid accumulation and protein kinase C activation in the insulin-resistant chronically glucose-infused rat. Am J Physiol Endocrinol Metab 277: E1070–E1076, 1999. [DOI] [PubMed] [Google Scholar]
- 32.Lillioja S, Mott DM, Spraul M, Ferraro R, Foley JE, Ravussin E, Knowler WC, Bennett PH, Bogardus C. Insulin resistance and insulin secretory dysfunction as precursors of non-insulin-dependent diabetes mellitus. Prospective studies of Pima Indians. N Engl J Med 329: 1988–1992, 1993. [DOI] [PubMed] [Google Scholar]
- 33.Liu L, Zhang Y, Chen N, Shi X, Tsang B, Yu YH. Upregulation of myocellular DGAT1 augments triglyceride synthesis in skeletal muscle and protects against fat-induced insulin resistance. J Clin Invest 117: 1679–1689, 2007. [DOI] [PMC free article] [PubMed] [Google Scholar]
- 34.Nair KS, Halliday D, Griggs RC. Leucine incorporation into mixed skeletal muscle protein in humans. Am J Physiol Endocrinol Metab 254: E208–E213, 1988. [DOI] [PubMed] [Google Scholar]
- 35.Pan DA, Lillioja S, Kriketos AD, Milner MR, Baur LA, Bogardus C, Jenkins AB, Storlien LH. Skeletal muscle triglyceride levels are inversely related to insulin action. Diabetes 46: 983–988, 1997. [DOI] [PubMed] [Google Scholar]
- 36.Persson XM, Blachnio-Zabielska AU, Jensen MD. Rapid measurement of plasma free fatty acid concentration and isotopic enrichment using LC/MS. J Lipid Res 51: 2761–2765, 2010. [DOI] [PMC free article] [PubMed] [Google Scholar]
- 37.Phielix E, Meex R, Ouwens DM, Sparks L, Hoeks J, Schaart G, Moonen-Kornips E, Hesselink MK, Schrauwen P. High oxidative capacity due to chronic exercise training attenuates lipid-induced insulin resistance. Diabetes 61: 2472–2478, 2012. [DOI] [PMC free article] [PubMed] [Google Scholar]
- 38.Randle PJ, Garland PB, Hales CN, Newsholme EA. The glucose fatty-acid cycle. Its role in insulin sensitivity and the metabolic disturbances of diabetes mellitus. Lancet 281: 785–789, 1963. [DOI] [PubMed] [Google Scholar]
- 39.Reaven GM, Hollenbeck C, Jeng CY, Wu MS, Chen YD. Measurement of plasma glucose, free fatty acid, lactate, and insulin for 24 h in patients with NIDDM. Diabetes 37: 1020–1024, 1988. [DOI] [PubMed] [Google Scholar]
- 40.Robinson MM, Turner SM, Hellerstein MK, Hamilton KL, Miller BF. Long-term synthesis rates of skeletal muscle DNA and protein are higher during aerobic training in older humans than in sedentary young subjects but are not altered by protein supplementation. FASEB J 25: 3240–3249, 2011. [DOI] [PMC free article] [PubMed] [Google Scholar]
- 41.Seals DR, Hagberg JM, Hurley BF, Ehsani AA, Holloszy JO. Effects of endurance training on glucose tolerance and plasma lipid levels in older men and women. JAMA 252: 645–649, 1984. [PubMed] [Google Scholar]
- 42.Shulman GI. Cellular mechanisms of insulin resistance. J Clin Invest 106: 171–176, 2000. [DOI] [PMC free article] [PubMed] [Google Scholar]
- 43.Shulman GI, Rothman DL, Jue T, Stein P, Defronzo RA, Shulman RG. Quantitation of muscle glycogen synthesis in normal subjects and subjects with non-insulin-dependent diabetes by 13C nuclear magnetic resonance spectroscopy. N Engl J Med 322: 223–228, 1990. [DOI] [PubMed] [Google Scholar]
- 44.Straczkowski M, Kowalska I, Nikolajuk A, Dzienis-Straczkowska S, Kinalska I, Baranowski M, Zendzian-Piotrowska M, Brzezinska Z, Gorski J. Relationship between insulin sensitivity and sphingomyelin signaling pathway in human skeletal muscle. Diabetes 53: 1215–1221, 2004. [DOI] [PubMed] [Google Scholar]
- 45.Vistisen B, Hellgren LI, Vadset T, Scheede-Bergdahl C, Helge JW, Dela F, Stallknecht B. Effect of gender on lipid-induced insulin resistance in obese subjects. Eur J Endocrinol 158: 61–68, 2008. [DOI] [PubMed] [Google Scholar]
- 46.Yu C, Chen Y, Cline GW, Zhang D, Zong H, Wang Y, Bergeron R, Kim JK, Cushman SW, Cooney GJ, Atcheson B, White MF, Kraegen EW, Shulman GI. Mechanism by which fatty acids inhibit insulin activation of insulin receptor substrate-1 (IRS-1)-associated phosphatidylinositol 3-kinase activity in muscle. J Biol Chem 277: 50230–50236, 2002. [DOI] [PubMed] [Google Scholar]
Associated Data
This section collects any data citations, data availability statements, or supplementary materials included in this article.