

Abstract
Fat-induced hepatic insulin resistance plays a key role in the pathogenesis of type 2 diabetes in obese individuals. Although PKC and inflammatory pathways have been implicated in fat-induced hepatic insulin resistance, the sequence of events leading to impaired insulin signaling is unknown. We used Wistar rats to investigate whether PKCδ and oxidative stress play causal roles in this process and whether this occurs via IKKβ- and JNK-dependent pathways. Rats received a 7-h infusion of Intralipid plus heparin (IH) to elevate circulating free fatty acids (FFA). During the last 2 h of the infusion, a hyperinsulinemic-euglycemic clamp with tracer was performed to assess hepatic and peripheral insulin sensitivity. An antioxidant, N-acetyl-l-cysteine (NAC), prevented IH-induced hepatic insulin resistance in parallel with prevention of decreased IκBα content, increased JNK phosphorylation (markers of IKKβ and JNK activation, respectively), increased serine phosphorylation of IRS-1 and IRS-2, and impaired insulin signaling in the liver without affecting IH-induced hepatic PKCδ activation. Furthermore, an antisense oligonucleotide against PKCδ prevented IH-induced phosphorylation of p47phox (marker of NADPH oxidase activation) and hepatic insulin resistance. Apocynin, an NADPH oxidase inhibitor, prevented IH-induced hepatic and peripheral insulin resistance similarly to NAC. These results demonstrate that PKCδ, NADPH oxidase, and oxidative stress play a causal role in FFA-induced hepatic insulin resistance in vivo and suggest that the pathway of FFA-induced hepatic insulin resistance is FFA → PKCδ → NADPH oxidase and oxidative stress → IKKβ/JNK → impaired hepatic insulin signaling.
Keywords: free fatty acids, insulin resistance, hyperinsulinemic-euglycemic clamp, antioxidant, antisense oligonucleotides
free fatty acids (FFA), which are often elevated in obese individuals (3), play a causal role, together with adipokines, in the association between obesity and insulin resistance (34). Although the mechanisms of FFA-induced insulin resistance in muscle have been partially clarified, less is known about FFA-induced hepatic insulin resistance despite its key role in the pathogenesis of type 2 diabetes mellitus (T2DM). We (32) have previously demonstrated that FFA induce hepatic insulin resistance in parallel with PKCδ membrane translocation, which indicates its activation, and this link has been confirmed by others (7). PKC impairs tyrosine phosphorylation of IRS by phosphorylating its serine/threonine residues (28), at least in part via IKKβ and JNK (20). PKC is also a known activator of NADPH oxidase (53), which increases reactive oxygen species (ROS). ROS, in turn, can activate PKC (52) as well as IKKβ (27) and JNK (18). FFA-induced hepatic insulin resistance and PKCδ membrane translocation are associated with IKKβ activation (7), and we have found that FFA-induced hepatic insulin resistance is prevented by high-dose salicylate, an IKKβ inhibitor (44). JNK is upregulated in various animal models of obesity and insulin resistance (25) and, like IKKβ (19), is capable of inhibiting insulin signaling via serine phosphorylation of IRS (1).
Oxidative stress has been linked to multiple forms of insulin resistance (26). We (24) have demonstrated that the antioxidant N-acetyl-l-cysteine (NAC) or taurine prevents hyperglycemia-induced insulin resistance in rats. We have also shown that oral taurine partially prevents FFA-induced whole body insulin resistance in humans (56), and other authors obtained similar results using intravenous infusion of glutathione (43). However, whether oxidative stress is a causal factor in FFA-induced hepatic insulin resistance in vivo remains to be determined, and the signaling mechanisms upstream and downstream of oxidative stress have not yet been explored.
The objectives of the present study were to determine whether 1) NAC prevents FFA-induced hepatic and peripheral insulin resistance; 2) FFA-induced hepatic insulin resistance is associated with PKCδ activation, oxidative stress, IKKβ/JNK activation, and serine phosphorylation of IRS-1 and -2; and 3) NAC prevents the FFA-induced changes in any of these parameters. To this end, rats were infused intravenously with saline (SAL), Intralipid plus heparin (IH) to elevate plasma FFA levels, IH along with NAC, or NAC alone for 7 h. During the last 2 h of the infusion, glucose tracer was infused to measure glucose production and utilization in the basal state or during hyperinsulinemic-euglycemic clamp (Fig. 1). In addition, to determine whether PKCδ activation contributes to FFA-induced hepatic insulin resistance and whether this involves NADPH oxidase activation, SAL/IH infusion was carried out with or without treatment with antisense oligonucleotide specific for PKCδ or a pharmacological inhibitor of NADPH oxidase. At the end of each experiment, liver tissue was collected for determination of signaling pathways potentially involved in FFA-induced hepatic insulin resistance in vivo.
Fig. 1.

Schema illustrating the protocols used in the main study (NAC study). SAL, saline; IH, Intralipid + heparin. NAC, N-acetyl-l-cysteine.
MATERIALS AND METHODS
Animals and Surgery
The animal care committee of the University of Toronto approved all procedures. Female Wistar rats weighing 250–300 g were obtained from Charles River (Saint-Constant, QC, Canada) and fed standard rat chow (Purina 5001; Ralston Purina, St. Louis, MO) for the IH-NAC study and Teklad Global #2018 (Harland-Teklad Global Diets, Madison, WI) for the other studies until experiments, which occurred ∼10 days after. Cannulation of a jugular vein and a carotid artery, for infusions and blood sampling, respectively (32), was performed at least 3 days before experiments.
Experimental Design
NAC study.
Rats were fasted overnight and randomly divided into either a basal protocol or a clamp protocol, which were performed in the conscious rat (Fig. 1). For each protocol, rats were subjected to 7-h intravenous infusion of 1) SAL control (5.5 μl/min); 2) IH (20% Intralipid + 20 U/ml heparin, 5.5 μl/min); 3) IH + NAC (Sigma-Aldrich, St. Louis, MO; 0.35 mg·kg−1·min−1); or 4) NAC alone. We (32) have previously shown that infusion of glycerol matching the plasma glycerol levels achieved with IH does not affect endogenous glucose production (EGP) or glucose utilization (GU) when compared with saline infusion.
For the basal protocol, during the last 2 h of the experiment, [6-3H]glucose (740 KBq bolus + 14.8 KBq/min infusion) was given to assess basal glucose production. The clamp protocol involved the same infusion groups (n = 6–9/group) as the basal protocol, with the additional infusion of insulin (5 mU·kg−1·min−1) during the last 2 h of the infusion period. Since we have previously reported that IH decreases insulin clearance in this model (32), in addition to the 5 mU·kg−1·min−1 insulin infusion group, we studied another IH group where we experimentally matched the insulin levels by lowering the insulin infusion rate to 2.5 mU·kg−1·min−1. In the IH + NAC and NAC-alone groups, we used the full dose of insulin. The details of the clamp and tissue collection have been reported previously (32). Tissue determinations were performed on the basal experiments, unless specified.
For measurement of insulin-stimulated tyrosine phosphorylation of IRS-1 and -2, and Ser473 phosphorylation of Akt in the liver, at the end of the basal experiment, under anesthesia, the rats received an insulin (Humulin R, Lilly; 2 U/kg over 1 min) or saline bolus through the portal vein.
To control for the caloric load of IH, we also performed a set of experiments where we elevated the FFA by direct oleate infusion (1.37 μmol/min) prepared in FFA-free bovine serum albumin (BSA) (5, 39, 42) with or without NAC. Oleate infusion was given for 7 h, and we performed a 2-h hyperinsulinemic clamp (5 mU·kg−1·min−1) in the last 2 h. The clamp protocol was the same as in our previous study with salicylate (44); i.e., basal and clamp EGP were assessed with [3-3H]glucose tracer in the same rat. Similarly to our previous study (44), we did not perform a half-dose insulin infusion experiment, as the plasma insulin levels were matched with full-dose insulin infusion in all groups.
PKCδ antisense oligonucleotide study.
Lead PKCδ antisense oligonucleotide (ASO) was selected based on dose-response characterization using several different types of PKCδ ASO provided by ISIS Pharmaceuticals (Carlsbad, CA). The control (CON) ASO contained a scrambled sequence and is not complementary to any known gene in public databases. The first five bases and last five bases of chimeric ASOs have a 2′-O-(2-methoxy)-ethyl modification, and the ASOs also have a phosphorothioate backbone. This chimeric design has been shown to provide both increased nuclease resistance and mRNA affinity while maintaining the robust RNase H terminating mechanism used by these types of ASOs (22). Rats were injected with PKCδ ASO or CON ASO intraperitoneally at a dose of 20 mg/kg three times per week for 2 wk. Vessel cannulation was performed between the 4th and the 5th injections. After the last injection, the rats were overnight fasted and then subjected to 7-h intravenous infusion of SAL/IH. The same clamp protocol as for the oleate study was used, and we did not perform a half-dose insulin infusion experiment, as the plasma insulin levels were matched with full-dose insulin infusion in all groups.
Apocynin study.
The same protocol as for the ASO study was used except that apocynin (Calbiochem, EMD Millipore, Billerica, MA; 0.5 μmol·kg−1·min−1), an NADPH oxidase inhibitor, or vehicle was infused intravenously. We did not perform a half-dose insulin infusion experiment, as the plasma insulin levels were matched with full-dose insulin infusion in all groups.
Plasma Assays
FFA were measured on plasma samples treated with a lipoprotein lipase inhibitor, Orlistat (Roche; 30 μg/ml plasma), as described before (32). Plasma glucose, glucose specific activity, insulin, and C-peptide assays were performed as in Refs. 32 and 44.
Hepatic Contents of Diacylglycerol, Triglyceride, Ceramide, and Long-Chain Fatty Acyl-CoA
For measurement of hepatic content of diacylglycerol (DAG), ceramide, and triglyceride (TG), liver tissue was collected in methanol, and the lipids were extracted as described previously (38). Ceramide and DAG concentrations were measured after their conversions to ceramide-1-phosphate and phosphatidate, respectively, using diacylglycerol kinase (EMD Chemicals) and [γ-32P]ATP (38). Standards of up to 200 pmol of ceramide (Sigma) or sn-1,2-dioleoylglycerol (Sigma) were processed at the same time. Samples of the heptane phase of the extract and triolein (Sigma) standards (up to 12 nmol) were also dried under N2 and dissolved in 100 μl of Triglyceride GPO Reagent Set (Point Scientific, Canton, MI). They were incubated at 37°C with mixing for 80 min, and 90-μl samples were transferred to a 96-well plate. Absorbancy was measured at 492 nm. All results were normalized to the phospholipid concentration of the extract (38). Long-chain fatty acyl-CoA (LCFA-CoA) was extracted and fractionated by reverse-phase HPLC as previously reported (55).
Liver Fractionation and Western Blot Analysis
Liver samples were separated into cytosolic and membrane fractions, and Western blot was performed as previously described (32). Antibody for PKCδ [Sigma for the NAC study and Santa Cruz Biotechnology (Santa Cruz, CA) for the PKCδ ASO study] was used at a concentration of 1:2,000. Tyr311-phosphorylated PKCδ and Ser345-phosphorylated p47phox were measured in the membrane fraction with antibodies from Biosource (Life Technologies, Carlsbad, CA; 1:1,250) and from the laboratory of Dr. J. El-Benna (1:2,500) (12), respectively. Hepatic content of IκBα, and serine-phosphorylated and total IRS-1 and -2 were determined in the cytosolic fraction as described previously (44). Cytosolic Thr183/Tyr185-phosphorylated JNK (1:250) and total JNK (1:500) were assessed with antibodies from Santa Cruz Biotechnology. The antibody for actin was from Santa Cruz Biotechnology.
For measurement of phosphorylated insulin receptor and carcinoembryonic antigen-related cell adhesion molecule 1 (CEACAM1), the liver samples were collected at the end of the clamp of the IH/NAC study (where changes in insulin clearance were observed). Livers of the full-dose IH experiments were used. Proteins (100 μg per bicinchoninic acid method, Pierce), were analyzed by 8% SDS-PAGE and sequential immunoblotting with polyclonal antibodies against phosphorylated CEACAM1 (Bethyl Laboratories) and rat CEACAM1 (α-Y513), raised against C-SSPTETVY513SVKKK peptide in the cytoplasmic tail, to assess the amount of the rat CEACAM1 protein. Other aliquots were analyzed by sequential immunoprobing with a polyclonal antibody against insulin receptor β-subunit (C19, Santa Cruz Biotechnology), followed by a horseradish peroxidase-conjugated phosphotyrosine monoclonal antibody (4G10, Upstate), to assess insulin receptor phosphorylation. Reprobing with a monoclonal antibody against actin (Santa Cruz Biotechnology) was performed to normalize for the amount of proteins loaded.
Immunoprecipitation
The same procedure was used as in our previous study (44).
Carbonyl Protein Assay
Liver tissue was homogenized at 4°C in a solution containing HEPES (10 mM, pH 7.4), NaCl (137 mM), KCl (4.6 mM), KH2PO4 (1.1 mM), MgSO4 (0.6 mM), EDTA (1.1 mM), leupeptin (0.5 μg/ml), pepstatin (0.7 μg/ml), PMSF (40 μg/ml), and aprotinin (0.5 μg/ml) to solubilize protein, and cell debris was removed by centrifugation. Protein concentrations were determined as described previously (32). Oxidative protein damage, assessed by the formation of carbonyl groups, was measured as described by Levine et al. (33). To remove nucleic acids, samples were incubated with 10% streptomycin sulfate until a final concentration of 1% streptomycin sulfate was reached. Carbonyl content was calculated from the absorbance of samples at 365 nm compared with their complementary HCl-treated blanks, using a molar absorption coefficient of 22,000 M−1·cm−1.
mRNA for Gluconeogenic Enzymes
Total RNA was extracted from rat livers with the RNeasy Mini Kit from Qiagen (Valencia, CA) according to the manufacturer's instructions. Liver samples (20 mg) were disrupted and homogenized using Buffer RLT (β-mercaptoethanol added). The RNA was quantified spectrophotometrically and then stored at −80°C. cDNAs were generated by reverse transcriptase reactions using TaqMan reverse transcription reagents (Applied Biosystems). Real-time PCR analysis was performed in 96-well plates, using SYBR-Green Master Mix (Applied Biosystems) in 25-μl reaction mixtures with an ABI 7900HT machine (Applied Biosystems) with the following settings: 50°C for 2 min, 95°C for 10 min, 40 cycles of 95°C for 9 s, 60°C for 1 min. The sequences of primers used were as follows: PEPCK (phosphoenolpyruvate carboxykinase), forward GCCTGTGGGAAAACCAACCT, reverse CACCCACATTCAACTTTCCA; G6Pase (glucose-6-phosphatase), forward CGTCTGTCTGTCCCGGATCTA, reverse TGAAAGTTTCAGCCACAGCAA; β-actin, forward GGCCAACCGTGAAAAGATGA, reverse ACCAGAGGCATACAGGGACAA. Samples from seven to eight rats for each condition were each assayed in triplicate. Results were normalized to the β-actin endogenous control and analyzed with an ABI sequence detector software version 2.1 by using the relative quantification method (ΔΔCT).
Calculations
Glucose turnover was calculated using Steele's equation, taking into account the extra tracer infused with the glucose infusate (15). Data are presented as averages during the last 30 min of experiments.
Statistics
One-way ANOVA for repeated measures followed by Tukey's post hoc test was used to compare differences between treatments in both the basal and clamp groups. Two-way ANOVA with interaction was used to compare differences induced by treatment between basal and clamp. In the oleate, PKCδ ASO, and apocynin studies, in which basal and clamp evaluations of glucose turnover were performed in the same rat, percentage suppression of EGP from basal was calculated. Statistics were performed using SAS (Statistical Analysis System, Cary, NC).
RESULTS
NAC Prevents IH-Induced Hepatic and Peripheral Insulin Resistance
IH infusion for 7 h increased plasma FFA approximately three- to fourfold, and FFA were lower during the hyperinsulinemic clamp than during the basal state (Table 1). Coinfusion of the antioxidant NAC did not affect plasma FFA. Basal plasma glucose was higher in IH than in the other groups, but during the hyperinsulinemic clamp there was no significant difference in plasma glucose between groups. IH increased basal plasma insulin and C-peptide, suggesting that FFA increased endogenous insulin secretion; this was not prevented by IH + NAC. During the clamp, plasma C-peptide levels were lower than those in the basal state in all groups, indicating that insulin secretion was almost completely suppressed by insulin. During the clamp, the IH group receiving 5 mU·kg−1·min−1 had higher insulin levels (Table 1), indicating a decrease in insulin clearance, as previously observed (32). Clamp insulin levels were matched in the SAL and IH groups by infusing insulin at 2.5 mU·kg−1·min−1 in the IH group (half-insulin IH group). In the IH + NAC group, the insulin levels were not different from those in the SAL group, indicating that NAC prevented the IH-induced decrease in insulin clearance (Table 1). Glucose infusion rate during the clamp, which indicates whole body insulin sensitivity, was lower in both IH groups than in the other groups (Table 1).
Table 1.
Plasma levels of metabolic parameters and GIR in the basal state and during 2-h hyperinsulinemic-euglycemic clamp
| Basal |
Clampa |
||||||||
|---|---|---|---|---|---|---|---|---|---|
| SAL | IH | IH+NAC | NAC | SAL | IH (full insulin) | IH (half insulin) | IH+NAC | NAC | |
| FFA, mM | 0.48 ± 0.04 | 1.63 ± 0.23* | 1.93 ± 0.40* | 0.65 ± 0.06 | 0.17 ± 0.05 | 0.66 ± 0.07# | 1.24 ± 0.10& | 1.06 ± 0.15& | 0.16 ± 0.06 |
| Glucose, mM | 6.7 ± 0.3 | 7.3 ± 0.2§ | 6.7 ± 0.4 | 6.8 ± 0.3 | 6.2 ± 0.1 | 6.5 ± 0.2 | 6.3 ± 0.2 | 6.9 ± 0.1 | 7.2 ± 0.1 |
| Insulin, pM | 89 ± 8 | 147 ± 16* | 152 ± 34 | 104 ± 32 | 560 ± 72 | 1103 ± 106** | 597 ± 16 | 541 ± 24 | 669 ± 63 |
| C-peptide, nM | 0.28 ± 0.05 | 0.85 ± 0.18* | 0.81 ± 0.18* | 0.34 ± 0.05 | 0.03 ± 0.003 | 0.07 ± 0.02 | 0.09 ± 0.02 | 0.05 ± 0.01 | 0.07 ± 0.03 |
| GIR, μmol·kg−1·min−1 | 163 ± 12.1 | 74.3 ± 12.3† | 39.4±4.9‡ | 147 ± 4.7 | 164 ± 8.8 | ||||
Data are means ± SE (n = 6–9/group) and refer to the last 30 min of each experiment.
SAL, saline; IH, Intralipid + heparin; NAC, N-acetyl-l-cysteine; FFA, free fatty acids; GIR, glucose infusion rate.
Insulin infusion rate 5 mU·kg−1·min−1 in SAL, IH (full insulin), IH+NAC, NAC. Infusion rate 2.5 mU·kg−1·min−1 in IH (half insulin) (to match clamp insulin levels).
P < 0.01 and
P < 0.05 vs. SAL;
P < 0.05 and
P < 0.001 vs. SAL and NAC;
P < 0.01 vs. other treatment groups;
P < 0.01 and
P < 0.001 vs. SAL, IH+NAC and NAC.
IH increased EGP in the basal state as well as during the clamp, and severely impaired (both insulin doses) the suppressive effect of insulin on EGP (Fig. 2A), thereby indicating that IH caused hepatic insulin resistance. Coinfusion of NAC with IH decreased EGP both in the basal state and during the clamp and restored the suppressive effect of insulin on EGP. IH also increased hepatic mRNA levels of the gluconeogenic enzymes PEPCK and G6Pase, and this was prevented by NAC (Table 2). During the clamp with both insulin doses, IH infusion also decreased GU (Fig. 2B), which was prevented by coinfusing NAC. NAC alone had no effect on EGP or GU. These data show that NAC prevents FFA-induced hepatic and peripheral insulin resistance.
Fig. 2.
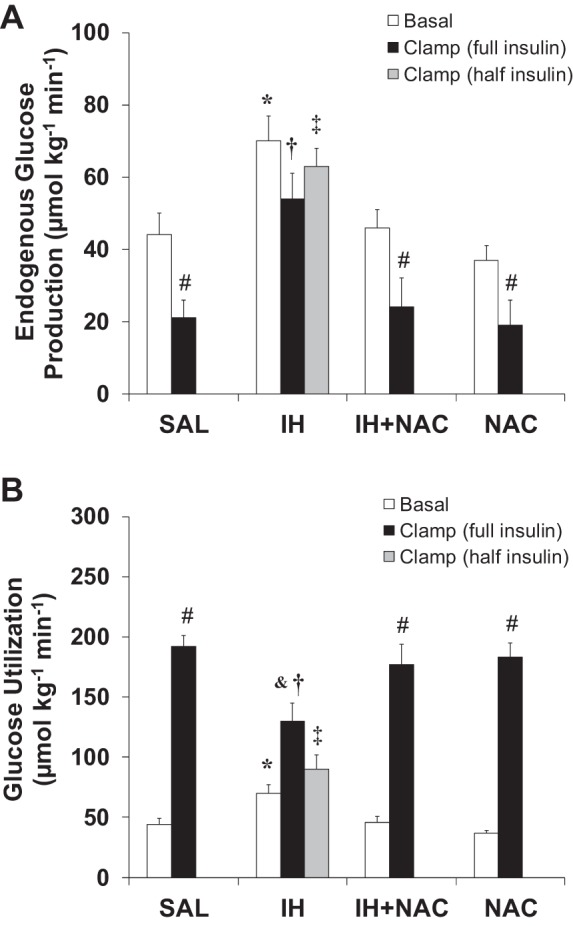
Effects of IH and NAC on endogenous glucose production (EGP) and glucose utilization (GU) during the basal state and during the clamp (n = 6–9/group). A: IH infusion significantly increased basal and clamp EGP and severely impaired insulin-induced suppression of EGP, which was prevented by NAC coinfusion. B: IH infusion decreased insulin-stimulated peripheral GU, which was prevented by NAC coinfusion. Data are means ± SE and refer to the last 30 min of each experiment. Basal, basal fasting state. Clamp (full insulin), 2-h hyperinsulinemic-euglycemic clamp, insulin infusion rate 5 mU·kg−1·min−1. Clamp (half insulin), 2-h hyperinsulinemic-euglycemic clamp, insulin infusion rate: 2.5 mU·kg−1·min−1. *P < 0.01 IH vs. other treatment groups in the basal state; †P < 0.01 and ‡P < 0.001 IH vs. SAL, IH+NAC, and NAC during the clamp; &P < 0.05 and #P < 0.001, Clamp vs. Basal.
Table 2.
mRNA levels of gluconeogenic enzymes in the liver as measured by real-time RT-PCR and hepatic content of DAG and TG
| SAL | IH | IH+NAC | NAC | |
|---|---|---|---|---|
| Pepck mRNA | 1.0 ± 0.24 | 2.46 ± 0.38* | 0.92 ± 0.12 | 0.41 ± 0.06 |
| G6pase mRNA | 1.0 ± 0.21 | 5.49 ± 1* | 0.89 ± 0.13 | 0.24 ± 0.04* |
| TG (pmol/nmol total phospholipids) | 209 ± 23 | 290 ± 16* | 300 ± 45* | 240 ± 56 |
| DAG (pmol/nmol total phospholipids) | 97.4 ± 17.1 | 155.2 ± 5.29* | 146.5 ± 8.76* | 116.4 ± 20.8 |
For mRNA, data are mean fold difference compared with SAL group ± SE.
Pepck, phosphoenolpyruvate carboxykinase; G6pase, glucose-6-phosphatase.
For triglyceride (TG) and diacylglycerol (DAG), data are means ± SE and correspond to liver tissues collected at the end of the hyperinsulinemic-euglycemic clamp (full dose insulin for IH) (n = 6–8/group).
P < 0.05 vs. SAL.
To control for the caloric load of IH, we also performed experiments where we elevated FFA by direct infusion of oleate with or without NAC. FFA were elevated to ∼1 mM, which was less than in the IH + NAC study, and the plasma insulin concentrations were matched with the same rate of insulin infusion in all groups (Fig. 3). Basal EGP was also not significantly elevated by oleate (Table 3). Similar to IH, oleate induced hepatic and peripheral insulin resistance, and both were prevented by NAC (Fig. 3 and Table 3).
Fig. 3.
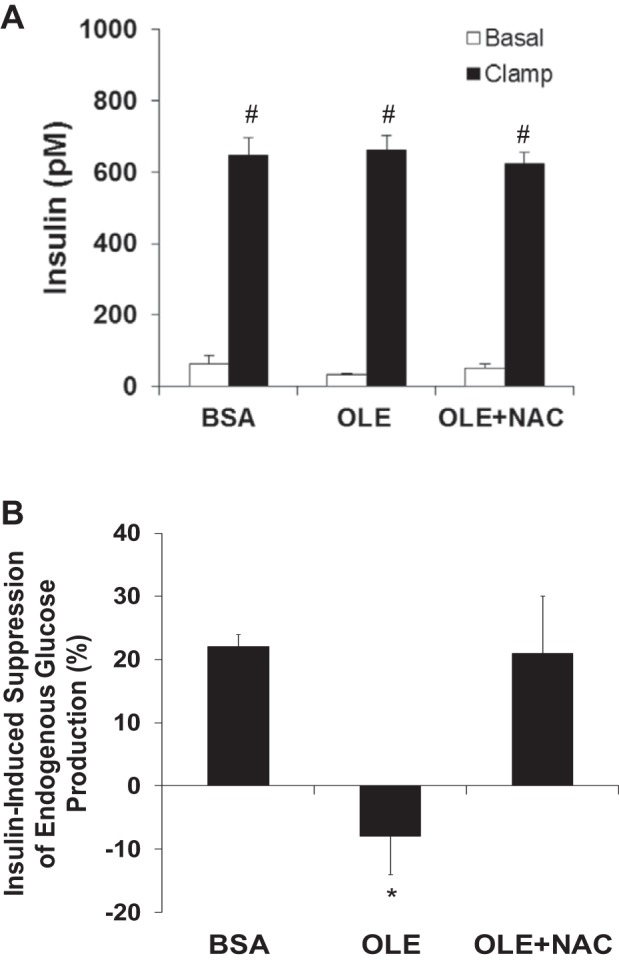
Effects of oleate and NAC on plasma insulin levels and suppression of EGP during the clamp (n = 5–6/group). A: plasma insulin levels were matched with full insulin dose insulin infusion in all groups; therefore, a half-dose insulin infusion was not performed. B: oleate infusion decreased insulin-induced suppression of EGP, which was prevented by NAC coinfusion. Data are means ± SE. BSA, bovine serum albumin (vehicle for oleate); OLE, oleate. Basal, 30 min before 2-h hyperinsulinemic euglycemic clamp; Clamp, last 30 min of 2-h hyperinsulinemic euglycemic clamp. *P < 0.05 vs. other treatment groups; #P < 0.001 Clamp vs. Basal.
Table 3.
Plasma levels of metabolic parameters, GIR, EGP, and GU in the basal period and during 2-h hyperinsulinemic-euglycemic clamp
| Basal |
Clamp |
|||||
|---|---|---|---|---|---|---|
| BSA | OLE | OLE+NAC | BSA | OLE | OLE+NAC | |
| Glucose, mM | 6.9 ± 0.3 | 6.6 ± 0.5 | 6.5 ± 0.2 | 6.6 ± 0.1 | 6.1 ± 0.2 | 6.5 ± 0.2 |
| GIR, μmol·kg−1·min−1 | 137 ± 7 | 101 ± 8* | 138 ± 5 | |||
| EGP, μmol·kg−1·min−1 | 46.7 ± 2.4 | 50.0 ± 3.2 | 57.3 ± 2.8 | 36.7 ± 2.8 | 54.4 ± 5.1* | 45.0 ± 4.7 |
| GU, μmol·kg−1·min−1 | 47.7 ± 2.5 | 52.0 ± 3.5 | 57.6 ± 2.7 | 174.7 ± 7.8 | 154.8 ± 10.6* | 181.5 ± 3.8 |
Data are means ± SE (n = 5–6/group) and for the basal period refer to the 30 min before the clamp, while for the clamp, data refer to the last 30 min of each experiment.
BSA, bovine serum albumin (vehicle control for oleate); OLE, oleate; EGP, endogenous glucose production; GU, glucose utilization.
P < 0.05 vs. other treatment groups.
PKCδ Plays a Causal Role in IH-Induced Hepatic Insulin Resistance, Likely Downstream of Oxidative Stress
To confirm that IH infusion induced oxidative stress specifically in the liver and that this was prevented by NAC, hepatic protein carbonyl content was assessed as a marker of oxidative stress (51). IH elevated hepatic protein carbonyl content twofold, and coinfusion of NAC completely prevented this effect (Fig. 4A). NAC alone had no effect.
Fig. 4.
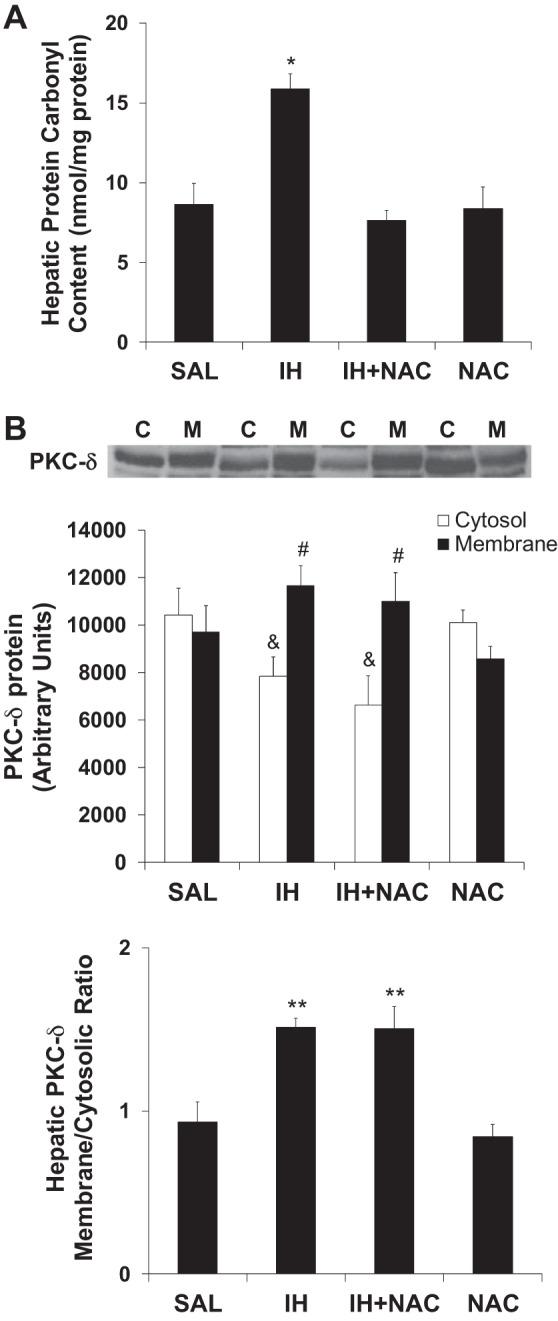
Effects of IH and NAC on hepatic protein carbonyl content and hepatic PKCδ (n = 6–9/group). A: NAC coinfusion prevented IH-induced increase in hepatic protein carbonyl levels. NAC alone did not have any effect. B: Both IH and IH plus NAC treatments decreased cytosolic and increased membrane levels of PKCδ protein. IH infusion increased the membrane to cytosolic ratio of hepatic PKCδ, indicating increased membrane translocation. IH-induced PKCδ membrane translocation was not affected by NAC coinfusion. Liver samples assayed were collected at the end of the basal infusions. Data are mean ± SE. C: Cytosol; M: Membrane. SAL: Saline. IH: Intralipid plus heparin. NAC: N-acetyl-l-cysteine. *P < 0.01 vs. other treatment groups. #P < 0.05 Membrane vs. Cytosol. &P < 0.05 vs. SAL and NAC. **P < 0.01 vs. SAL and NAC.
IH infusion decreased cytosolic PKCδ and increased membrane PKCδ content (Fig. 4B) in the liver, indicating PKCδ membrane translocation and, therefore, PKCδ activation. However, NAC did not prevent IH-induced PKCδ membrane translocation, indicating that oxidative stress was likely not involved in this process. PKCδ activation in response to oxidative stress is associated with Tyr311 phosphorylation (30); however, we found no change in PKCδ Tyr311 phosphorylation in response to IH or NAC infusion (SAL = 100 ± 10.4 vs. IH = 95.7 ± 9.7 vs. IH + NAC = 97.0 ± 12.1 vs. NAC = 108.5 ± 17.1%, means ± SE). Together, these findings argue against the involvement of oxidative stress in IH-induced PKCδ activation.
Other than oxidative stress, lipid metabolites such as LCFA-CoA and DAG can activate PKC during lipid infusion. Under our experimental conditions, IH did not significantly increase the hepatic content of ceramide or LCFA-CoA (ceramide: SAL = 14 ± 1.1 vs. IH = 15.4 ± 2.0 pmol/nmol total phospholipids; LCFA-CoA: SAL = 31 ± 5.0 vs. IH = 27 ± 3.0 pmol/mg tissue; means ± SE). In contrast, the hepatic levels of DAG and TG were increased by IH and were not normalized by NAC (Table 2).
To assess whether PKCδ plays a causal role in FFA-induced hepatic insulin resistance, we utilized an antisense oligonucleotide to specifically inhibit PKCδ (PKCδ ASO) and a control ASO (CON ASO). PKCδ ASO resulted in an ∼50% reduction in cytosolic PKCδ protein levels without affecting membrane PKCδ levels in the liver (Fig. 5A). Hepatic PKCε protein expression was not affected by PKCδ ASO (Fig. 5B).
Fig. 5.

Effects of IH and antisense oligonucleotide specific against PKCδ (PKCδ ASO) and control antisense oligonucleotide (CON ASO) on PKCδ and PKCε membrane translocation as well as insulin-induced suppression of EGP and effects of IH and apocynin (APO) on insulin-induced suppression of EGP (n = 5–6/group). A: PKCδ ASO treatment reduced cytosolic PKCδ protein levels by ∼50%. Moreover, PKCδ ASO prevented IH-induced membrane translocation of PKCδ. B: PKCδ ASO treatment did not result in decreased PKCε protein levels, and IH infusion did not cause PKCε membrane translocation. C: PKCδ ASO treatment completely prevented the decrease in insulin-induced suppression of EGP caused by IH infusion. Insulin-induced suppression of EGP was measured during the last 30 min of the hyperinsulinemic clamp. D: IH infusion increased Ser345 phosphorylated p47phox (p47phox is a subunit of NADPH oxidase) in hepatic membrane, which was prevented by PKCδ ASO treatment. Note: we could not reprobe for total p47phox or actin. E: apocynin coinfusion prevented the effect of IH to decrease insulin-induced suppression of EGP. Data are means ± SE. *P < 0.001 Membrane vs. Cytosolic PKCδ; **P < 0.01 vs. CON ASO + SAL; #P < 0.01 vs. CON ASO + SAL; &P < 0.001 Membrane vs. Cytosolic PKCε; †P < 0.05 vs. CON ASO + SAL; ‡P < 0.01 vs. other treatment groups.
PKCδ membrane-to-cytosolic ratio in the CON ASO + SAL group was less than that of the SAL group in the NAC study (Fig. 4); thus, we cannot exclude a nonspecific effect of CON ASO. Nevertheless, only PKCδ ASO, and not CON ASO, prevented IH-induced PKCδ membrane translocation. This was indicated by the increase in membrane PKCδ in response to IH in the rats that received CON ASO, whereas in the rats treated with PKCδ ASO we observed no increase in membrane PKCδ (Fig. 5A). PKCε did not translocate from the cytosol to the membrane in response to IH in either group (Fig. 5B).
IH-induced hepatic insulin resistance was prevented by PKCδ ASO (Fig. 5C). Peripheral insulin sensitivity was not affected by PKCδ ASO, as expected, likely due to preferential uptake of ASO by the liver (49), as shown by similar GU during the clamp in both IH-infused CON ASO and PKCδ ASO groups (CON ASO: SAL = 184.3 ± 5.2, IH = 118.1 ± 19.1; PKCδ ASO: SAL = 181.6 ± 6.1, IH = 109.4 ± 26.3 μmol·kg−1·min−1, means ± SE; P < 0.01 IH vs. SAL in both CON ASO and PKCδ ASO groups).
PKCδ ASO also prevented the IH-induced increase in hepatic membrane Ser345-phosphorylated p47phox (Fig. 5D), which is a marker of NADPH oxidase activation (12). Furthermore, apocynin (APO), an inhibitor of NADPH oxidase, prevented IH-induced impairment of suppression of EGP (Fig. 5E). APO also prevented IH from decreasing peripheral GU (GU during the clamp; SAL = 184.6 ± 14.0, IH = 125.2 ± 7.1, IH + APO = 172.4 ± 9.8, APO = 189.5 ± 4.8 μmol·kg−1·min−1, means ± SE; P < 0.01 for both SAL vs. IH and IH vs. IH + APO). This suggests that NADPH oxidase-derived superoxide plays a causal role in hepatic and peripheral insulin resistance.
Interestingly, and for unclear reasons that may relate to lower FFA-releasing property of the new heparins, in both the PKCδ ASO and the apocynin studies that were performed after the NAC study, FFA levels achieved with IH (∼1.2 mM) were lower than in the NAC study and comparable to those achieved with oleate. Similar to the results obtained in the oleate study, insulin levels were not significantly different, with the same rate of insulin infusion in all groups, and basal EGP was not significantly elevated by IH.
NAC Prevents IH-Induced Impairments of Hepatic Insulin Sensitivity and Insulin Clearance
IH significantly decreased IκBα content, which reflects phosphorylation and degradation of IκBα by activated IKKβ (7). The IH-induced decrease in hepatic IκBα content was prevented by NAC (Fig. 6A). Additionally, IH increased JNK phosphorylation (a marker of its activation), which was also prevented by NAC (Fig. 6B).
Fig. 6.

Effects of IH and NAC on IκBα content, JNK phosphorylation, and serine phosphorylation of IRS in liver tissue (n = 7–10/group). A: IH infusion decreased hepatic IκBα levels, which were restored to control levels by NAC coinfusion. B: IH infusion increased Thr183/Tyr185 phosphorylation of JNK, which was prevented by NAC coinfusion. C: IH infusion increased Ser307-phosphorylated IRS-1, which was prevented by NAC coinfusion. Total IRS-1 was not different among treatments. D: IH infusion increased Ser233-phosphorylated IRS-2, which was prevented by NAC coinfusion. Total IRS-2 was not different among treatments. Liver samples assayed were collected at the end of the basal infusions. Data are means ± SE. *P < 0.05 vs. other treatment groups; #P < 0.01 vs. other treatment groups.
IKKβ and/or JNK activation cause insulin resistance via serine phosphorylation of IRS-1 and IRS-2 (1, 19). Phosphorylation of Ser307 and Ser233 on IRS-1 and IRS-2, respectively, was increased by IH and this was prevented by coinfusion with NAC (Fig. 6, C and D). There was no change in total protein content of hepatic IRS-1 or IRS-2 in this model. Furthermore, NAC coinfusion protected against the decrease in insulin-stimulated tyrosine phosphorylation of IRS-1 and IRS-2 (Fig. 7, A and B), as well as Ser473 phosphorylation of Akt (Fig. 7C), in the liver of rats undergoing IH infusion.
Fig. 7.
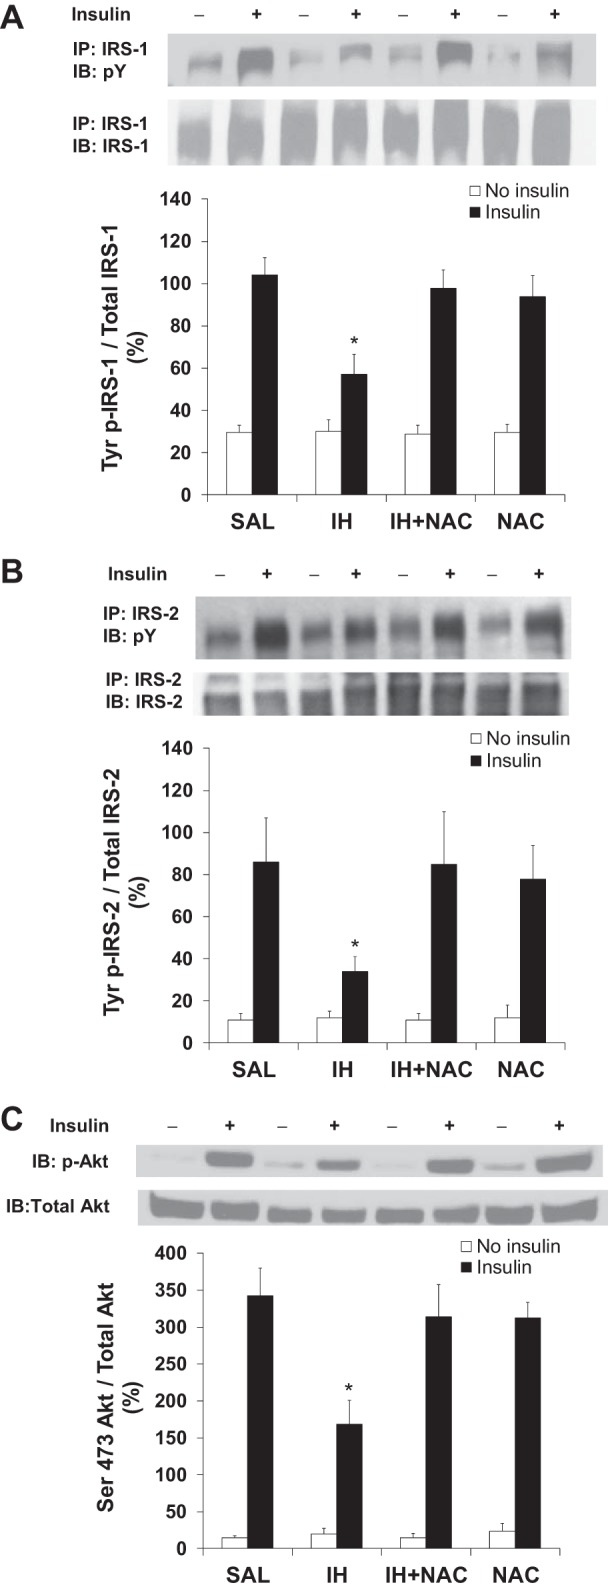
Effects of IH and NAC on insulin-induced tyrosine phosphorylation of IRS and serine phosphorylation of Akt. A: IH infusion decreased insulin-induced tyrosine phosphorylation of IRS-1, which was prevented by NAC coinfusion (n = 7–9/group). B: IH infusion decreased insulin-induced tyrosine phosphorylation of IRS-2, which was prevented by NAC coinfusion (n = 6–8/group). C: IH infusion decreased insulin-induced Ser473 phosphorylation of Akt, which was prevented by NAC coinfusion (n = 7–9/group). Rats received intraportal injection of saline or insulin (2 U/kg in all groups) under anesthesia after the infusion period. Data are means ± SE. IB, immunoblot; IP, immunoprecipitation; p-Tyr, phosphotyrosine. *P < 0.05 vs. other treatment groups.
Although tyrosine phosphorylation of IRS is critical for insulin action in peripheral tissues and in the liver, it is not directly involved in hepatic insulin clearance, whereas tyrosine phosphorylation of insulin receptor is the first committed step in both hepatic insulin action and clearance. Insulin receptor phosphorylation mediates internalization of the insulin-insulin receptor complex. It also causes the phosphorylation of CEACAM1, which contributes to insulin-insulin receptor endocytosis to increase the cellular transport and clearance of insulin (11, 45). Since in the NAC study IH decreased insulin clearance in accord with our previous studies in rats (32), dogs (54), and humans (9), we measured tyrosine phosphorylation of insulin receptor and CEACAM1 at the end of the clamp in the SAL, IH (full-insulin dose), and IH+NAC liver samples. As Fig. 8 illustrates, IH infusion decreased tyrosine phosphorylation of both insulin receptor and CEACAM1. This effect was partially prevented by NAC coinfusion. IH also decreased CEACAM1 levels, and this effect was completely prevented by NAC.
Fig. 8.

Effect of IH and NAC on signaling molecules involved in hepatic insulin clearance (n = 4–5/group). A: IH infusion decreased tyrosine phosphorylation of insulin receptor (IR), which was partially prevented by NAC coinfusion. B: IH infusion markedly decreased phosphorylated carcinoembryonic antigen-related cell adhesion molecule (CEACAM)1, which was partially prevented by NAC coinfusion. IH infusion also decreased hepatic CEACAM1 content, which was totally prevented by NAC coinfusion. Samples were collected at the end of the hyperinsulinemic clamp (insulin infusion rate 5 mU·kg−1·min−1 in all groups). Data are means ± SE. ReIB, reprobed immunoblot; α, anti. *P < 0.05 vs. SAL, **P < 0.01 vs. SAL, ***P < 0.001 vs. SAL; #P < 0.05 vs. IH; &P < 0.01 vs. IH.
DISCUSSION
We herein demonstrate that NAC and the NADPH oxidase inhibitor prevent FFA-induced hepatic and peripheral insulin resistance and that antisense oligonucleotide against PKCδ prevents FFA-induced hepatic insulin resistance. From liver tissue analysis, a pathway that emerged sequentially involves FFA, PKCδ, NADPH oxidase and oxidative stress, and IKKβ/JNK, leading to impaired hepatic insulin signaling.
Oxidative Stress Is a Causal Factor in FFA-Induced Insulin Resistance
During the basal state, IH infusion increased EGP despite increased plasma insulin and glucose. Studies in humans (48) and in 5-h-fasted rats (31) show that IH infusion increases gluconeogenesis but does not affect EGP under basal conditions due to an autoregulatory decrease in glycogenolysis. However, hepatic autoregulation was likely abolished during IH infusion due to the marked extent of plasma FFA elevation. Plasma FFA elevation was less with oleate than with IH infusion, and with oleate peripheral and hepatic insulin resistance was induced similarly to IH but basal EGP was not increased. Interestingly, plasma insulin levels were matched by full-dose insulin, which suggests that both FFA-induced changes in basal EGP and those in insulin clearance require a greater extent of elevation in circulating FFA than the changes in insulin sensitivity. That the extent of FFA elevation rather than the caloric load of IH may be responsible for the observed differences between the oleate-NAC and the IH-NAC studies is suggested by the results obtained in the PKCδ ASO and APO studies, where at similar FFA elevation to the oleate study basal EGP and insulin clearance were not significantly affected by IH. However, we cannot exclude the possibility that other factors contributed to these differences, including changes in the standard chow diet in our facility or in the animal supplier facility that occurred over time.
Irrespective of the differences in basal EGP and insulin clearance, direct infusion of oleate induced hepatic and peripheral insulin resistance as IH did, and NAC, added to either IH or oleate, prevented hepatic and peripheral insulin resistance. The observed insulin resistance with oleate is presumably attributable to FFA itself rather than to the caloric load, as the caloric load of the oleate infusion is negligible.
In the present study, similarly to NAC, the NADPH oxidase inhibitor APO also prevented IH-induced peripheral and hepatic insulin resistance. Our findings are in accord with data in HepG2 cells, which showed that NADPH oxidase-derived ROS were associated with palmitate-induced insulin resistance (17). However, a role for mitochondrial ROS has also been postulated based on in vitro data (41).
The relationship between oxidative stress and insulin sensitivity is complex. First, solid in vitro and animal studies have linked oxidative stress with insulin resistance of obesity and diabetes (2, 26), and a few studies have demonstrated that antioxidants improve insulin action in humans (8, 47), but human studies are characterized by heterogeneous populations (16) and different routes of antioxidant administration. Intravenous glutathione partially prevented IH-induced insulin resistance in humans, although tracer studies were not performed to separately assess hepatic and peripheral insulin sensitivity (43). We have also shown that oral taurine, but not NAC, which has extensive first-pass hepatic metabolism, partially prevents IH-induced whole body insulin resistance in humans (56). However, oral NAC improved insulin clearance, suggesting that it was likely effective in the liver. Although it has been reported that the improvement in whole body insulin sensitivity induced by intravenous reduced glutathione is accompanied by an improvement in circulating markers of oxidative stress in patients with T2DM (13), others found that oral vitamin C does not ameliorate whole body insulin sensitivity in T2DM, possibly because plasma levels of vitamin C were not normalized by the treatment (10). Likewise, oral vitamin E has failed to prevent T2DM (35). Intravenous NAC prevented insulin resistance induced by lipid infusion in rat skeletal muscle (4), but hepatic insulin resistance was not assessed. Second, although Ristow et al. (46) found that in healthy individuals vitamins C plus E block exercise-stimulated elevation in whole body insulin sensitivity, it was subsequently reported that this antioxidant combination does not impair the ability of exercise to augment insulin sensitivity (57). Third, ROS have been found to promote insulin action, but this effect is localized to the periphery and not the liver (36). It has been suggested that the nature of the relationship between oxidative stress and insulin sensitivity rests on the duration as well as the magnitude of oxidative stress (36). Herein, we show that in the liver elevations in markers of oxidative stress are accompanied by impaired insulin signaling and not improved insulin action. Therefore, we propose that this magnitude and duration of FFA-induced oxidative stress causes hepatic insulin resistance.
PKCδ Is a Link Between FFA and Oxidative Stress in Hepatic Insulin Resistance via NADPH Oxidase
PKCδ activation can induce hepatic insulin resistance (6); however, whether PKCδ mediates hepatic insulin resistance induced selectively by fat has not been explored. PKCδ may directly phosphorylate IRS-1 on serine/threonine residues, thereby diminishing its tyrosine phosphorylation (23, 28), although it has not been reported to directly phosphorylate IRS-1 on Ser307 (equivalent to Ser312 in humans). Alternatively, PKCδ may activate other serine/threonine kinases that phosphorylate Ser307, such as IKKβ and JNK (20), either directly (21, 37) or indirectly via oxidative stress (18, 27). In the present study, NAC, which prevented IH-induced increase in protein carbonyl content, a marker of oxidative stress, completely abolished IH-induced hepatic insulin resistance without affecting PKCδ membrane translocation. This suggests that PKCδ translocation occurs upstream of or is unrelated to oxidative stress. Our findings that IH did not increase Tyr311-phosphorylated PKCδ, which may be increased by ROS (30), suggest that PKCδ activation does not occur downstream of oxidative stress in our model. Irrespectively of how activated, PKCδ is causal in IH-induced hepatic insulin resistance, as indicated by our finding that this was abolished by PKCδ ASO. In contrast, PKCε, which mediated hepatic insulin resistance caused by 3 days of high-fat diet (49), was not translocated by 7-h lipid infusion.
Accumulation of intracellular lipid metabolites, such as DAG and LCFA-CoA, is associated with PKC activation (7, 58). However, hepatic content of LCFA-CoA or ceramide was not significantly increased by IH in our model. In accord with other reports (7), DAG and TG contents were increased by IH, albeit modestly, and, as expected, the increase was not prevented by NAC. It is possible that these metabolites were elevated to a greater extent before the 7-h point, as it has been shown that intracellular fat levels peak earlier, at least in skeletal muscle (58). It is also possible that PKC activation occurs mainly via Toll-like receptors (TLR) and only partly via intracellular lipid metabolites. In this respect, it has been demonstrated that FFA activate IKKβ and cause insulin resistance in vivo via TLR4 (50), which can activate PKCδ (29).
PKC activation can increase ROS via PKC-dependent activation of NADPH oxidase (53). IH increased the membrane content of Ser345-phosphorylated NADPH oxidase subunit p47phox, a marker of NADPH oxidase activation (12), which was abolished by PKCδ ASO. Our finding that apocynin, which inhibits NADPH oxidase, prevents IH-induced hepatic and peripheral insulin resistance suggests a causal role of NADPH oxidase-derived ROS.
Proinflammatory and Stress-Activated Pathways Are Downstream Mediators of FFA-Induced Impairment of Hepatic Insulin Signaling
Potential mediators of FFA-induced hepatic insulin resistance downstream of oxidative stress include IKKβ and JNK. Consistent with previous reports that ROS activates IKKβ (27), NAC abolished the IH-induced decrease in hepatic IκBα content, suggesting that IKKβ is implicated in the pathway mediating FFA-induced hepatic insulin resistance downstream of oxidative stress. Similar to IKKβ, JNK phosphorylates IRS on serine residues (1). In the present study, NAC prevented IH-induced phosphorylation of JNK, suggesting that lipid infusion results in activation of JNK via oxidative stress. NAC also prevented the IH-induced increase in serine phosphorylation of IRS-1 and IRS-2, the decrease in their tyrosine phosphorylation, and the IH-induced decrease in serine phosphorylation of Akt.
In addition to normalizing insulin-induced EGP suppression, NAC normalized basal EGP, which may have resulted from the fact that NAC prevented the IH-induced insulin resistance without affecting the IH-induced increase in insulin levels. The latter finding was expected, since FFA acutely increase insulin secretion independently of oxidative stress. Unexpectedly, however, NAC also appeared to abolish the FFA-induced decrease in insulin clearance. Further studies are required to determine the exact mechanisms for this effect of NAC. Complete prevention of the IH-induced decrease in the hepatic content of CEACAM1, which promotes insulin removal in liver (14), and partial prevention of the IH-induced decrease in tyrosine phosphorylation of both insulin receptor and CEACAM1, could contribute to the effect of NAC. Preservation of CEACAM1 expression level by NAC may be explained by improvement of hepatic insulin action, as insulin is known to increase the promoter activity of the CEACAM1 gene (40). Partial prevention of the decrease in the tyrosine phosphorylation of the insulin receptor and CEACAM1, which is a substrate of the insulin receptor kinase, may imply that NAC improves insulin signaling at sites other than IRS, perhaps by affecting IH-induced serine phosphorylation of the insulin receptor.
In conclusion, we have demonstrated that antioxidant treatment (both NAC and apocynin) prevents FFA-induced hepatic and peripheral insulin resistance. We have also provided evidence that PKCδ knockdown prevents FFA-induced hepatic insulin resistance. Furthermore, we have shown that activation of IKKβ and JNK is downstream whereas PKCδ activation is likely upstream of oxidative stress. Hence, we propose the following sequence of events leading to FFA-induced hepatic insulin resistance: FFA, via activation of PKCδ and NADPH oxidase, induce oxidative stress, which leads to IKKβ- and JNK-mediated serine phosphorylation of IRS-1 and IRS-2, and subsequent impairment of hepatic insulin signaling.
GRANTS
This study was funded by research grants to A. Giacca from the Canadian Diabetes Association (GA-02062131-AG) and the Canadian Institutes of Health Research (CIHR; MOP-89929). Partial support was provided by grants to A. Giacca from the Heart and Stroke Foundation of Canada, to I. G. Fantus from CIHR (MOP-38009), to D. N. Brindley from CIHR (MOP-81137), to R. Gutierrez-Juarez from the National Institute of Diabetes and Digestive and Kidney Diseases (DK-45024), and to S. M. Najjar from the National Institutes of Health (DK-054254, DK-083850, and HL-112248), and the US Department of Agriculture (USDA 38903-02315). P. Han and D. Li were supported in part by a CIHR New Emerging Team Grant (NET-54012) to I. G. Fantus. S. Pereira was supported by a Canada Graduate Scholarships Doctoral Award from CIHR, an Ontario Graduate Scholarship, and a Banting and Best Diabetes Centre/Novo Nordisk Studentship.
DISCLOSURES
S. Bhanot owns stocks/holds stock options in ISIS Pharmaceuticals.
AUTHOR CONTRIBUTIONS
Author contributions: S.P., E.P., Y.M., C.A.H., P.H., T.U., L.S., A.I.O., K.K., A.I., Z.Y., D.L., T.A.B., and J.D. performed experiments; S.P., E.P., Y.M., C.A.H., P.H., T.U., L.S., A.I.O., K.K., A.I., Z.Y., D.L., T.A.B., and J.D. analyzed data; S.P., E.P., Y.M., and A.G. interpreted results of experiments; S.P., E.P., and Y.M. prepared figures; S.P., E.P., Y.M., C.A.H., P.H., and T.U. drafted manuscript; S.P., E.P., Y.M., L.S., A.I.O., K.K., Z.Y., D.L., T.A.B., J.D., J.E.-B., D.N.B., R.G.-J., T.K.L., S.M.N., R.A.M., S.B., I.G.F., and A.G. edited and revised manuscript; S.P., E.P., Y.M., C.A.H., P.H., T.U., L.S., A.I.O., K.K., A.I., Z.Y., D.L., T.A.B., J.D., J.E.-B., D.N.B., R.G.-J., T.K.L., S.M.N., R.A.M., S.B., I.G.F., and A.G. approved final version of manuscript; J.E.-B., D.N.B., R.G.-J., T.K.L., S.M.N., R.A.M., S.B., I.G.F., and A.G. conceived and designed research.
ACKNOWLEDGMENTS
We thank Elena Burdett, Loretta Lam, Clive Baveghems, Wen Qin Yu, Danna M. Breen, and Christine Tang for excellent technical support.
REFERENCES
- 1.Aguirre V, Uchida T, Yenush L, Davis R, White MF. The c-Jun NH(2)-terminal kinase promotes insulin resistance during association with insulin receptor substrate-1 and phosphorylation of Ser(307). J Biol Chem 275: 9047–9054, 2000 [DOI] [PubMed] [Google Scholar]
- 2.Anderson EJ, Lustig ME, Boyle KE, Woodlief TL, Kane DA, Lin CT, Price JW, 3rd, Kang L, Rabinovitch PS, Szeto HH, Houmard JA, Cortright RN, Wasserman DH, Neufer PD. Mitochondrial H2O2 emission and cellular redox state link excess fat intake to insulin resistance in both rodents and humans. J Clin Invest 119: 573–581, 2009 [DOI] [PMC free article] [PubMed] [Google Scholar]
- 3.Baldeweg SE, Golay A, Natali A, Balkau B, Del Prato S, Coppack SW. Insulin resistance, lipid and fatty acid concentrations in 867 healthy Europeans. European Group for the Study of Insulin Resistance (EGIR). Eur J Clin Invest 30: 45–52, 2000 [DOI] [PubMed] [Google Scholar]
- 4.Barazzoni R, Zanetti M, Gortan CG, Semolic A, Boschelle M, Codarin E, Pirulli A, Cattin L, Guarnieri G. Fatty acids acutely enhance insulin-induced oxidative stress and cause insulin resistance by increasing mitochondrial reactive oxygen species (ROS) generation and nuclear factor-kB inhibitor (IkB)-nuclear factor-kB (NFkB) activation in rat muscle, in the absence of mitochondrial dysfunction. Diabetologia 55: 773–782, 2012 [DOI] [PubMed] [Google Scholar]
- 5.Bezman-Tarcher A. Method for continuous intravenous infusion of large amounts of oleic acid into rats. J Lipid Res 10: 197–206, 1969 [PubMed] [Google Scholar]
- 6.Bezy O, Tran TT, Pihlajamaki J, Suzuki R, Emanuelli B, Winnay J, Mori MA, Haas J, Biddinger SB, Leitges M, Goldfine AB, Patti ME, King GL, Kahn CR. PKCdelta regulates hepatic insulin sensitivity and hepatosteatosis in mice and humans. J Clin Invest 121: 2504–2517, 2011 [DOI] [PMC free article] [PubMed] [Google Scholar]
- 7.Boden G, She P, Mozzoli M, Cheung P, Gumireddy K, Reddy P, Xiang X, Luo Z, Ruderman N. Free fatty acids produce insulin resistance and activate the proinflammatory nuclear factor-kappaB pathway in rat liver. Diabetes 54: 3458–3465, 2005 [DOI] [PubMed] [Google Scholar]
- 8.Caballero B. Vitamin E improves the action of insulin. Nutr Rev 51: 339–340, 1993 [DOI] [PubMed] [Google Scholar]
- 9.Carpentier A, Mittelman SD, Bergman RN, Giacca A, Lewis GF. Prolonged elevation of plasma free fatty acids impairs pancreatic beta-cell function in obese nondiabetic humans but not in individuals with type 2 diabetes. Diabetes 49: 399–408, 2000 [DOI] [PubMed] [Google Scholar]
- 10.Chen H, Karne RJ, Hall G, Campia U, Panza JA, Cannon RO, III, Wang Y, Katz A, Levine M, Quon MJ. High-dose oral vitamin C partially replenishes vitamin C levels in patients with Type 2 diabetes and low vitamin C levels but does not improve endothelial dysfunction or insulin resistance. Am J Physiol Heart Circ Physiol 290: H137–H145, 2006 [DOI] [PubMed] [Google Scholar]
- 11.Choice CV, Howard MJ, Poy MN, Hankin MH, Najjar SM. Insulin stimulates pp120 endocytosis in cells co-expressing insulin receptors. J Biol Chem 273: 22194–22200, 1998 [DOI] [PubMed] [Google Scholar]
- 12.Dang PM, Stensballe A, Boussetta T, Raad H, Dewas C, Kroviarski Y, Hayem G, Jensen ON, Gougerot-Pocidalo MA, El Benna J. A specific p47phox-serine phosphorylated by convergent MAPKs mediates neutrophil NADPH oxidase priming at inflammatory sites. J Clin Invest 116: 2033–2043, 2006 [DOI] [PMC free article] [PubMed] [Google Scholar]
- 13.De MG, Bravi MC, Laurenti O, Cassone-Faldetta M, Armiento A, Ferri C, Balsano F. Influence of reduced glutathione infusion on glucose metabolism in patients with non-insulin-dependent diabetes mellitus. Metab Clin Exper 47: 993–997, 1998 [DOI] [PubMed] [Google Scholar]
- 14.DeAngelis AM, Heinrich G, Dai T, Bowman TA, Patel PR, Lee SJ, Hong EG, Jung DY, Assmann A, Kulkarni RN, Kim JK, Najjar SM. Carcinoembryonic antigen-related cell adhesion molecule 1: a link between insulin and lipid metabolism. Diabetes 57: 2296–2303, 2008 [DOI] [PMC free article] [PubMed] [Google Scholar]
- 15.Finegood DT, Bergman RN, Vranic M. Estimation of endogenous glucose production during hyperinsulinemic-euglycemic glucose clamps. Comparison of unlabeled and labeled exogenous glucose infusates. Diabetes 36: 914–924, 1987 [DOI] [PubMed] [Google Scholar]
- 16.Fisher G, Alvarez JA, Ellis AC, Granger WM, Ovalle F, Man CD, Cobelli C, Gower BA. Race differences in the effect of oxidative stress on insulin sensitivity. Obesity 20: 972–977, 2012 [DOI] [PMC free article] [PubMed] [Google Scholar]
- 17.Gao D, Nong S, Huang X, Lu Y, Zhao H, Lin Y, Man Y, Wang S, Yang J, Li J. The effects of palmitate on hepatic insulin resistance are mediated by NADPH oxidase 3-derived reactive oxygen species through JNK and p38MAPK pathways. J Biol Chem 285: 29965–29973, 2010 [DOI] [PMC free article] [PubMed] [Google Scholar]
- 18.Gao J, Wu D, Guo TB, Ruan Q, Li T, Lu Z, Xu M, Dai W, Lu L. K(+) channel activity and redox status are differentially required for JNK activation by UV and reactive oxygen species. Exp Cell Res 297: 461–471, 2004 [DOI] [PubMed] [Google Scholar]
- 19.Gao Z, Hwang D, Bataille F, Lefevre M, York D, Quon MJ, Ye J. Serine phosphorylation of insulin receptor substrate 1 by inhibitor kappa B kinase complex. J Biol Chem 277: 48115–48121, 2002 [DOI] [PubMed] [Google Scholar]
- 20.Gao Z, Zhang X, Zuberi A, Hwang D, Quon MJ, Lefevre M, Ye J. Inhibition of insulin sensitivity by free fatty acids requires activation of multiple serine kinases in 3T3-L1 adipocytes. Mol Endocrinol 18: 2024–2034, 2004 [DOI] [PubMed] [Google Scholar]
- 21.Ghosh S, Baltimore D. Activation in vitro of NF-kappa B by phosphorylation of its inhibitor I kappa B. Nature 344: 678–682, 1990 [DOI] [PubMed] [Google Scholar]
- 22.Graham MJ, Crooke ST, Monteith DK, Cooper SR, Lemonidis KM, Stecker KK, Martin MJ, Crooke RM. In vivo distribution and metabolism of a phosphorothioate oligonucleotide within rat liver after intravenous administration. J Pharmacol Exp Ther 286: 447–458, 1998 [PubMed] [Google Scholar]
- 23.Greene MW, Ruhoff MS, Roth RA, Kim JA, Quon MJ, Krause JA. PKCdelta-mediated IRS-1 Ser24 phosphorylation negatively regulates IRS-1 function. Biochem Biophys Res Commun 349: 976–986, 2006 [DOI] [PubMed] [Google Scholar]
- 24.Haber CA, Lam TK, Yu Z, Gupta N, Goh T, Bogdanovic E, Giacca A, Fantus IG. N-acetylcysteine and taurine prevent hyperglycemia-induced insulin resistance in vivo: possible role of oxidative stress. Am J Physiol Endocrinol Metab 285: E744–E753, 2003 [DOI] [PubMed] [Google Scholar]
- 25.Hirosumi J, Tuncman G, Chang L, Gorgun CZ, Uysal KT, Maeda K, Karin M, Hotamisligil GS. A central role for JNK in obesity and insulin resistance. Nature 420: 333–336, 2002 [DOI] [PubMed] [Google Scholar]
- 26.Houstis N, Rosen ED, Lander ES. Reactive oxygen species have a causal role in multiple forms of insulin resistance. Nature 440: 944–948, 2006 [DOI] [PubMed] [Google Scholar]
- 27.Kamata H, Manabe T, Oka S, Kamata K, Hirata H. Hydrogen peroxide activates IkappaB kinases through phosphorylation of serine residues in the activation loops. FEBS Lett 519: 231–237, 2002 [DOI] [PubMed] [Google Scholar]
- 28.Kellerer M, Mushack J, Seffer E, Mischak H, Ullrich A, Haring HU. Protein kinase C isoforms alpha, delta and theta require insulin receptor substrate-1 to inhibit the tyrosine kinase activity of the insulin receptor in human kidney embryonic cells (HEK 293 cells). Diabetologia 41: 833–838, 1998 [DOI] [PubMed] [Google Scholar]
- 29.Kim DC, Kim SH, Jeong MW, Baek NI, Kim KT. Effect of rottlerin, a PKC-delta inhibitor, on TLR-4-dependent activation of murine microglia. Biochem Biophys Res Commun 337: 110–115, 2005 [DOI] [PubMed] [Google Scholar]
- 30.Konishi H, Yamauchi E, Taniguchi H, Yamamoto T, Matsuzaki H, Takemura Y, Ohmae K, Kikkawa U, Nishizuka Y. Phosphorylation sites of protein kinase C delta in H2O2-treated cells and its activation by tyrosine kinase in vitro. Proc Natl Acad Sci USA 98: 6587–6592, 2001 [DOI] [PMC free article] [PubMed] [Google Scholar]
- 31.Lam TK, Pocai A, Gutierrez-Juarez R, Obici S, Bryan J, Aguilar-Bryan L, Schwartz GJ, Rossetti L. Hypothalamic sensing of circulating fatty acids is required for glucose homeostasis. Nat Med 11: 320–327, 2005 [DOI] [PubMed] [Google Scholar]
- 32.Lam TK, Yoshii H, Haber CA, Bogdanovic E, Lam L, Fantus IG, Giacca A. Free fatty acid-induced hepatic insulin resistance: a potential role for protein kinase C-δ. Am J Physiol Endocrinol Metab 283: E682–E691, 2002 [DOI] [PubMed] [Google Scholar]
- 33.Levine RL, Garland D, Oliver CN, Amici A, Climent I, Lenz AG, Ahn BW, Shaltiel S, Stadtman ER. Determination of carbonyl content in oxidatively modified proteins. Methods Enzymol 186: 464–478, 1990 [DOI] [PubMed] [Google Scholar]
- 34.Lewis GF, Carpentier A, Adeli K, Giacca A. Disordered fat storage and mobilization in the pathogenesis of insulin resistance and type 2 diabetes. Endocr Rev 23: 201–229, 2002 [DOI] [PubMed] [Google Scholar]
- 35.Liu S, Lee IM, Song Y, Van Denburgh M, Cook NR, Manson JE, Buring JE. Vitamin E and risk of type 2 diabetes in the women's health study randomized controlled trial. Diabetes 55: 2856–2862, 2006 [DOI] [PubMed] [Google Scholar]
- 36.Loh K, Deng H, Fukushima A, Cai X, Boivin B, Galic S, Bruce C, Shields BJ, Skiba B, Ooms LM, Stepto N, Wu B, Mitchell CA, Tonks NK, Watt MJ, Febbraio MA, Crack PJ, Andrikopoulos S, Tiganis T. Reactive oxygen species enhance insulin sensitivity. Cell Metab 10: 260–272, 2009 [DOI] [PMC free article] [PubMed] [Google Scholar]
- 37.Lopez-Bergami P, Ronai Z. Requirements for PKC-augmented JNK activation by MKK4/7. Int J Biochem Cell Biol 40: 1055–1064, 2008 [DOI] [PMC free article] [PubMed] [Google Scholar]
- 38.Martin A, Duffy PA, Liossis C, Gomez-Munoz A, O'Brien L, Stone JC, Brindley DN. Increased concentrations of phosphatidate, diacylglycerol and ceramide in ras- and tyrosine kinase (fps)-transformed fibroblasts. Oncogene 14: 1571–1580, 1997 [DOI] [PubMed] [Google Scholar]
- 39.Miles JM, Ellman MG, McClean KL, Jensen MD. Validation of a new method for determination of free fatty acid turnover. Am J Physiol Endocrinol Metab 252: E431–E438, 1987 [DOI] [PubMed] [Google Scholar]
- 40.Najjar SM, Boisclair YR, Nabih ZT, Philippe N, Imai Y, Suzuki Y, Suh DS, Ooi GT. Cloning and characterization of a functional promoter of the rat pp120 gene, encoding a substrate of the insulin receptor tyrosine kinase. J Biol Chem 271: 8809–8817, 1996 [DOI] [PubMed] [Google Scholar]
- 41.Nakamura S, Takamura T, Matsuzawa-Nagata N, Takayama H, Misu H, Noda H, Nabemoto S, Kurita S, Ota T, Ando H, Miyamoto K, Kaneko S. Palmitate induces insulin resistance in H4IIEC3 hepatocytes through reactive oxygen species produced by mitochondria. J Biol Chem 284: 14809–14818, 2009 [DOI] [PMC free article] [PubMed] [Google Scholar]
- 42.Oprescu AI, Bikopoulos G, Naassan A, Allister EM, Tang C, Park E, Uchino H, Lewis GF, Fantus IG, Rozakis-Adcock M, Wheeler MB, Giacca A. Free fatty acid-induced reduction in glucose-stimulated insulin secretion: evidence for a role of oxidative stress in vitro and in vivo. Diabetes 56: 2927–2937, 2007 [DOI] [PubMed] [Google Scholar]
- 43.Paolisso G, Gambardella A, Tagliamonte MR, Saccomanno F, Salvatore T, Gualdiero P, D'Onofrio MV, Howard BV. Does free fatty acid infusion impair insulin action also through an increase in oxidative stress? J Clin Endocrinol Metab 81: 4244–4248, 1996 [DOI] [PubMed] [Google Scholar]
- 44.Park E, Wong V, Guan X, Oprescu AI, Giacca A. Salicylate prevents hepatic insulin resistance caused by short-term elevation of free fatty acids in vivo. J Endocrinol 195: 323–331, 2007 [DOI] [PubMed] [Google Scholar]
- 45.Poy MN, Yang Y, Rezaei K, Fernstrom MA, Lee AD, Kido Y, Erickson SK, Najjar SM. CEACAM1 regulates insulin clearance in liver. Nat Genet 30: 270–276, 2002 [DOI] [PubMed] [Google Scholar]
- 46.Ristow M, Zarse K, Oberbach A, Kloting N, Birringer M, Kiehntopf M, Stumvoll M, Kahn CR, Bluher M. Antioxidants prevent health-promoting effects of physical exercise in humans. Proc Natl Acad Sci USA 106: 8665–8670, 2009 [DOI] [PMC free article] [PubMed] [Google Scholar]
- 47.Rizzo MR, Abbatecola AM, Barbieri M, Vietri MT, Cioffi M, Grella R, Molinari A, Forsey R, Powell J, Paolisso G. Evidence for anti-inflammatory effects of combined administration of vitamin E and C in older persons with impaired fasting glucose: impact on insulin action. J Am Coll Nutr 27: 505–511, 2008 [DOI] [PubMed] [Google Scholar]
- 48.Roden M, Stingl H, Chandramouli V, Schumann WC, Hofer A, Landau BR, Nowotny P, Waldhausl W, Shulman GI. Effects of free fatty acid elevation on postabsorptive endogenous glucose production and gluconeogenesis in humans. Diabetes 49: 701–707, 2000 [DOI] [PubMed] [Google Scholar]
- 49.Samuel VT, Liu ZX, Wang A, Beddow SA, Geisler JG, Kahn M, Zhang XM, Monia BP, Bhanot S, Shulman GI. Inhibition of protein kinase Cepsilon prevents hepatic insulin resistance in nonalcoholic fatty liver disease. J Clin Invest 117: 739–745, 2007 [DOI] [PMC free article] [PubMed] [Google Scholar]
- 50.Shi H, Kokoeva MV, Inouye K, Tzameli I, Yin H, Flier JS. TLR4 links innate immunity and fatty acid-induced insulin resistance. J Clin Invest 116: 3015–3025, 2006 [DOI] [PMC free article] [PubMed] [Google Scholar]
- 51.Stadtman ER, Levine RL. Protein oxidation. Ann NY Acad Sci 899: 191–208, 2000 [DOI] [PubMed] [Google Scholar]
- 52.Sun X, Wu F, Datta R, Kharbanda S, Kufe D. Interaction between protein kinase C delta and the c-Abl tyrosine kinase in the cellular response to oxidative stress. J Biol Chem 275: 7470–7473, 2000 [DOI] [PubMed] [Google Scholar]
- 53.Talior I, Tennenbaum T, Kuroki T, Eldar-Finkelman H. PKCδ-dependent activation of oxidative stress in adipocytes of obese and insulin-resistant mice: role for NADPH oxidase. Am J Physiol Endocrinol Metab 288: E405–E411, 2005 [DOI] [PubMed] [Google Scholar]
- 54.Wiesenthal SR, Sandhu H, McCall RH, Tchipashvili V, Yoshii H, Polonsky K, Shi ZQ, Lewis GF, Mari A, Giacca A. Free fatty acids impair hepatic insulin extraction in vivo. Diabetes 48: 766–774, 1999 [DOI] [PubMed] [Google Scholar]
- 55.Woldegiorgis G, Spennetta T, Corkey BE, Williamson JR, Shrago E. Extraction of tissue long-chain acyl-CoA esters and measurement by reverse-phase high-performance liquid chromatography. Anal Biochem 150: 8–12, 1985 [DOI] [PubMed] [Google Scholar]
- 56.Xiao C, Giacca A, Lewis GF. Oral taurine but not N-acetylcysteine ameliorates NEFA-induced impairment in insulin sensitivity and beta cell function in obese and overweight, non-diabetic men. Diabetologia 51: 139–146, 2008 [DOI] [PubMed] [Google Scholar]
- 57.Yfanti C, Nielsen AR, Akerstrom T, Nielsen S, Rose AJ, Richter EA, Lykkesfeldt J, Fischer CP, Pedersen BK. Effect of antioxidant supplementation on insulin sensitivity in response to endurance exercise training. Am J Physiol Endocrinol Metab 300: E761–E770, 2011 [DOI] [PubMed] [Google Scholar]
- 58.Yu C, Chen Y, Cline GW, Zhang D, Zong H, Wang Y, Bergeron R, Kim JK, Cushman SW, Cooney GJ, Atcheson B, White MF, Kraegen EW, Shulman GI. Mechanism by which fatty acids inhibit insulin activation of insulin receptor substrate-1 (IRS-1)-associated phosphatidylinositol 3-kinase activity in muscle. J Biol Chem 277: 50230–50236, 2002 [DOI] [PubMed] [Google Scholar]