Abstract
Using dual cell patch-clamp recording, we examined pericyte, endothelial, and myoendothelial cell-to-cell communication in descending vasa recta. Graded current injections into pericytes or endothelia yielded input resistances of 220 ± 21 and 128 ± 20 MΩ, respectively (P < 0.05). Injection of positive or negative current into an endothelial cell depolarized and hyperpolarized adjacent endothelial cells, respectively. Similarly, current injection into a pericyte depolarized and hyperpolarized adjacent pericytes. During myoendothelial studies, current injection into a pericyte or an endothelial cell yielded small, variable, but significant change of membrane potential in heterologous cells. Membrane potentials of paired pericytes or paired endothelia were highly correlated and identical. Paired measurements of resting potentials in heterologous cells were also correlated, but with slight hyperpolarization of the endothelium relative to the pericyte, −55.2 ± 1.8 vs. −52.9 ± 2.2 mV (P < 0.05). During dual recordings, angiotensin II or bradykinin stimulated temporally identical variations of pericyte and endothelial membrane potential. Similarly, voltage clamp depolarization of pericytes or endothelial cells induced parallel changes of membrane potential in the heterologous cell type. We conclude that the descending vasa recta endothelial syncytium is of lower resistance than the pericyte syncytium and that high-resistance myoendothelial coupling also exists. The myoendothelial communication between pericytes and endothelium maintains near identity of membrane potentials at rest and during agonist stimulation. Finally, endothelia membrane potential lies slightly below pericyte membrane potential, suggesting a tonic role for the former to hyperpolarize the latter and provide a brake on vasoconstriction.
Keywords: rat, kidney, medulla, microcirculation, electrophysiology, pericyte
descending vasa recta (DVR) are capillary-size arteriolar microvessels that supply blood flow to the renal medulla. The DVR wall is comprised of abluminal pericytes that have a contractile, smooth muscle phenotype. The lumen is lined by a continuous endothelium (34, 37). Pericytes express voltage-gated calcium channels (VGCC) the open probability of which is enhanced by depolarization (43, 56, 59). Inhibition L-type VGCC blocks pericyte calcium entry, DVR contraction, and may enhance renal medullary blood flow (24, 31, 50, 56, 58, 59). In turn, the membrane potential that governs pericyte VGCC is regulated by the balanced activity of calcium-activated chloride channels, several classes of K+ channels, and a hyperpolarizing influence of ouabain-sensitive electrogenic Na+, K+ exchange (4, 30, 33, 35). Based on this knowledge, we infer that pericyte membrane potential and VGCC regulate medullary perfusion to facilitate urinary concentration and guard against the hypoxia that results from countercurrent exchange (11, 16, 26, 38).
In recent communications, we showed that both pericytes and endothelia have syncytial properties. Voltage clamp-induced depolarization of a pericyte leads to rapid depolarization of adjacent pericytes. Similarly, endothelial depolarization is transmitted to adjacent endothelial cells. Spread of electrogenic signals can occur on a time scale that is less than a millisecond (53, 57, 58). The physiological role of transmission through cells of vessel walls has been frequently reviewed (5, 14, 22, 46). In general, such conducted responses are likely to spread the range of dilatory or contractile signals to enhance their effects on nutrient blood flow. This may be particularly important in DVR of the renal outer medulla where paracrine signals from nearby transporting epithelia may need to spread upstream toward the juxtamedullary cortex to dilate modulate vessels and preserve oxygenation. It is generally accepted that communication between cells of the vessel wall can limit contraction through effects of endothelium-dependent hyperpolarizing factors such as epoxyeicosatrienoic acids and K+ ion (8, 17). Another important route may involve direct electrical coupling between cells of the vessel wall. By that theory, endothelial and myoendothelial conduction may transmit hyperpolarizing current to smooth muscle cells via homologous and myoendothelial gap junctions (7, 29, 45).
In the present study, we exploited two techniques to systematically test pericyte-to-pericyte, endothelial-to-endothelial, and pericyte-to-endothelial (i.e., myoendothelial) coupling in the DVR wall. We fully or partially removed pericytes from DVR to expose the underlying endothelium and gain access for endothelial and myoendothelial recording (43, 57). Dual electrode patch clamp permitted generation of a signal at one cell, by either voltage clamp or current injection, with simultaneous recording of its effects on membrane potential of distant cells. We measured input resistance when pericytes or endothelia were subjected to hyperpolarizing and depolarizing current injections and measured the effects of those injections on the homologous or heterologous cell type. We find that resistance of the pericyte syncytium is roughly double that of the endothelium and that either injected currents or voltage clamp depolarization conduct between cells. Resting membrane potentials of pericytes and endothelia of the same vessel are highly correlated and nearly identical. Endothelial membrane potential lies a few millivolts below that of adjacent pericytes. Pericyte and endothelial responses to angiotensin II (ANG II) and bradykinin (BK) show remarkable temporal identity. Thus, pericytes and endothelia are highly coupled and endothelia could plausibly limit pericyte contraction by exerting a tonic hyperpolarizing influence via myoendothelial junctions.
METHODS
Isolation of DVR.
Investigations involving animal use were performed according to protocols approved by the Institutional Animal Care and Use Committee of the University of Maryland. Kidneys were harvested from Sprague-Dawley rats (120–200 g; Harlan) that had been anesthetized by an intraperitoneal injection of ketamine/xylazine (80 mg/kg/10 mg/kg). Tissue slices were stored at 4°C in a physiological saline solution (PSS; in mM) 145 NaCl, 5 KCl, 1 MgCl2, 1 CaCl2, 10 HEPES, 10 glucose, pH 7.4 at room temperature. Tissue for patch-clamp studies was digested at 37°C for 22 min in a cocktail of collagenase 1A (0.5 mg/ml), protease XIV (0.4 mg/ml), and bovine serum albumin (1.0 mg/ml) in zero calcium PSS. After digestion, tissue was stored in PSS (containing 1 mM CaCl2) on ice (∼4°C) until used for individual DVR isolations by hand dissection. DVR segments, generally 500- to 1,000-μm length, were derived from vascular bundles of the outer medulla and transferred to an inverted microscope for patch clamp (33, 35). Access to endothelial cells was obtained by complete or partial stripping of pericytes from the abluminal surface. This was done, as previously described, by drawing in and then ejecting a collagenase-treated vessel from a micropipette, the tip of which had been heat-polished to a ∼6-μm orifice (43, 57).
Whole cell patch-clamp recording.
Patch pipettes were made from borosilicate glass capillary tubes (PG52151-4, external diameter 1.5 mm, internal diameter 1.0 mm; World Precision Instruments, Sarasota, FL), using a two-stage vertical pipette puller (Narshige PP-830) and heat-polished. Except where otherwise designated, whole cell electrical access to the cytoplasm was achieved by including nystatin (100 μg/ml) as a pore-forming agent in the electrode (33, 35). The electrode buffer was (in mmol/l) 120 kaspartate, 20 KCl, 10 NaCl, 10 HEPES, pH 7.2. The extracellular buffer was PSS as defined above. Recordings were performed at room temperature with Axopatch 200B or Multiclamp 700B amplifiers. Protocols for voltage clamp depolarization or current injection were controlled with Clampex 10.2 using a DigiData 1322 analog-to-digitial converter (Molecular Devices). Membrane potential was recorded with zero current clamp as previously described (33, 35).
During current clamp experiments designed to inject graded levels of current, we held one cell (Cell1) cells at 0 pA and injected −400 to +400 pA (100-pA increments, 900 ms) while recording membrane potential at a distant cell by zero current clamp (Cell2). Electrode voltage at Cell1 and membrane potential at Cell2 were sampled at 5 kHz. The end-pulse voltage in the electrode at Cell1 was that required to drive the specified current into the patched cell, the neighboring cells to which Cell1 is coupled and then across membranes to the extracellular space. The slopes of the plots of the end-pulse voltage vs. injected current were calculated by linear regression to yield “input resistance.” To provide another measure of resistance to current flow from one cell to another in the DVR wall, the rates at which Cell2 became polarized and repolarized, during and after current injection into Cell1, were also quantified. We used Clampfit (Molecular Devices) to fit a single exponential to each trace to compute the associated time constants. During voltage clamp experiments, Cell1 was held at −80 mV and depolarized to −40 mV while membrane potential at Cell2 was sampled at 5 kHz. During ANG II and BK exposures, membrane potentials of Cell1 and Cell2 were simultaneously acquired at 10 Hz.
Dual cell measurements and pericyte removal.
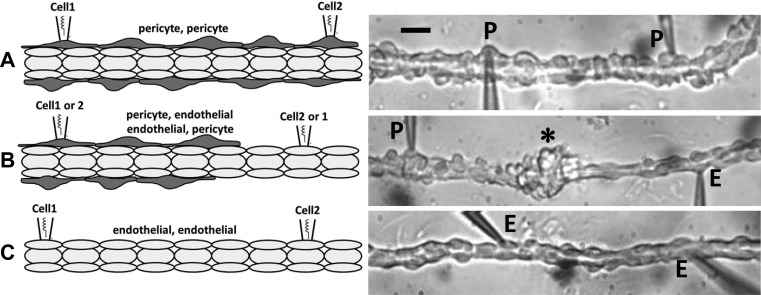
Dual cell patch-clamp illustrated in Fig. 1 was employed throughout this study. Pericyte-pericyte (P-P; Fig. 1A), pericyte-endothelial (P-E or E-P; Fig. 1B), and endothelial-endothelial (E-E; Fig. 1C) configurations were used to test transmission of current and voltage between homologous or heterologous cells (Cell1-Cell2). The pericyte layer was partially stripped for P-E or E-P testing and completely removed for E-E recordings. P-E or E-P endothelial exposures left an accumulation of pericytes approximately midway between the patch-clamp electrodes (Fig. 1B, right, *) (43, 53). Throughout this document, we designate the Cell1-Cell2 configurations as E-E, P-P, P-E, and E-P to indicate that the command electrode was sealed at the first cell (Cell1) for current injection or voltage clamp polarizations. In all cases, membrane potential was recorded at the second cell (Cell2). In some experiments both Cell1 and Cell2 were subjected to membrane potential recordings by holding each electrode at zero current.
Fig. 1.
Dual patch-clamp configurations. Left panels illustrate the 2-cell patch-clamp configurations used in these studies. Abluminal cells (dark gray) and luminal cells (light gray) are pericytes and endothelia, respectively. Right panels are photomicrographs that correspond to the left panels. A: pericyte-pericyte (P-P) configuration in which 2 pericytes (P) have been simultaneously accessed by nystatin-perforated patch clamp. The black bar is 12 μm. B: pericyte-endothelial (P-E) or E-P configuration in which a pericyte (P) and endothelial cell (E) were simultaneously accessed. The * designates an accumulation of pericytes around the middle of the vessel left when they were sheared free with a micropipette to expose the endothelium (see text). C: endothelial-endothelial (E-E) configuration in which pericytes were completely removed and 2 endothelial cells (E) were accessed.
Reagents.
Nystatin, ANG II, BK, collagenase 1A, protease XIV, and other chemicals were from Sigma (St. Louis, MO). Reagents were thawed and diluted on the day of the experiment and excess was discarded daily.
Statistics.
Data in the text and figures are reported as means ± SE based on the number of vessels. Experiments in which gigaseals failed before or during data acquisition were discarded. The significance of differences was evaluated with SigmaStat 3.11 (Systat Software, Point Richmond, CA) using parametric or nonparametric tests or ANOVA as appropriate for the data.
RESULTS
Cell layer resistances.
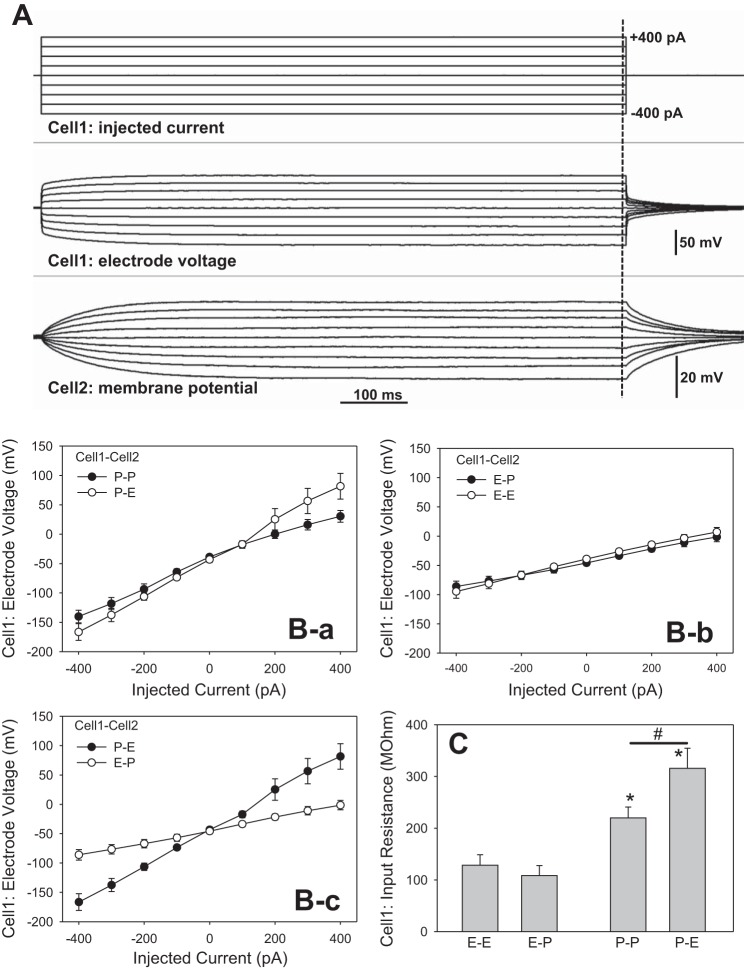
We injected currents ranging from −400 to +400 pA (100-pA increments, 900-ms duration) into pericytes or endothelial cells (Cell1) while recording membrane potential at either the homologous (P-P, E-E) or heterologous (P-E, E-P) cell type. When current is injected, it passes through the electrode tip into the Cell1 cytoplasm and subsequently through several series and parallel resistances comprised of gap junctions and ion channels to reach the extracellular electrode. During current injections, the amplifier sets voltage at the Cell1 electrode to that needed to drive the current through those resistances. The deviation of membrane potential at Cell2, caused by the injection into Cell1, was recorded as the conducted response. Figure 2A shows an example of an experiment in the P-P configuration. The protocol is illustrated in the top panel, the Cell1 electrode voltage in the middle panel, and the membrane potential response at Cell2 in the bottom panel. Figure 2B-a, B-b, B-c shows the means ± SE of Cell1 voltages vs. injected current for the various configurations. The groupings in the panels of Fig. 2B illustrate the similarity of slopes when injections were performed into pericytes (P-P, P-E; Fig. 2B-a) or endothelial cells (E-E, E-P; Fig. 2B-b). Figure 2B-c shows the dissimilarity of slopes for the P-E and E-P configurations where injections were into a pericyte or an endothelial cell, respectively. Finally, Fig. 2C summarizes the “input resistances” calculated from the means ± SE of slopes of the Cell1 current-voltage relationships. To verify that use of nystatin did not confer a significant contribution to resistance, we lowered resistance in a separate series by using ruptured patches generated by negative pressure after gigaseal (28). In that series, nystatin was omitted. Input resistance for ruptured patches was similar 266 ± 49 MΩ, n = 8, to that of perforated patches 220 ± 20 (n = 8) supporting the conclusion that the pipette tip is a minor component of total resistance. Given that electrode access resistance is typically less than 10 MΩ and that the calculated input resistances are 100 to 400 MΩ (Fig. 2C), this conforms to expectations.
Fig. 2.
End-pulse, Cell1 electrode voltage during current injections. A: example of current injection in the P-P configuration (see Fig. 1A). Top: current injection protocol. Cell1 was held at 0 pA and currents were injected from −400 to +400 pA in 100-pA increments for 900 ms. Middle: electrode voltage required to drive the respective currents into Cell1. Bottom: concomitant changes in membrane potential recorded at Cell2. B: means ± SE of Cell1 electrode voltage vs. injected current. B-a: similar slopes were observed in P-P and P-E configurations. B-b: similar slopes were observed in the E-E and E-P configurations. B-c: comparison of slopes in the P-E and E-P configurations shows the higher resistance of the former. The numbers of experiments in separate descending vasa recta (DVR) were n = 8, 7, 6, and 5 for P-P, P-E, E-E and E-P, respectively. C: calculations of input resistance from the means ± SE of slopes of individual end-pulse currents and electrode voltages at Cell1. Input resistance of injections into pericytes was higher than that for injections into endothelial cells, regardless of the identity of Cell2 (*P < 0.05, P-P or P-E vs. E-E configuration). The input resistance in the P-P configuration was lower than that of the P-E configuration where pericytes had been partially removed to expose the endothelium (#P < 0.05 vs. P-P vs. P-E).
Several conclusions can be drawn from Fig. 2. The input resistance depends on the identity of Cell1 as either a pericyte or an endothelial cell, regardless of the type of cell patched with the Cell2 recording electrode (Fig. 2C). This is as expected if current flows through different pathways (i.e., via endothelia or pericyte syncytia) during the respective injections. Since the Cell2 electrode is held at zero current, it provides no additional pathway for charge to exit the preparation. The larger resistance to pericyte injection corroborates prior conclusions that the pericyte syncytium is of higher resistance than that of the endothelium (57). It is possible that myoendothelial junctions conduct some current away from the pericyte layer during injections in the P-P and P-E configurations. Since the pericyte layer cannot be isolated from the endothelium, it is not possible to rigorously calculate the myoendothelial contribution by subtraction. Support for the notion that resistance to pericyte current injection resides largely in the pericyte layer is, however, provided by comparison of the results obtained in the P-P and P-E configurations. Removal of half of the pericytes for P-E experiments significantly elevated input resistance (Fig. 2C; #P < 0.05). Conversely, the low resistance to endothelial injections in the E-E configuration, and lack of a contribution of pericytes in the E-P configuration, supports the conclusion that putative myoendothelial conductance is either absent or of high resistance compared with either cell layer, per se.
Cell2 membrane potential deviations.
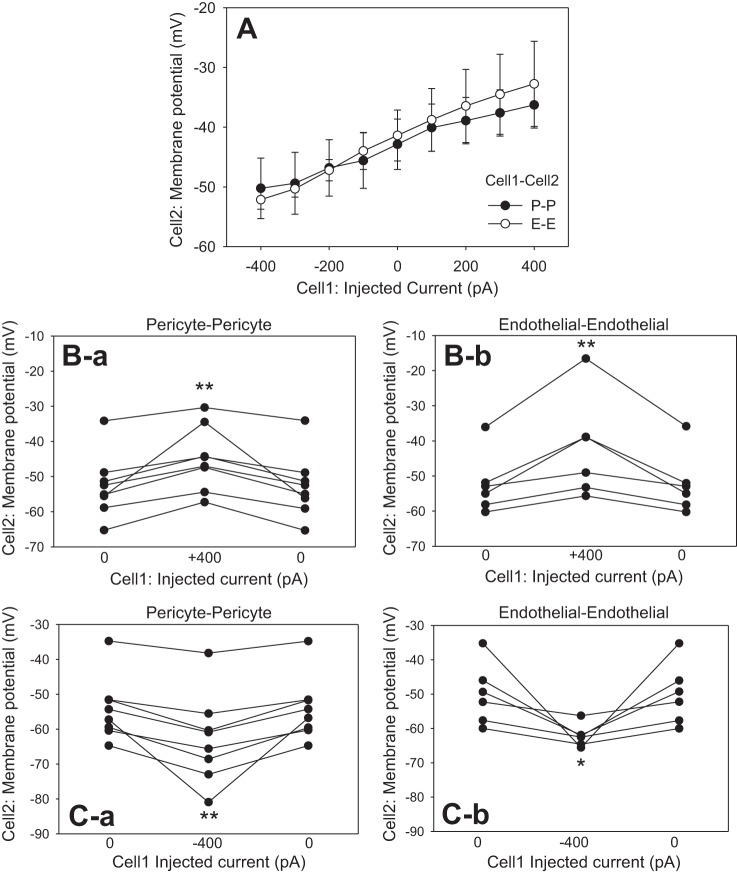
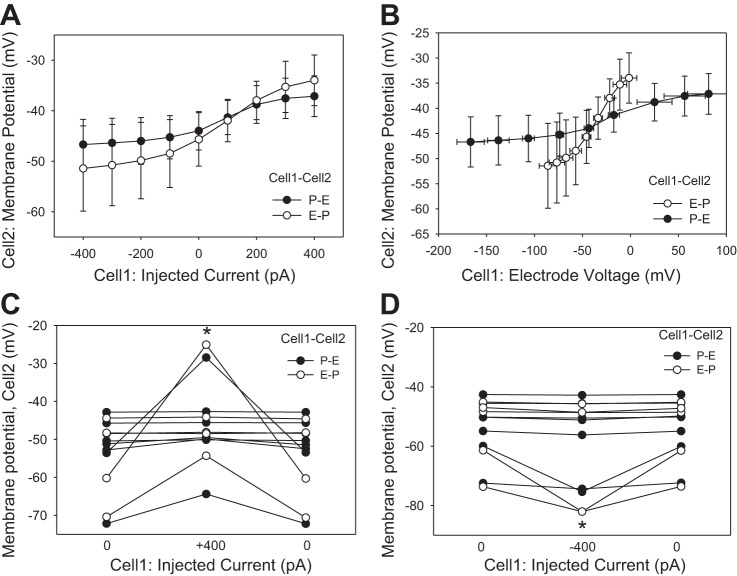
Additional insight into cell-to-cell conductance of the DVR wall is provided by records of membrane potential deviations at Cell2 (Figs. 3 and 4). Although more voltage was needed to drive current into pericytes, Cell2 membrane potential deviations in P-P and E-E configurations were similar (Fig. 3A). As expected, the largest deviations of Cell2 membrane potential occurred during the largest current injections at +400 and −400 pA. Those results are summarized for each vessel in Fig. 3, B and C, respectively. In all cases, Cell2 depolarization and hyperpolarization were readily reversible when current was reversed to 0 pA. Cell2 recordings in the P-E and E-P configurations yielded more erratic results (Fig. 4) than those in P-P or E-E (Fig. 3). During those myoendothelial recordings, many injections yielded small or no membrane responses at Cell2. Figure 4A shows the average responses as a function of injected current. An alternative presentation of the same data in Fig. 4B emphasizes that although more voltage is needed to drive current into pericytes (abscissa), deviations of membrane potential at Cell2 (ordinate) were small and similar whether injection was into a pericyte or an endothelial cell. The individual responses to +400- and −400-pA injections are summarized in Fig. 4, C and D, respectively. On average, significant membrane potential deviations occurred, but the results were erratic, suggesting high resistance to myoendothelial current flow, that myoendothelial gap junctions are absent, or that they are closed in some cells.
Fig. 3.
End-pulse Cell2 membrane potentials during current injections. A: end-pulse Cell2 membrane potentials in the P-P and E-E configurations were similar. B: Cell2 membrane potentials and their reversal during stepping of current from 0 to +400 pA and back to 0 at Cell1 in the P-P (B-a) and E-E (B-b) configurations. C: cell2 membrane potentials and reversal during injection of −400 pA into Cell1 in P-P (C-a) and E-E (C-b) configurations. *P < 0.05; **P < 0.01 vs. 0 pA.
Fig. 4.
Cell1 and Cell2 potentials during current injections in myo-endothelial configurations. A: end-pulse Cell2 membrane potentials vs. current injected into Cell1 in the P-E and E-P configurations. B: end-pulse Cell2 membrane potentials in the P-E and E-P configurations vs. the electrode voltage required to drive current into Cell1. C: myoendothelial Cell2 membrane potentials and their reversal during Cell1 injections of +400 pA in the P-E (●) or E-P (○) configurations (*P < 0.05 vs. 0 pA). D: Cell2 membrane potentials and reversal during Cell1 injections of −400 pA in the P-E (●) or E-P (○) configurations (*P < 0.05 vs. 0 pA).
Cell2 polarization rates.
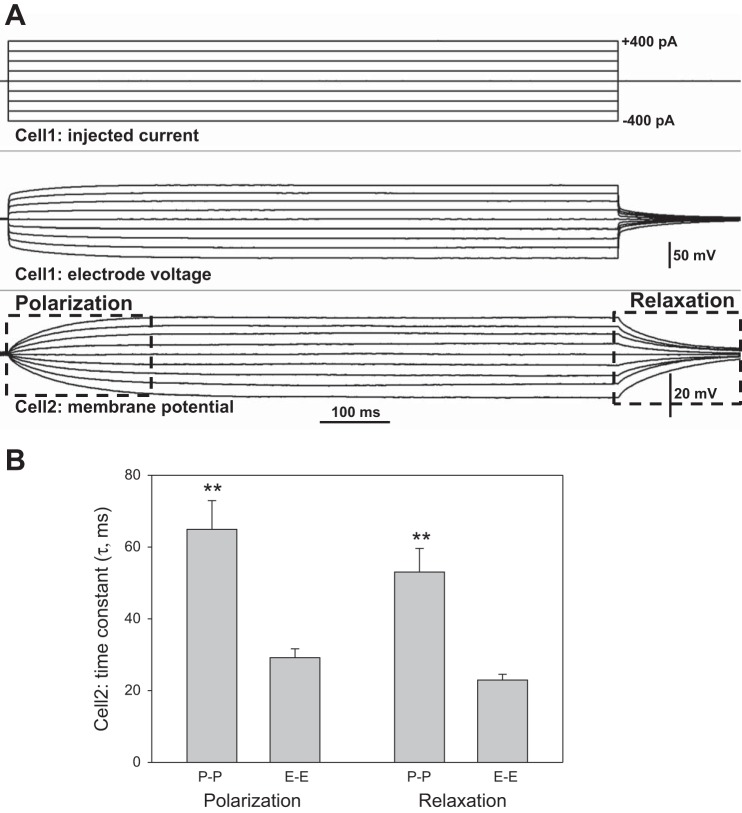
Another useful analysis, that compares conduction of current in the pericyte and endothelial layers, is provided by the rates of polarization and relaxation observed when charge flows to and then away from Cell2 during current injections (Fig. 5). Figure 5A illustrates the respective phases of the Cell2 response. Figure 5B summarizes the associated time constants derived by fitting single exponentials to the data. Flow of charge to and away from pericytes during P-P experiments required roughly twice as much time as that for endothelial cells during E-E recordings. This is consistent with input resistance calculations in Fig. 2C. For each cell type, fits to polarizations and relaxations were robust and yielded similar time constants. It was not possible to perform a similar analysis of Cell2 data from P-E and E-P records because Cell2 responses were too often small or negligible (Fig. 4) so that robust fits of exponentials could not be obtained.
Fig. 5.
Polarization and relaxation time constants during current injections in P-P and E-E configurations. A: example shows the Cell1 current injection protocol (top) and the associated membrane potential response observed at Cell2 (bottom). Boxes outline the polarization and relaxation phases wherein exponential fits to the data yielded time constants. B: means ± SE of time constants (τ) obtained by fitting a single exponential of the form, y = A exp(−t/τ) + C, to the polarization and relaxation phases, where τ, A, and C are constants. In either the P-P or E-E configuration, time constants were similar for polarization and relaxation phases of the response. Time constants in the P-P (n = 8) configuration were longer than those for E-E (n = 6, **P < 0.01).
Pericyte and endothelial membrane potentials.
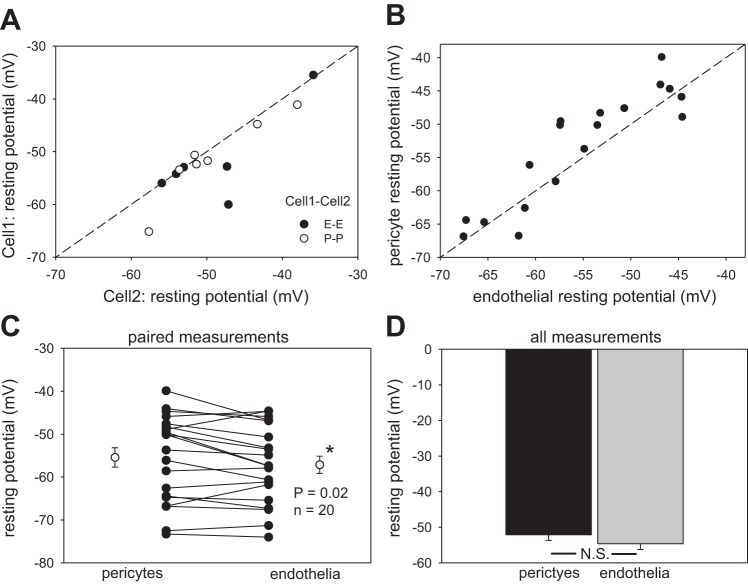
The data provided thus far show the syncytial nature of pericytes and endothelia. The data support myoendothelial conduction (Fig. 4) but lead to the conclusion that it may be erratically present or of high resistance. We obtained additional information concerning putative DVR myoendothelial coupling by performing dual measurements of resting membrane potentials. Before current injection protocols that yielded the data in Figs. 2–4, both Cell1 and Cell2 were clamped to zero current so that the respective electrode voltages were, in fact, resting membrane potentials. Figure 6 summarizes the remarkable similarity of those potentials in cells of the DVR wall for those and other recordings. Figure 6A shows similarity of homologous pericyte or endothelial membrane potentials from P-P and E-E records. Figure 6, B and C, show the remarkable correlation and near identity of simultaneous heterologous pericyte and endothelial potentials of P-E and E-P recordings. A slight hyperpolarization of endothelia relative to pericytes was observed but was only significant when analysis was confined to paired P-E, E-P records (n = 20, P = 0.02). Figure 6D shows the mean of 34 and 32 measurements of membrane potential for pericytes and endothelia, respectively.
Fig. 6.
Resting membrane potential of pericytes and endothelial cells. A: resting potential of endothelia and pericytes is plotted for DVR subjected to 2-cell patch clamp in the P-P and E-E configurations. The dashed line is identity. B: simultaneous, paired recording of resting potential of pericytes and endothelia of DVR in P-E and E-P configurations. The dashed line is identity. C: all paired comparisons of pericyte and endothelial membrane potentials simultaneously recorded from individual DVR (n = 20). Endothelia show a small but statistically significant hyperpolarization relative to pericytes (*P = 0.02). D: means ± SE of all endothelial (n = 32) and pericyte (n = 34) membrane potentials recorded in these studies (N.S., not significant).
Pericyte and endothelial membrane potential responses to ANG II and BK.
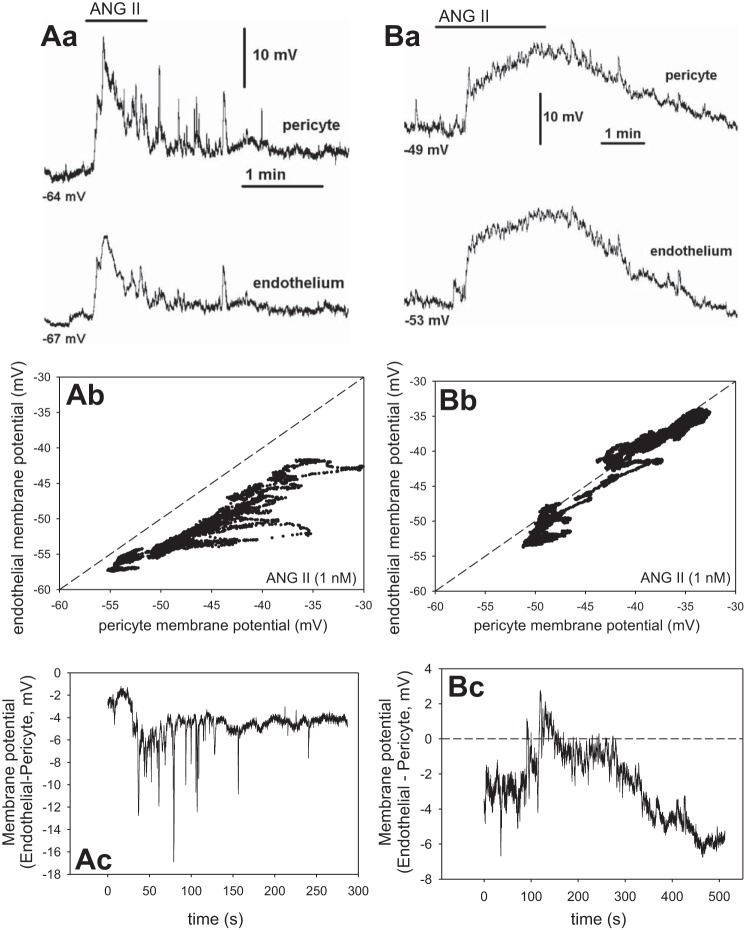
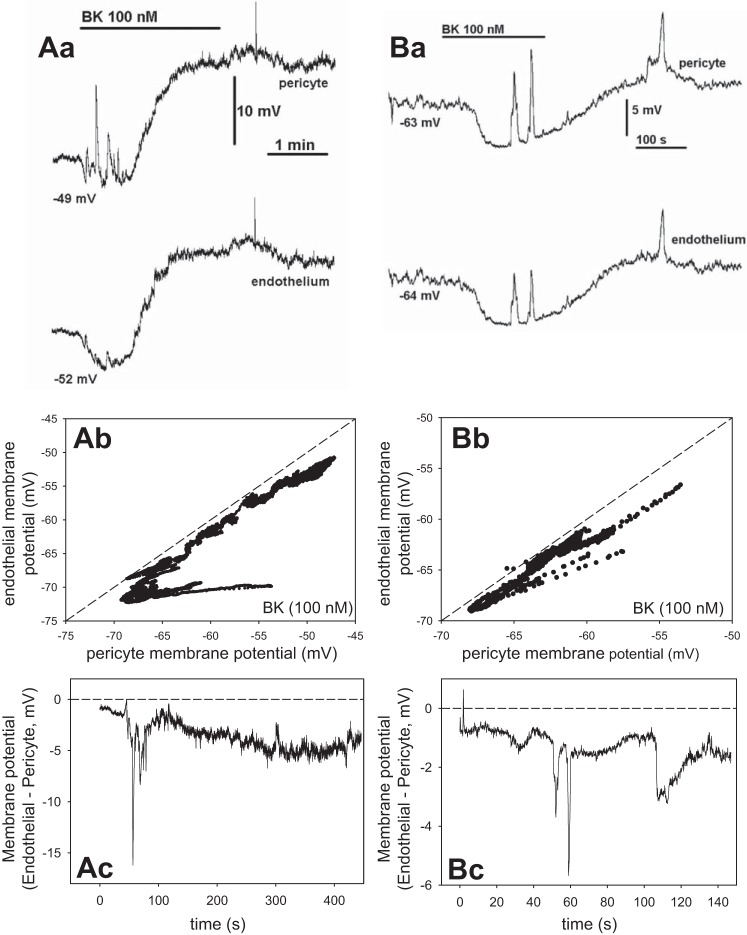
We performed additional simultaneous recording of membrane potentials in pericytes and endothelia during exposure to ANG II (1 nM) and BK (100 nM) Those agonists tend to depolarize and hyperpolarize DVR pericytes, respectively (35, 43). Figure 7 shows two separate recordings during ANG II and Fig. 8, during BK. Figure 7Aa-Ac shows one record in ANG II and Fig. 7Ba-Bc provides a similar recording in a second vessel. Figure 7Aa illustrates the temporal similarity of the pericyte (top) and endothelial (bottom) ANG II-induced responses. Figure 7Ab provides a plot of the pericyte vs. endothelial membrane potential measurements and Fig. 7Ac the difference between them vs. time. The membrane potentials were nearly identical but with the endothelium remaining slightly hyperpolarized relative to the pericyte. The records are similar to a total of n = 5 experiments with ANG II. Figure 8 shows records of membrane potential responses to BK, where hyperpolarization often precedes depolarization of the cells. Fig. 8Aa-Ac shows one record in BK and Fig. 8Ba-Bc illustrates a similar recording from a second vessel. Again, temporal patterns are identical (Fig. 8, Aa and Ba) with endothelial cells persistently hyperpolarized relative to the pericytes (Fig. 8, Ab and Bb). In both Figs. 7 and 8, some higher frequency spikes observed in pericyte records did not transmit well to the endothelium, otherwise the patterns are remarkable for their similarity. We previously showed that such spikes in ANG II are related to spontaneous transient inward currents and [Ca]CYT elevations (12, 54). Taken together, Figs. 6–8 strongly support myoendothelial sharing of membrane potential and the likelihood that univalent ions flow across myoendothelial gap junctions.
Fig. 7.
Simultaneous membrane potential recording in pericytes and endothelia during exposure to ANG II (1 nM). Aa: recordings show temporal similarity of pericyte (top) and endothelial (bottom) membrane potentials during exposure to ANG II. Starting value of membrane potential in the 2 cells was −64 and −67 mV, respectively. Ab: pericyte vs. endothelial membrane potential from Aa. Dashed line is identity. Ac: membrane potential difference vs. time. Ba: record of membrane potential during ANG II exposure in a second vessel. Starting membrane potentials were −49 and −53 mV. Bb: pericyte vs. endothelial membrane potential from Ba. Bc: membrane potential difference vs. time. These 2 records are similar to n = 5.
Fig. 8.
Simultaneous membrane potential recording in pericytes and endothelia during exposure to bradykinin (BK; 100 nM). Aa: recordings show temporal similarity of pericyte (top) and endothelial (bottom) membrane potentials during exposure to BK. Starting value of membrane potential in the 2 cells was −49 and −52 mV, respectively. Ab: pericyte vs. endothelial membrane potential from Aa. Dashed line is identity. Ac: membrane potential difference vs. time. Ba: record of membrane potential during BK exposure in a second vessel. Starting membrane potentials were −63 and −64 mV. Bb: pericyte vs. endothelial membrane potential from Ba. Bc: membrane potential difference vs. time. These 2 records are similar to n = 6.
Myoendothelial conduction of voltage clamp responses.
Cell2 responses were small during current injections (Fig. 4) but membrane potentials seem readily shared by pericytes and endothelia (Figs. 6–8). As an additional confirmatory exercise, we tested myoendothelial coupling by voltage clamp. Using P-E and E-P configurations, Cell1 was held at −80 mV, and then depolarized to −40 mV for 600 ms, while membrane potential was recorded at Cell2. Figure 9A provides an example for E-P recording. Results for P-E and E-P were similar, combined, and summarized as Fig. 9B. Cell2 was consistently depolarized during depolarization of Cell1.
Fig. 9.
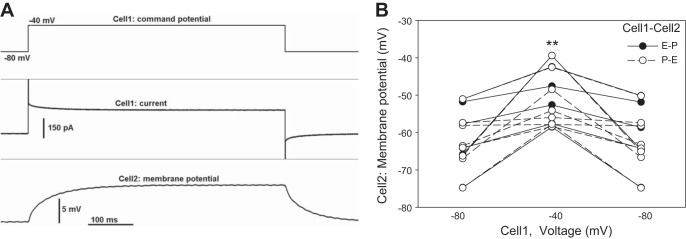
Membrane potential changes of pericytes and endothelia during voltage clamp depolarizations. A: example of voltage clamp-induced depolarization of Cell1 from a holding level of −80 to −40 mV (top). Cell1 current (middle) and Cell2 membrane potential (bottom) simultaneously recorded in the E-P configuration. B: summary of all Cell2 membrane potentials before, during, and after voltage clamp-induced depolarization of Cell1 in P-E (○) and E-P (●) configurations. Cell2 was consistently depolarized (**P < 0.01).
DISCUSSION
Gap junction proteins couple cells in the renal vasculature and other organs. We demonstrated that the pericyte and endothelial layers of the DVR wall express connexins (Cx). By immunostaining, Cx37, Cx40, and Cx43 were observed. Cx40 and Cx43 predominated in endothelia while Cx37 showed greater distribution to pericytes (53). The presence of those connexins in the vasculature of the kidney and other organs has been frequently described. Cx45 also distributes to blood vessels, including the kidney, but its presence was not specifically examined in DVR (20, 22, 23, 49). As expected from variable expression of connexins, DVR endothelial and pericytes are syncytial but their coupling is not identical (57). Moreover, the extent of putative myoendothelial interactions in DVR had not been previously tested. Much prior evidence for syncytial coupling in DVR exists. Introduction of Lucifer yellow, by diffusion from a patch-clamp electrode, into an endothelial cell is followed by a rapid spread to adjacent endothelial cells. In contrast, similar diffusion into pericytes reveals Lucifer yellow sequestration (53, 57). Depolarization of a either a pericyte or endothelial cell, however, depolarizes adjacent homologous cells within microseconds (57). Mechanical deformation of a pericyte surface depolarizes nearby pericytes and simultaneously elevates their cytoplasmic Ca2+ ([Ca]CYT) via a nifedipine-sensitive pathway (58). Depolarization of membrane potential of pericytes by either mechanical stimulation (58) or ANG II raises pericyte but not adjacent endothelial [Ca]CYT. In fact, ANG II suppresses endothelial [Ca]CYT (36) even while [Ca]CYT and membrane potential of adjacent pericytes undergo oscillations (12, 54). ANG II and BK elicit depolarizing and hyperpolarizing responses in pericytes and endothelia (43). Based on those observations, we previously speculated that pericytes and endothelia are coupled by myoendothelial connections that link membrane potential but not [Ca]CYT fluctuations (54). Given that [Ca]CYT changes may be highly localized through chelation by cytoplasmic binding proteins and/or sequestration into sarcoplasmic reticulum (39), the independence of pericyte and endothelial [Ca]CYT cannot be interpreted as lack of evidence for ion conductance via myoendothelial junctions.
The principal goals of the present studies were to systematically investigate the relative degree of pericyte and endothelial cell layer coupling by using a range of depolarizing and hyperpolarizing current injections and to test myoendothelial conduction. To accomplish this, we combined the high sensitivity of electrophysiology with a technical ability to remove pericytes from the DVR wall to access the endothelium. Using dual patch-clamp protocols, we injected current (Figs. 2–5), measured membrane potentials (Figs. 6–8), or stepped membrane potential between imposed levels by voltage clamp (Fig. 9). The voltage needed to drive current from the electrode, through the preparation, to the extracellular space during graded current injections was used to calculate cell layer “input resistances” (Fig. 2). That black-box designation belies the true complexity of a circuit that would be necessary to rigorously simulate the vessel wall. In such a circuit, resistances would connect each cell to its neighbors and each cell would be represented by an individual capacitance. Current pathways to the extracellular buffer would be simulated by separate resistances that account for ion channels. Moreover, the conductance of those pathways and the extent to which pericyte and endothelial cell layers are coupled by myoendothelial connexons (6, 7, 44) are likely to be voltage and [Ca]CYT dependent, as is clearly true for K+ and Cl− channels of DVR pericytes (30, 33, 54). Finally, the contribution of electrogenic Na-K-ATPase to maintenance of membrane potential is expected to be of increasing importance to the cells that are distant from the Cell1 electrode. Based on such considerations, a unique value for input resistance, that is independent of the state of the DVR, will almost certainly not exist and cell layers cannot be considered discrete resistors. Extrapolation of these measurements to other physiological conditions may be limited. In vivo, DVR exist in a hypertonic and relatively hypoxic environment. In contrast, explanted vessels experience artificial buffers, ambient oxygen concentrations, and absence of mechanical shear from luminal perfusion. Finally, it is not possible to achieve the high-resistance gigaohm seals onto cell membranes of the DVR wall without predigesting outer medullary tissue with collagenase-containing cocktails. It remains a possibility that this could alter gap junction or important interacting proteins. As with all studies in explanted tissue, extrapolations to in situ behavior should be cautious.
We found that injection of current into pericytes requires approximately twice the voltage needed to drive equal currents through the endothelium and slopes were linear throughout the positive and negative ranges of the injections (Fig. 2). This can be interpreted to show low-resistance gap junction coupling between endothelial cells relative to pericytes without rectification (Fig. 2). The time required for pericytes to polarize and repolarize during current injections also supports their high resistance relative to endothelia (Fig. 5). With regard to myoendothelial pathways, the partial presence or absence of the pericyte layer did not affect the endothelial resistance (Fig. 2) mitigating against significant current flow from endothelia to pericytes during E-P current injections. Similarly, injection of current more efficiently altered membrane potential along the homologous layer during P-P and E-E experiments (Fig. 3) than during heterologous P-E and E-P testing (Fig. 4). The difficulty of demonstrating Cell2 voltage changes across myoendothelial junctions during E-P and P-E current injection experiments suggests that myoendothelial resistance is high relative to that of either the endothelial or pericyte layers, per se (Fig. 4). In that case, most current injected to either cell type is expected to conduct by the low-resistance pathway to the bath electrode via the homologous layer rather than crossing the high-resistance myoendothelial route to reach the heterologous syncytium. The finding that some current injections yielded readily observable contralateral E-P and P-E membrane potential deviations may point to variability of myoendothelial connections, that some are closed in the resting state, or a complete absence of them in some cells (Fig. 4).
Although myoendothelial resistance to flow of ions may be high relative to either the pericyte or endothelial layers, it is important to consider that the flow of charge needed to couple membrane potential of adjacent cells may be very small. As such, high resistance of myoendothelial junctions cannot be taken as evidence of their insignificance. Indeed, a tonic hyperpolarizing influence of endothelia on pericytes is suggested by membrane potential measurements in Figs. 6–8. DVR endothelia may provide a tonic brake on voltage-gated calcium entry into pericytes. By that notion, hyperpolarizing signals might be efficiently conducted along the DVR axis via the endothelium and to pericytes by myoendothelial junctions. Such activity may be vital to limit voltage-gated calcium entry, vascular tone, and agonist-induced vasoconstriction to avoid medullary hypoxia (1, 27).
The near-identity of membrane potential of two pericytes or two endothelia of the same vessel is striking (Fig. 6). It seems unlikely that it reflects identical states of channel conductance and Na+ pump activity. Far more likely, gap junctions permeable to univalent ions couple the cells. Given the consistency with which syncytial transmission in the pericyte and endothelial layers has been demonstrated in past (53, 57) and present studies (Figs. 2–5, 9), coupling of membrane potential in homologous cells (Fig. 6A) is not surprising. More provocative is the observation that paired comparisons of resting potentials of pericytes and endothelia of the same vessel show near identity, within a few millivolts (Figs. 6, B and C, 7, 8). In contrast to erratic observations in Fig. 4, C and D, this supports a predominant presence of myoendothelial coupling. It is also important that paired measurement reveals slight but significant hyperpolarization of endothelia relative to the pericytes (Fig. 6, B and C). This is consistent with a putative role for the endothelial layer to exert a tonic relaxant effect by lowering voltage-gated calcium entry into pericytes. Prior investigations showed that L-type VGCC dominate as a route for agonist-induced calcium entry into pericytes and juxtamedullary efferent arterioles (25, 56). The close identity of membrane potentials in E-E, P-P, E-P, and P-E studies implies, for a given vessel, that all membrane potentials lie within a narrow range. This raises interesting questions concerning the coupling of adjacent vessels in vivo, downstream of their juxtamedullary branch points. Unfortunately, inaccessibility of the outer medulla will probably limit such investigations.
The presence and putative roles of gap junction coupling in microvessels have been frequently reviewed (5–8, 14). There are many precedents in other vascular beds. One difficulty evaluating conducted responses in DVR is that DVR must be explanted for study. Only ∼500 to 1,500 microns of vessel can be isolated. That limits the ability to examine the degree to which signals decline as a function of distance from the site of Cell1 current injection. More accessible preparations that have been used for in vivo studies include cheek pouch, mesenteric and cremasteric vessels. For example, Yamamoto and colleagues (51) noted conduction of responses between smooth muscle and endothelia of the guinea pig mesentery. They observed that spiked responses originating from smooth muscle were conducted to endothelia, much as we have seen (Figs. 7 and 8). They also concluded that hyperpolarizing responses to the endothelium-dependent vasodilator acetylcholine were conducted via myoendothelial junctions to smooth muscle (52). Similar conduced hyperpolarizing or vasodilatory responses have been described in mesenteric and cremasteric vessels of the rat and hamster (10, 18, 47). The likelihood that conducted vasodilatory responses are transmitted via gap junctions along the endothelial layer was predicted by Haas and Duling (21). Conducted vasoconstriction also exists (19).
DVR are at the lower limit of size of vasoactive arteriolar segments. Recent attention has been drawn to the role of renal pericytes in inflammation and fibrosis (40, 42, 48). In the context that we studied them in DVR, they clearly have a smooth muscle phenotype. They contract and their resting potential is balanced between hyperpolarizing influences of K+ channels and Na+ pump activity and the depolarizing influence of calcium-activated chloride channels. With respect to contractile functions and role of gap junctions in pericytes, DVR are not unique. Direct connections in cerebral vessels were described by Fujimoto (15). Parallel studies of retinal microvessels have shown robust conducted responses (41, 55) that can be altered in disease states (32).
Vascular gap junctions are likely to spread vasodilatory and contractile responses along the vessel axis (6, 7, 14). Many authors have pointed out that the hypoxia of the medulla that arises from countercurrent exchange may result in vulnerability of salt-transporting nephron segments such as pars recta and thick ascending limb of Henle to ischemic insult (2, 3, 13). The possibility that paracrine agents released in the vicinity of vascular bundle DVR may serve to blunt hypoxia when metabolic demand is high has been supported by experiments in isolated tissue preparations (9). The range of any such vasodilation might well be extended by conducting the responses along DVR mural syncytia to dilate the juxtamedullary segments nearer the corticomedullary junction. By that notion, ischemia might be blunted if dilatory hyperpolarizing responses are conducted by the endothelial layer and from endothelia to pericytes across myoendothelial junctions. Conversely, hydropenic water conservation in which low-flow to the inner medulla would optimize countercurrent exchange and urinary concentration might be served by conducted vasoconstriction along pericytes (37). The ability of pericytes to conduct depolarizations related to mechanical stimuli has been shown (58). The possibility that mural transmission via the DVR wall plays a pivotal role in renal medullary physiological processes is presently unexplored. The possibility that such coupling might have variable spatial regulation across outer medullary vascular bundles to distribute blood flow to the outer vs. inner medulla is also speculative but worthy of consideration.
GRANTS
These studies have been supported by National Institutes of Health Grants DK042495 and DK067621.
DISCLOSURES
No conflicts of interest, financial or otherwise, are declared by the author(s).
AUTHOR CONTRIBUTIONS
Author contributions: Z.Z. and T.L.P. conception and design of research; Z.Z., K.P., and T.L.P. performed experiments; Z.Z. and T.L.P. interpreted results of experiments; Z.Z., K.P., and T.L.P. edited and revised manuscript; Z.Z., K.P., and T.L.P. approved final version of manuscript; T.L.P. analyzed data; T.L.P. prepared figures; T.L.P. drafted manuscript.
REFERENCES
- 1.Abdelkader A, Ho J, Ow CP, Eppel GA, Rajapakse NW, Schlaich MP, Evans RG. Renal oxygenation in acute renal ischemia-reperfusion injury. Am J Physiol Renal Physiol 306: F1026–F1038, 2014 [DOI] [PubMed] [Google Scholar]
- 2.Bonventre JV, Yang L. Cellular pathophysiology of ischemic acute kidney injury. J Clin Invest 121: 4210–4221, 2011 [DOI] [PMC free article] [PubMed] [Google Scholar]
- 3.Brezis M, Rosen SN, Epstein FH. The pathophysiological implications of medullary hypoxia. Am J Kidney Dis 13: 253–258, 1989 [DOI] [PubMed] [Google Scholar]
- 4.Cao C, Lee-Kwon W, Silldorff EP, Pallone TL. KATP channel conductance of descending vasa recta pericytes. Am J Physiol Renal Physiol 289: F1235–F1245, 2005 [DOI] [PubMed] [Google Scholar]
- 5.De Wit C. Connexins pave the way for vascular communication. News Physiol Sci 19: 148–153, 2004 [DOI] [PubMed] [Google Scholar]
- 6.de Wit C, Boettcher M, Schmidt VJ. Signaling across myoendothelial gap junctions–fact or fiction? Cell Commun Adhes 15: 231–245, 2008 [DOI] [PubMed] [Google Scholar]
- 7.de Wit C, Griffith TM. Connexins and gap junctions in the EDHF phenomenon and conducted vasomotor responses. Pflügers Arch 459: 897–914, 2010 [DOI] [PubMed] [Google Scholar]
- 8.de Wit C, Wolfle SE. EDHF and gap junctions: important regulators of vascular tone within the microcirculation. Curr Pharm Biotechnol 8: 11–25, 2007 [DOI] [PubMed] [Google Scholar]
- 9.Dickhout JG, Mori T, Cowley AW., Jr. Tubulovascular nitric oxide crosstalk: buffering of angiotensin II-induced medullary vasoconstriction. Circ Res 91: 487–493, 2002 [DOI] [PubMed] [Google Scholar]
- 10.Dora KA, Damon DN, Duling BR. Microvascular dilation in response to occlusion: a coordinating role for conducted vasomotor responses. Am J Physiol Heart Circ Physiol 279: H279–H284, 2000 [DOI] [PubMed] [Google Scholar]
- 11.Edwards A, Layton AT. Nitric oxide and superoxide transport in a cross section of the rat outer medulla. I. Effects of low medullary oxygen tension. Am J Physiol Renal Physiol 299: F616–F633, 2010 [DOI] [PMC free article] [PubMed] [Google Scholar]
- 12.Edwards A, Pallone TL. Mechanisms underlying angiotensin II-induced calcium oscillations. Am J Physiol Renal Physiol 295: F568–F584, 2008 [DOI] [PMC free article] [PubMed] [Google Scholar]
- 13.Epstein FH. Hypoxia of the renal medulla. Q J Med 57: 807–810, 1985 [PubMed] [Google Scholar]
- 14.Figueroa XF, Isakson BE, Duling BR. Connexins: gaps in our knowledge of vascular function. Physiology (Bethesda) 19: 277–284, 2004 [DOI] [PubMed] [Google Scholar]
- 15.Fujimoto K. Pericyte-endothelial gap junctions in developing rat cerebral capillaries: a fine structural study. Anat Rec 242: 562–565, 1995 [DOI] [PubMed] [Google Scholar]
- 16.Gardiner BS, Smith DW, O'Connor PM, Evans RG. A mathematical model of diffusional shunting of oxygen from arteries to veins in the kidney. Am J Physiol Renal Physiol 300: F1339–F1352, 2011 [DOI] [PubMed] [Google Scholar]
- 17.Garland CJ, Hiley CR, Dora KA. EDHF: spreading the influence of the endothelium. Br J Pharmacol 164: 839–852, 2011 [DOI] [PMC free article] [PubMed] [Google Scholar]
- 18.Goto K, Fujii K, Kansui Y, Abe I, Iida M. Critical role of gap junctions in endothelium-dependent hyperpolarization in rat mesenteric arteries. Clin Exp Pharmacol Physiol 29: 595–602, 2002 [DOI] [PubMed] [Google Scholar]
- 19.Gustafsson F, Holstein-Rathlou NH. Angiotensin II modulates conducted vasoconstriction to norepinephrine and local electrical stimulation in rat mesenteric arterioles. Cardiovasc Res 44: 176–184, 1999 [DOI] [PubMed] [Google Scholar]
- 20.Gustafsson F, Mikkelsen HB, Arensbak B, Thuneberg L, Neve S, Jensen LJ, Holstein-Rathlou NH. Expression of connexin 37, 40 and 43 in rat mesenteric arterioles and resistance arteries. Histochem Cell Biol 119: 139–148, 2003 [DOI] [PubMed] [Google Scholar]
- 21.Haas TL, Duling BR. Morphology favors an endothelial cell pathway for longitudinal conduction within arterioles. Microvasc Res 53: 113–120, 1997 [DOI] [PubMed] [Google Scholar]
- 22.Hanner F, Sorensen CM, Holstein-Rathlou NH, Peti-Peterdi J. Connexins and the kidney. Am J Physiol Regul Integr Comp Physiol 298: R1143–R1155, 2010 [DOI] [PMC free article] [PubMed] [Google Scholar]
- 23.Hanner F, von Maltzahn J, Maxeiner S, Toma I, Sipos A, Kruger O, Willecke K, Peti-Peterdi J. Connexin45 is expressed in the juxtaglomerular apparatus and is involved in the regulation of renin secretion and blood pressure. Am J Physiol Regul Integr Comp Physiol 295: R371–R380, 2008 [DOI] [PMC free article] [PubMed] [Google Scholar]
- 24.Hansell P, Nygren A, Ueda J. Influence of verapamil on regional renal blood flow: a study using multichannel laser-Doppler flowmetry. Acta Physiol Scand 139: 15–20, 1990 [DOI] [PubMed] [Google Scholar]
- 25.Hansen PB, Jensen BL, Andreasen D, Skott O. Differential expression of T- and L-type voltage-dependent calcium channels in renal resistance vessels. Circ Res 89: 630–638, 2001 [DOI] [PubMed] [Google Scholar]
- 26.Heyman SN, Brezis M, Epstein FH, Spokes K, Silva P, Rosen S. Early renal medullary hypoxic injury from radiocontrast and indomethacin. Kidney Int 40: 632–642, 1991 [DOI] [PubMed] [Google Scholar]
- 27.Heyman SN, Khamaisi M, Rosen S, Rosenberger C. Renal parenchymal hypoxia, hypoxia response and the progression of chronic kidney disease. Am J Nephrol 28: 998–1006, 2008 [DOI] [PubMed] [Google Scholar]
- 28.Horn R, Marty A. Muscarinic activation of ionic currents measured by a new whole-cell recording method. J Gen Physiol 92: 145–159, 1988 [DOI] [PMC free article] [PubMed] [Google Scholar]
- 29.Kerr PM, Tam R, Ondrusova K, Mittal R, Narang D, Tran CH, Welsh DG, Plane F. Endothelial feedback and the myoendothelial projection. Microcirculation 19: 416–422, 2012 [DOI] [PubMed] [Google Scholar]
- 30.Lin H, Pallone TL, Cao C. Murine vasa recta pericyte chloride conductance is controlled by calcium, depolarization, and kinase activity. Am J Physiol Regul Integr Comp Physiol 299: R1317–R1325, 2010 [DOI] [PMC free article] [PubMed] [Google Scholar]
- 31.Lu S, Roman RJ, Mattson DL, Cowley AW., Jr. Renal medullary interstitial infusion of diltiazem alters sodium and water excretion in rats. Am J Physiol Regul Integr Comp Physiol 263: R1064–R1070, 1992 [DOI] [PubMed] [Google Scholar]
- 32.Nakaizumi A, Zhang T, Puro DG. The electrotonic architecture of the retinal microvasculature: diabetes-induced alteration. Neurochem Int 61: 948–953, 2012 [DOI] [PMC free article] [PubMed] [Google Scholar]
- 33.Pallone TL, Cao C, Zhang Z. Inhibition of K+ conductance in descending vasa recta pericytes by ANG II. Am J Physiol Renal Physiol 287: F1213–F1222, 2004 [DOI] [PubMed] [Google Scholar]
- 34.Pallone TL, Edwards A, Mattson DL. Renal medullary circulation. Compr Physiol 2: 97–140, 2012 [DOI] [PubMed] [Google Scholar]
- 35.Pallone TL, Huang JM. Control of descending vasa recta pericyte membrane potential by angiotensin II. Am J Physiol Renal Physiol 282: F1064–F1074, 2002 [DOI] [PubMed] [Google Scholar]
- 36.Pallone TL, Silldorff EP, Zhang Z. Inhibition of calcium signaling in descending vasa recta endothelia by ANG II. Am J Physiol Heart Circ Physiol 278: H1248–H1255, 2000 [DOI] [PubMed] [Google Scholar]
- 37.Pallone TL, Turner MR, Edwards A, Jamison RL. Countercurrent exchange in the renal medulla. Am J Physiol Regul Integr Comp Physiol 284: R1153–R1175, 2003 [DOI] [PubMed] [Google Scholar]
- 38.Palm F, Onozato M, Welch WJ, Wilcox CS. Blood pressure, blood flow, and oxygenation in the clipped kidney of chronic 2-kidney, 1-clip rats: effects of tempol and angiotensin blockade. Hypertension 55: 298–304, 2010 [DOI] [PMC free article] [PubMed] [Google Scholar]
- 39.Parekh AB. Ca2+ microdomains near plasma membrane Ca2+ channels: impact on cell function. J Physiol 586: 3043–3054, 2008 [DOI] [PMC free article] [PubMed] [Google Scholar]
- 40.Peppiatt-Wildman CM. The evolving role of renal pericytes. Curr Opin Nephrol Hypertens 22: 10–16, 2013 [DOI] [PubMed] [Google Scholar]
- 41.Puro DG. Physiology and pathobiology of the pericyte-containing retinal microvasculature: new developments. Microcirculation 14: 1–10, 2007 [DOI] [PubMed] [Google Scholar]
- 42.Ren S, Duffield JS. Pericytes in kidney fibrosis. Curr Opin Nephrol Hypertens 22: 471–480, 2013 [DOI] [PubMed] [Google Scholar]
- 43.Rhinehart K, Zhang Z, Pallone TL. Ca2+ signaling and membrane potential in descending vasa recta pericytes and endothelia. Am J Physiol Renal Physiol 283: F852–F860, 2002 [DOI] [PubMed] [Google Scholar]
- 44.Saez JC, Berthoud VM, Branes MC, Martinez AD, Beyer EC. Plasma membrane channels formed by connexins: their regulation and functions. Physiol Rev 83: 1359–1400, 2003 [DOI] [PubMed] [Google Scholar]
- 45.Sandow SL, Senadheera S, Bertrand PP, Murphy TV, Tare M. Myoendothelial contacts, gap junctions, and microdomains: anatomical links to function? Microcirculation 19: 403–415, 2012 [DOI] [PubMed] [Google Scholar]
- 46.Schmidt VJ, Wolfle SE, Boettcher M, de Wit C. Gap junctions synchronize vascular tone within the microcirculation. Pharmacol Rep 60: 68–74, 2008 [PubMed] [Google Scholar]
- 47.Segal SS. Microvascular recruitment in hamster striated muscle: role for conducted vasodilation. Am J Physiol Heart Circ Physiol 261: H181–H189, 1991 [DOI] [PubMed] [Google Scholar]
- 48.Stefanska A, Peault B, Mullins JJ. Renal pericytes: multifunctional cells of the kidneys. Pflügers Arch 465: 767–773, 2013 [DOI] [PubMed] [Google Scholar]
- 49.Takenaka T, Inoue T, Kanno Y, Okada H, Hill CE, Suzuki H. Connexins 37 and 40 transduce purinergic signals mediating renal autoregulation. Am J Physiol Regul Integr Comp Physiol 294: R1–R11, 2008 [DOI] [PubMed] [Google Scholar]
- 50.Yagil Y, Miyamoto M, Frasier L, Oizumi K, Koike H. Effects of CS-905, a novel dihydropyridine calcium channel blocker, on arterial pressure, renal excretory function, and inner medullary blood flow in the rat. Am J Hypertens 7: 637–646, 1994 [PubMed] [Google Scholar]
- 51.Yamamoto Y, Fukuta H, Nakahira Y, Suzuki H. Blockade by 18beta-glycyrrhetinic acid of intercellular electrical coupling in guinea-pig arterioles. J Physiol 511: 501–508, 1998 [DOI] [PMC free article] [PubMed] [Google Scholar]
- 52.Yamamoto Y, Imaeda K, Suzuki H. Endothelium-dependent hyperpolarization and intercellular electrical coupling in guinea-pig mesenteric arterioles. J Physiol 514: 505–513, 1999 [DOI] [PMC free article] [PubMed] [Google Scholar]
- 53.Zhang Q, Cao C, Mangano M, Zhang Z, Silldorff EP, Lee-Kwon W, Payne K, Pallone TL. Descending vasa recta endothelium is an electrical syncytium. Am J Physiol Regul Integr Comp Physiol 291: R1688–R1699, 2006 [DOI] [PubMed] [Google Scholar]
- 54.Zhang Q, Cao C, Zhang Z, Wier WG, Edwards A, Pallone TL. Membrane current oscillations in descending vasa recta pericytes. Am J Physiol Renal Physiol 294: F656–F666, 2008 [DOI] [PMC free article] [PubMed] [Google Scholar]
- 55.Zhang T, Wu DM, Xu GZ, Puro DG. The electrotonic architecture of the retinal microvasculature: modulation by angiotensin II. J Physiol 589: 2383–2399, 2011 [DOI] [PMC free article] [PubMed] [Google Scholar]
- 56.Zhang Z, Lin H, Cao C, Khurana S, Pallone TL. Voltage-gated divalent currents in descending vasa recta pericytes. Am J Physiol Renal Physiol 299: F862–F871, 2010 [DOI] [PMC free article] [PubMed] [Google Scholar]
- 57.Zhang Z, Lin H, Cao C, Payne K, Pallone TL. Descending vasa recta endothelial cells and pericytes form mural syncytia. Am J Physiol Renal Physiol 306: F751–F763, 2014 [DOI] [PMC free article] [PubMed] [Google Scholar]
- 58.Zhang Z, Payne K, Cao C, Pallone TL. Mural propagation of descending vasa recta responses to mechanical stimulation. Am J Physiol Renal Physiol 305: F286–F294, 2013 [DOI] [PMC free article] [PubMed] [Google Scholar]
- 59.Zhang Z, Rhinehart K, Pallone TL. Membrane potential controls calcium entry into descending vasa recta pericytes. Am J Physiol Regul Integr Comp Physiol 283: R949–R957, 2002 [DOI] [PubMed] [Google Scholar]


