

Abstract
Resolution of acute inflammation is an active process locally controlled by a novel genus of specialized pro-resolving mediators (SPM) that orchestrate key resolution responses. Hence, it is of general interest to identify individual bioactive mediators and profile their biosynthetic pathways with related isomers as well as their relation(s) to classic eicosanoids in mammalian tissues. Lipid mediator (LM)-SPM levels and signature profiles of their biosynthetic pathways were investigated using liquid chromatography-tandem mass spectrometry (LC-MS-MS)-based LM metabololipidomics. LM and SPM were identified using ≥6 diagnostic ions and chromatographic behavior matching with both authentic and synthetic materials. This approach was validated using the composite reference plasma (SRM1950) of 100 healthy individuals. Using targeted LM metabololipidomics, we profiled LM and SPM pathways in human peripheral blood (plasma and serum) and lymphoid organs. In these, we identified endogenous SPM metabolomes, namely, the potent lipoxins (LX), resolvins (Rv), protectins (PD), and maresins (MaR). These included RvD1, RvD2, RvD3, MaR1, and NPD1/PD1, which were identified in amounts within their bioactive ranges. In plasma and serum, principal component analysis (PCA) identified signature profiles of eicosanoids and SPM clusters. Plasma-SPM increased with omega-3 and acetylsalicylic acid intake that correlated with increased phagocytosis of Escherichia coli in whole blood. These findings demonstrate an approach for identification of SPM pathways (e.g., resolvins, protectins, and maresins) in human blood and lymphoid tissues that were in amounts commensurate with their pro-resolving, organ protective, and tissue regeneration functions. LM metabololipidomics coupled with calibration tissues and physiological changes documented herein provide a tool for functional phenotypic profiling.
Keywords: eicosanoids, inflammation, resolution, resolvins
acute inflammation is host protective and mounts in response to tissue injury from within or invading microbes (8). It is now recognized that failure to engage resolution mechanisms could underlie persistent low-grade inflammation that is associated with many chronic diseases including rheumatoid arthritis, periodontal disease, asthma, diabetes, and inflammatory bowel disease (IBD), as well as neurological disorders such as Alzheimer's disease (5, 38, 44). Endogenous mediators and mechanisms involved in regulating inflammation and its resolution are of wide interest, and thus their tissue signature profiles may be useful in characterizing health and disease states, as well as in monitoring the design and impact of new treatments.
It is now appreciated that resolution of self-limited inflammation is an active process regulated by novel local chemical mediators and their receptors (for recent reviews, see Refs. 15, 31, 37, 43, 49). This laboratory uncovered new families of specialized pro-resolving mediators (SPM) termed resolvins, protectins, and maresins, each produced in self-limited inflammatory leukocyte-rich exudates. Their biosynthetic metabolomes are temporally regulated in the resolution phase of acute inflammation (10, 18, 39, 41). SPM and their respective metabolomes exert potent leukocyte-directed actions stimulating the key signs of resolution, namely, limiting further polymorphonuclear leukocyte (PMN) recruitment (cessation as stop signals) to the site, and enhance macrophage uptake of debris, bacteria, and apoptotic cells (reviewed in Refs. 6, 13, 42). In addition, each individual SPM evokes further characteristic properties within programmed resolution. For example, resolvin (Rv)E1 rescues failed phagocytic activities of human macrophages from periodontitis patients (13). D-series resolvins (i.e., RvD1, RvD2, and RvD5) each enhance bacterial containment by the host, thus lowering the dose of antibiotics needed to kill and clear bacteria (6). Maresin 1 (MaR1), from the maresin (MaR) pathway, stimulates resolution as well as tissue regeneration, and protectins improve influenza infection by directly inhibiting viral replication in mice (10, 29).
These resolution phase SPM and their metabolomes include resolvins, protectins, and maresins (10, 18, 39, 41, 42) as well as lipoxins (15, 42). These mediators counterregulate the actions of the classic proinflammatory initiators prostaglandins (PGs) and leukotrienes (LTs) (15, 37). Aspirin enhances production of the R-epimers of the resolvins and protectins that are longer acting. The stereo chemistries of conjugated double bonds and chirality of hydroxyl groups are directly related to potency; each is in the picogram-to-nanogram range (for review, see Ref. 42).
The stereochemical and physical properties of these potent mediators also dictate their chromatographic behavior and separation from their related naturally occurring biosynthetic isomers (10, 18, 39, 41, 42). In the present report we have operationalized and automated the identification of SPM and classic lipid mediator (LM) metabolomes with reference human tissues and increased sensitivity. By matching chromatographic behavior and tandem mass spectrometry (MS-MS) spectra from human tissues to those of authentic materials, we identified and profiled specific LM including n-3- and n-6-derived SPM, inflammatory LM (prostaglandins and LTB4), and their pathway-related isomers and markers. Moreover, these signature LM profiles were useful to assess changes in reference calibration tissues as well as changes with essential fatty acid (EFA) intake that can have functional consequences, such as increased bacterial phagocytosis.
MATERIALS AND METHODS
LC grade solvents (Fisher Scientific, Pittsburgh, PA), C18 solid-phase extraction columns (500 mg; Biotage, Uppsala, Sweden), Eclipse Plus C18 column (100 mm × 4.6 mm × 1.8 μm; Agilent, Santa Clara, CA), synthetic standards, and deuterated (d) internal standards were purchased from Cayman Chemical (Ann Arbor, MI). 15-epi-LXA4 was purchased from Calbiochem (Billerica, MA). RvE1, RvD3, 17-epi-RvD3, and 17-epi-PD1 were provided by Dr. N. A. Petasis as part of National Institutes of Health Grant P01GM095467. RvE3 was kindly provided by Dr. M. Arita (University of Tokyo). Biogenic standards were prepared for RvD5 and RvE2 as described previously (6). This study was conducted in accordance with Partners Human Research Committee Protocol 1999P001297. All participants gave written informed consent and were healthy volunteers who declared they had not taken medications including nonsteroidal anti-inflammatory drugs or ASA-containing products 10–14 days before venipuncture. This study was conducted in accordance with the Declaration of Helsinki. The tissues obtained from commercial sources were analyzed in accordance with Partners Human Research Committee Protocol 1999P001279 for discarded materials.
Capsules containing EFA (1 g), EPA (50%), and DHA (20%) were purchased from Sundown Naturals (Bohemia, NY), and ASA (81 mg) was purchased from CVS (Woonsocket, RI). BacLight green was purchased from Life Technologies (Grand Island, NY). Red blood cell lysis buffer was obtained from eBiosciences (San Diego, CA). Human serum was purchased from Lonza (Allendale, NJ) and Valley Biomedical (Winchester, VA). Each contained serum pooled from ∼100 different donors. A separate reference human plasma denoted SRM 1950 was purchased from the National Institute of Standards and Technology (NIST; Gaithersburg, MD). Lists of known metabolites in this human plasma are available (www.nist.gov). Also, individual plasma from healthy donors was purchased from Biological Specialty (Colmar, PA). Human lymph node tissues with patient information were purchased from Science Care (Phoenix, AZ). Also, three human lymph nodes and three spleen tissues along with patient information were purchased from Cooperative Human Tissue Network (Philadelphia, PA). These human tissues were snap frozen in liquid nitrogen and stored at −80°C before extraction for profiling. Fresh individual plasma and sera were prepared immediately following venipuncture. Plasma was collected with heparin (10 U/ml). Serum was isolated after 24-h coagulation at room temperature.
EFA and ASA intake, LM profiling, and whole blood phagocytosis.
Healthy volunteers took capsules containing EFA (1 g) and, 2 h later, ASA (81 mg). Venous blood (10 ml) was collected in heparin from each donor at t = 0 h and at 4 h (after EFA and 2 h after ASA intake). Plasma was obtained by centrifugation of heparinized blood (1,200 g, 10 min) and placed in 4 volumes of methanol before solid-phase extraction as described below.
Immediately after venipuncture, heparinized human whole blood (20 μl) was added to 70 μl of PBS++ (supplemented with Mg2+ and Ca2+) to assess phagocytosis, in a manner similar to that described previously (27), followed by addition of BacLight green-labeled Escherichia coli (10 μl, ∼2 × 10⁷ E. coli), giving a ratio ≈1:100 of leukocytes to E. coli. Briefly, incubations were carried out (37°C, 60 min). Red blood cell lysis buffer was added (1 ml, 10 min, room temperature), and pellets were collected by centrifugation (500 g, 4°C, 5 min) and fixed in 3% paraformaldehyde (100 μl). Fluorescence associated with phagocytes was monitored by flow cytometry (FACS CantoII; Becton Dickinson, San Jose, CA) (6). Results were analyzed using the FlowJo system (Treestar, Ashland, OR).
Automated targeted lipid mediator metabololipidomics.
Human tissues (spleen, ∼200 mg; lymph nodes, ∼100 mg; peripheral blood serum or plasma, 1 ml) were defrosted from −80°C on ice. Tissues were weighed and gently dispersed with a glass Dounce. Internal labeled standards d8-5S-HETE, d4-LTB4, d5-LXA4, d5-RvD2, and d4-PGE2 (500 pg each) in 4 ml of ice-cold methanol were added to each sample to facilitate quantification and sample recovery (see Fig. 1). Next, samples were held at −20°C for 45 min to allow protein precipitation and then centrifuged (1,200 g, 4°C, 10 min). Supernatants were collected and brought to less than 1 ml of methanol content in a gentle stream of nitrogen gas onto an automated evaporation system (TurboVap LV, Biotage). Samples were then placed into an automated extraction system (RapidTrace, Biotage) and products extracted as follows. Solid-phase C18 cartridges were equilibrated with 3 ml of methanol and 6 ml of H2O. Nine milliliters of H2O (pH 3.5, HCl) were then added to the samples, and the acidified solutions were rapidly loaded onto the conditioned C18 columns that were washed with 4 ml of H2O to neutralize the acid. Next, 5 ml of hexane were added and products eluted with 9 ml of methyl formate. Products were brought to dryness using the automated evaporation system (TurboVap LV, Biotage) and immediately suspended in methanol-water (50:50 vol/vol) for LC-MS-MS automated injections.
Fig. 1.

Operationalization of lipid mediator (LM) metabololipidomics. Synthetic and authentic deuterated internal standards were added to samples before automated extraction by solid-phase extraction. LM were investigated by liquid chromatography-tandem mass spectrometry (LC-MS-MS) using targeted multiple reaction monitoring (MRM) coupled with information-dependent acquisition-enhanced product ion (EPI) data acquisition or data-dependent scan/enhance MS scan (EMS) or MSn. Identification of bioactive and biosynthetic pathway products was performed by matching retention time (RT) and at least 6 diagnostic ions from the spectrum with our LM database (see materials and methods for details). The LM and specialized pro-resolving mediator (SPM) database was constructed with synthetic and authentic standards, and quantitation was carried out using linear regression compared with standard curves from the LM database. Interrelationship(s) for identified mediators within each condition and between different conditions was further investigated by computational analysis that included principal component and cluster analyses.
The LC-MS-MS system, a Shimadzu LC-20AD HPLC and a Shimadzu SIL-20AC autoinjector (Shimadzu, Kyoto, Japan), paired with a QTrap 6500 (ABSciex, Framingham, MA), was routinely employed. An Eclipse Plus C18 column (100 mm × 4.6 mm × 1.8 μm; Agilent) was kept in a column oven maintained at 50°C (ThermaSphere TS-130; Phenomenex, Torrance, CA), and LM were eluted with a mobile phase consisting of methanol-water-acetic acid of 55:45:0.01 (vol/vol/vol) that was ramped to 85:15:0.01 (vol/vol/vol) over 10 min and then to 98:2:0.01 (vol/vol/vol) for the next 8 min. This was subsequently maintained at 98:2:0.01 (vol/vol/vol) for 2 min, and the flow rate was maintained at 0.4 ml/min. The QTrap 6500 was operated in negative ionization mode using scheduled multiple reaction monitoring (MRM) coupled with information-dependent acquisition (IDA) and an enhanced product ion scan (EPI) (9). The scheduled MRM window was 90 s, and each LM parameter was optimized individually.
To monitor each LM and its respective pathway, an MRM method was developed with diagnostic ion fragments and identification using recently published criteria (9), including matching retention time (RT) to synthetic and authentic materials and at least six diagnostic ions for each LM. Calibration curves were obtained for each using authentic compound mixtures and deuterium-labeled LM at 3.12, 6.25, 12.5, 25, 50, 100, and 200 pg (e.g., d8-5S-HETE, d4-LTB4, d5-LXA4, d5-RvD2). Linear calibration curves were obtained for each LM, which gave r2 values of 0.98–0.99. Internal standard recoveries, interference of the matrix, and limit of detection (range of 20–220 fg for the QTrap 6500 in tissue and in biological matrix) were determined. Chemical stability of endogenous bioactive LM in 250 μl of serum, stored at −20°C, was assessed with or without 4 volumes of methanol. Endogenous SPM were stable with methanol for 5 days. This showed that with proper storage conditions, degradation and losses are minimized. After 4 wk of storage without methanol, SPM amounts showed a range of 25–85% losses, indicating the necessity for optimized storage conditions. Additional parameters regarding instrumentation and data acquisition such as individual LM parameter optimization, linearity, precision, and accuracy can be found elsewhere (see Endnote).
Statistical analysis.
For multivariate statistical analysis, principal component analysis (PCA) and partial least squares-discriminant analysis (PLS-DA) (20) were performed using SIMCA 13.0.3 software (Umetrics, Umea, Sweden) following mean centering and unit variance scaling of LM amounts. PCA is a multivariate projection designed to identify the systematic variation in a data matrix (the overall bioactive LM profile of each sample) with a lower dimensional plane. PLS-DA is based on a linear multivariate model to find the variables that contribute to class separation of expected cluster. The score plot shows the systematic clusters among the observations (closer plots presenting higher similarity in the data matrix). Loading plots describe the magnitude and the manner (positive or negative correlation) in which the measured LM-SPM contribute the cluster separation in the score plot (20). PCA is an unbiased method, which provides visual representation of the data set with score plots and loading plots. Hypothetical relationships within the data set cannot be investigated using PCA. PLS-DA allows investigators to specify an expected set of biological data sets (20). Both PCA and PLS-DA are descriptive analyses. For univariate statistical analysis, Wilcoxon matched-pairs signed rank test was employed using PRISM 6.0 software (San Diego, CA), and P values ≤0.05 were considered significant.
RESULTS
EFA bioactive metabolomes: SPM in human peripheral blood.
To investigate LM-SPM in human peripheral blood, we carried out targeted LM metabololipidomics using an LC-MS-MS system (see Fig. 1). To assess potential losses during processing as well as to normalize RT inter-run variations, we employed deuterated internal standards that marked specific chromatographic regions of interest. Using this approach, we profiled human sera, where each sample was a composite of ∼100 individual donors. In these samples, we identified LM from each of the DHA, EPA, and AA bioactive metabolomes (complete LM stereochemistry and annotated biological functions are given in Ref. 9; see Table S1 therein). In serum, the SPM included endogenous RvD1, RvD2, RvD3, PD1, MaR1, and LX (Table 1). Each LM and biosynthetic pathway product was identified in accordance with published criteria (9, 42) that included matching RT (Fig. 2) and at least six characteristic and diagnostic ions. This is illustrated, for example, with tissue-derived endogenous RvD1–RvD6, protectins, maresins, and classic eicosanoids (see Figs. 3, 4, and 5).
Table 1.
Human peripheral blood LM levels
| IS Used | LM in Human Peripheral Blood |
||
|---|---|---|---|
| Commercial human serum | NIST human plasma SRM 1950 | ||
| DHA bioactive metabolome | |||
| RvD1 | d5-RvD2 | 30.9 ± 7.0 | 2.6 ± 0.1 |
| 17-epi-RvD1 | d5-RvD2 | 40.7 ± 13.9 | nd |
| RvD2 | d5-RvD2 | 42.6 ± 13.9 | nd |
| RvD3 | d5-RvD2 | 34.3 ± 9.4 | nd |
| 17-epi-RvD3 | d5-RvD2 | 13.3 ± 4.6 | nd |
| RvD5 | d4-LTB4 | 86.8 ± 42.2 | 1.2 ± 0.3 |
| RvD6 | d4-LTB4 | 687.0 ± 156.2 | 58.1 ± 5.2 |
| PD1 | d4-LTB4 | 5.6 ± 3.4 | nd |
| 17-epi-PD1 | d4-LTB4 | 7.7 ± 1.4 | nd |
| Δ15-trans-PD1 | d4-LTB4 | 207.9 ± 61.6 | nd |
| 10-epi,Δ15-trans-PD1 | d4-LTB4 | 223.1 ± 33.1 | nd |
| 10S,17S-diHDHA | d4-LTB4 | 227.4 ± 68.2 | nd |
| 22-OH-PD1 | d4-LTB4 | nd | nd |
| 22-COOH-PD1 | d4-LTB4 | nd | nd |
| MaR1 | d4-LTB4 | 21.2 ± 7.2 | nd |
| Δ12-trans-MaR1 | d4-LTB4 | 241.8 ± 64.6 | nd |
| 7-epi,Δ12-trans-MaR1 | d4-LTB4 | 101.8 ± 42.7 | nd |
| 7S,14S-diHDHA | d4-LTB4 | 131.1 ± 52.3 | nd |
| 13R,14S-diHDHA | d4-LTB4 | 55.6 ± 22.3 | nd |
| 4S,14S-diHDHA | d4-LTB4 | 1,579.7 ± 282.8 | 69.6 ± 6.5 |
| 14S,21-diHDHA | d4-LTB4 | 122.9 ± 2.7 | nd |
| EPA bioactive metabolome | |||
| RvE1 | d5-LXA4 | 12.5 ± 2.5 | nd |
| RvE2 | d4-LTB4 | 2,212.6 ± 1,587.6 | 130.6 ± 7.8 |
| RvE3 | d4-LTB4 | 361.8 ± 187.3 | nd |
| LXA5 | d5-LXA4 | nd | nd |
| LXB5 | d5-LXA4 | nd | nd |
| 5S,15S-diHEPE | d4-LTB4 | 1,746.1 ± 627.6 | nd |
| AA bioactive metabolome | |||
| LXA4 | d5-LXA4 | 115.6 ± 45.5 | nd |
| 15-epi-LXA4 | d5-LXA4 | 59.2 ± 49.6 | nd |
| LXB4 | d5-LXA4 | 48.7 ± 25.2 | nd |
| 15-epi-LXB4 | d5-LXA4 | 106.6 ± 67.0 | nd |
| 5S,15S-diHETE | d4-LTB4 | 789.4 ± 253.4 | 13.3 ± 1.1 |
| LTB4 | d4-LTB4 | nd | 3.4 ± 0.2 |
| Δ6-trans-LTB4 | d4-LTB4 | 744.0 ± 119.9 | 1.7 ± 0.1 |
| 12-epi,Δ6-trans-LTB4 | d4-LTB4 | 662.5 ± 193.3 | 3.8 ± 0.3 |
| 5S,12S-diHETE | d4-LTB4 | 2,162.6 ± 515.5 | 22.9 ± 0.7 |
| 5S,6R-diHETE | d4-LTB4 | 150.5 ± 51.3 | nd |
| 20-OH-LTB4 | d4-LTB4 | 4.6 ± 3.0 | 2.4 ± 0.4 |
| 20-COOH-LTB4 | d4-LTB4 | nd | nd |
| PGD2 | d4-PGE2 | 271.0 ± 57.7 | 7.0 ± 0.3 |
| PGE2 | d4-PGE2 | 72.5 ± 10.9 | 4.1 ± 0.2 |
| PGF2α | d4-PGE2 | 73.9 ± 23.2 | 4.8 ± 0.4 |
| TxB2 | d4-PGE2 | 1,061.0 ± 1,036.3 | nd |
LM levels in human serum (each pooled serum was a composite of ∼100 healthy individuals) compared with LM in human plasma from NIST standard reference material (SRM 1950; composite plasma from 100 healthy individuals). Values are means ± SE (n = 3 for pooled commercial human serum and d = 3 for SRM 1950) in pg/ml. Samples were extracted and LM levels investigated using LM metabololipidomics (see materials and methods for details). IS, internal standard; LOD, limit of detection; nd, not detected (below IS limit of detection).
Fig. 2.

Endogenous LM-SPM in human peripheral blood. MRM of signature ion pairs was obtained using the precursor ion (Q1) and a characteristic product ion (Q3) for each LM. Bioactive LM, isomers, and pathway markers were identified in human serum from docosahexaenoic acid (DHA) bioactive metabolome, including D-series resolvins, maresins, and protectins (A); eicosapentaenoic acid (EPA) bioactive metabolome, including EPA-derived lipoxins and E-series resolvins (B); and arachidonic acid (AA) bioactive metabolome, including AA-derived lipoxins, leukotrienes, and prostanoids (C). Data are representative of 3 different pooled sera, each from >100 individual healthy donors. See Glossary for definitions; m/z, mass-to-charge ratio.
Fig. 3.

LM-SPM MS-MS spectra from DHA bioactive metabolome identified in human serum. Characteristic MS-MS fragmentation patterns and diagnostic ions were employed for identification. MS-MS spectra are from the D-series resolvins, maresins, and protectins. M-H, molecular ion. Data are representative MS-MS spectra for SPM and products from Fig. 2.
Fig. 4.

LM-SPM MS-MS spectra from EPA bioactive metabolome identified in human serum. Characteristic MS-MS fragmentation patterns and diagnostic ions were employed for identification. MS-MS spectra are from the EPA-derived 5S,15S-diHEPE and E-series resolvins (RvE1, RvE2, and RvE3). Data are representative MS-MS spectra for SPM and products from Fig. 2.
Fig. 5.

LM-SPM MS-MS spectra from AA bioactive metabolome identified in human serum. Characteristic MS-MS fragmentation patterns and diagnostic ions were employed for identification. MS-MS spectra are from the lipoxins, prostanoids (PGD2, PGE2, and PGF2α), the thromboxane hydrolysis product TxB2, the leukotriene B4 metabolite 20-OH-LTB4, and 5S,12S-diHETE. Data are representative MS-MS spectra for products from Fig. 2.
LM quantification was achieved using targeted MRM of specific ion pairs Q1 (parent ion) to Q3 (diagnostic daughter ion) (9). In human serum composites (Table 1), the DHA bioactive metabolome represented ∼30.7% of targeted SPM and/or pathway markers. From these, we identified the D-series resolvin RvD1 (30.9 ± 7.0 pg/ml) and its 17R-epimer (40.7 ± 13.9 pg/ml), the protectin PD1 (5.6 ± 3.4 pg/ml) along with its double dioxygenation isomer 10S,17S-diHDHA (227.4 ± 68.2 pg/ml; a.k.a. PDx), and the maresins MaR1 (21.2 ± 7.2 pg/ml) and 4S,14S-diHDHA (1,579.7 ± 282.8 pg/ml). The EPA bioactive metabolome in human serum was ∼25.9% of targeted SPM, in which we identified RvE2 (2,212.6 ± 1,587.6 pg/ml). Each SPM was present in amounts commensurate with its known bioactions (see Ref. 9 and Table S1 therein). The AA bioactive metabolome comprised ∼43.4% of the targeted LM; we identified the lipoxins LXA4 (115.6 ± 45.5 pg/ml) and LXB4 (48.7 ± 25.2 pg/ml), as well as the double dioxygenation isomer of LTB4, 5S,12S-diHETE (2,162.6 ± 515.5 pg/ml), PGE2 (72.5 ± 10.9 pg/ml), and PGD2 (271.0 ± 57.7 pg/ml). Of note, nonesterified precursors and monohydroxy EFA products that can serve as biosynthetic pathway markers of utilization were also identified (n = 4).
We next assessed human pooled plasma from the standard reference material (SRM 1950) obtained from NIST (www.nist.gov), available to all investigators (Table 1). This material contained plasma from 100 individuals with an equal number of men and women ages 40–50 yr. The racial distribution reflected that of the U.S. population (for certificate of reference, see www.nist.gov). In these, we identified the DHA, EPA, and AA bioactive metabolomes, which represented 40.3, 40.1, and 19.6%, respectively, of the targeted LM pathways. From DHA metabolome, we identified the D-series resolvins RvD1 (2.6 ± 0.1 pg/ml), RvD5 (1.2 ± 0.3 pg/ml), and RvD6 (58.1 ± 5.2 pg/ml) and the maresin 4S,14S-diHDHA. From AA metabolome, we identified the 5-LOX product LTB4 as well as the prostaglandins PGD2 and PGE2. Human plasma contained ∼10–100 times less LM amounts than serum recoveries, suggesting that upon activation of peripheral blood, bioactive LM-SPM increase. An LM index was obtained by taking the ratio of the SPM summation, i.e., LX, D- and E-series Rv, MaR1, PD1, and related pathway isomers (i.e., epoxide intermediate hydrolase products such as Δ12-trans-MaR1 and 7-epi-Δ12-trans-MaR1) divided by the summation of prostanoids and leukotrienes. This value, 5.4, was higher in SRM 1950 plasma compared with the value 2.2 obtained for serum.
LM-SPM signature profiles from human peripheral blood.
Data-driven modeling such as PCA is useful to interrogate large biological data sets such as metabolomics (20). LM-SPM profiles obtained with SRM 1950 (human plasma composite, 100 individuals) and commercial human serum composites (∼300 individuals, ∼100 subjects in each composite), as well as fresh plasma and serum from healthy individual donors, were assessed using PCA (Fig. 6). LM are displayed in three-dimensional space consisting of three principal components. They were calculated from the systematic variation in the data matrix consisting of the overall bioactive LM identified in each sample. This included ∼75% of the variation of the entire data set (n = 42, where n = each LC-MS-MS profile). The gray ellipse in the score plot (Fig. 6A) denotes 95% confidence regions. This region diagnoses strong outliers based on the use of Hotelling's T-squared equation (http://www.itl.nist.gov/div898/handbook/). Principal component 1 showed distinct separation between the plasma cluster and serum cluster. The loading plot (Fig. 6B) demonstrates that the serum cluster displayed lower LTB4 levels and higher levels of lipoxins, resolvins, protectins, maresins, prostaglandins, and thromboxane compared with plasma for both SRM 1950 and fresh plasma. Of note, plasma samples showed a tight cluster of LM, whereas serum was more dispersed (Fig. 6).
Fig. 6.
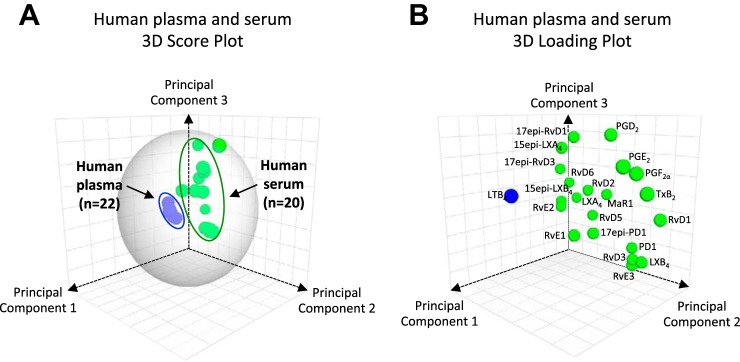
Human LM-SPM signature profiles: principal component analysis. For human plasma from the National Institute of Standards and Technology (NIST) standard reference material (SRM 1950, a composite plasma from 100 healthy individuals), individual human plasma, commercial human serum (each a composite of ∼100 healthy individuals, ∼300 subjects total), and individual human serum, LM-SPM profiles were obtained using LM metabololipidomics. A: 3-dimensional score plot of human plasma with healthy donors from NIST SRM 1950 (100 subjects; blue circles, n = 22) compared with human serum (318 subjects, composites plus fresh serum; green circles, n = 20). B: 3-dimensional loading plot. Gray ellipse in the score plot (A) denotes 95% confidence regions (see materials and methods).
Human lymphoid SPM.
As a demonstration of the potential utility of this approach using targeted LM metabololipidomics, we investigated endogenous LM in human lymph nodes (Fig. 7A) and spleens (Fig. 7B) given their roles in immunity (see Table 2). Each bioactive LM, SPM, and/or pathway marker is identified as in Fig. 1 and Table 1. In human axillary lymph nodes, we identified D-series resolvins RvD1 (5.5–48.6 pg/100 mg tissue), RvD5 (1.9–9.4 pg/100 mg tissue), and RvD6 as well as the E-series resolvin RvE3. In human lymph nodes, we also identified the anti-inflammatory (40) LXA4 (16.4–114.3 pg/100 mg tissue) and LXB4 (9.9–101.1 pg/100 mg tissue), as well as proinflammatory LTB4 (0.7–3.8 pg/100 mg tissue) and its related double lipoxygenase product, 5S,12S-diHETE (3.0–50.8 pg/100 mg tissue). In these, we also identified prostanoids, with PGE2 levels significantly higher than levels of other prostanoids.
Fig. 7.

Human lymphoid tissues: LM-SPM profiles. LM obtained from human axillary lymph nodes and spleens were identified using LM metabololipidomics (as in Fig. 1). A and B: MRM chromatograms from human lymph nodes (A) and human spleens (B), obtained using the diagnostic ion pairs (Q1) and a characteristic product ion (Q3) for each SPM, e.g., lipoxins, E- and D-series resolvins, maresins, and protectins. Cumulative levels for individual LM families are depicted as a function of color intensity. Color scales (white to blue) are set from 0 to 200 pg/100 mg tissue. Each chromatogram is representative of n = 6 lymph nodes or n = 3 spleens. Patient demographics are reported in Table 2.
Table 2.
Patient demographics from lymphoid tissues donors
| Organ | Sex | Race | Age, yr | Diagnosis | Origin of Organ |
|---|---|---|---|---|---|
| Spleen | |||||
| 1 | M | N/A | 34 | Leukemia and sepsis | NA |
| 2 | M | Caucasian | 50 | Heart failure and sepsis | NA |
| 3 | F | Caucasian | 61 | Pneumonia and sepsis | NA |
| Lymph nodes | |||||
| 1 | F | Caucasian | 64 | Stage IV breast cancer | Axillary |
| 2 | M | Caucasian | 89 | Cardiorespiratory failure | Axillary |
| 3 | F | Caucasian | 75 | Craniocerebral injuries | Axillary |
| 4 | F | Caucasian | 43 | Crohn disease | Abdominal |
| 5 | M | Caucasian | 62 | Heart failure | N/A |
| 6 | F | Caucasian | 57 | Liver cirrhosis (alcoholic) | Cervical |
Human tissues were harvested after death, snap frozen in liquid nitrogen, and stored at −80°C before extraction for profiling.
M, male; F, female, N/A, not available (unknown); NA, not applicable.
In human spleens, we identified LM from each metabolome. These included the D-series resolvin RvD5, the protectins PD1 and 10S,17S-diHDHA, and the maresin MaR1 (22.6 pg/100 mg tissue) and its double dioxygenation product, 7S,14S-diHDHA (46.1 pg/100 mg tissue). In these, we identified E-series resolvins RvE1, RvE2 and RvE3 as well as LXA4 (5.7–122.9 pg/100 mg tissues). Of the prostanoids, we identified PGD2, PGE2, and PGF2α. These results demonstrated that omega-3-derived SPM from the three main bioactive metabolomes and eicosanoids are present in human lymphoid tissues.
LM-SPM signature profiles in human plasma and phagocytosis.
Next, to demonstrate the utility of this approach and the new methods, we questioned whether EFA and low-dose ASA intake could impact circulating LM-SPM in a small group of healthy human volunteers (n = 10) (Fig. 8, Tables 3 and 4). Plasma LM profiles of healthy volunteers after EPA, DHA, and ASA intake were investigated using LC-MS-MS metabololipidomics (Fig. 8 and Table 3), and the functional impact was assessed in the same whole blood from each subject using bacterial phagocytosis. Because each SPM is known to increase bacterial uptake by phagocytes at concentrations in the picomolar-to-nanomolar range (6, 9), phagocytosis of E. coli was assessed (Fig. 8C). Of note, fresh plasma from individual healthy volunteers displayed LM signature profiles similar to those present in the NIST SRM 1950 (see Tables 1 and 3). To investigate whether EFA and ASA intake are causally related to changes in LM-SPM profile, we carried out PLS-DA with results from 10 healthy subjects. The two principal components, calculated using the data matrix, showed clear separation between the time 0 cluster and the 4-h cluster. In addition, a PLS-DA loading plot demonstrated a positive association of n-3 EFA and ASA intake with elevated levels of RvD1, RvD2, 17-epi-PD1, RvE2, and RvE3 (Table 3). TxB2 levels decreased ∼75% (Table 3). This reduction is in accordance with ASA mode and duration of action in humans (17). With EFA, prostaglandin and TxB2 levels were also reduced (n = 4; data not shown). Phagocytosis of live E. coli by phagocytes in whole blood increased at 4 h (Fig. 8C) and positively correlated (r2 = 0.77) with increased levels of RvD1, RvD2, RvE2, RvE3, and 17-epi-PD1 (Fig. 8D).
Fig. 8.

Human plasma LM-SPM signature profiles and increased phagocytosis. Healthy volunteers were given capsules containing essential fatty acid (EFA). After 2 h, 81 mg of acetylsalicylic acid (ASA) were taken, and heparinized blood was collected from each subject at 4 h. Plasma LM profiles were subject to LM metabololipidomics (0 h) and EFA and ASA intake (4 h; see materials and methods for details). A: 2-dimensional score plot of human plasma at 0 and 4 h. B: 2-dimensional loading plot. Gray ellipse in the score plots denotes 95% confidence regions; n = 10 healthy individual donors. C: phagocytosis in whole blood. Fresh heparinized whole blood samples were split and incubated (20 μl, 37°C, 60 min) with BacLight green-labeled Escherichia coli (∼2 × 10⁷ colony-forming units). Phagocytosis was monitored by flow cytometry (see materials and methods). Results are expressed as %increase in mean fluorescence intensity (MFI); n = 10 healthy subjects. ***P = 0.001, 0 h vs. 4 h. Inset: representative histograms of phagocytosis in whole blood. D: positive correlation of specific SPM and phagocytosis in human peripheral blood using partial least squares-discriminant analysis from results in Table 3 (n = 10 healthy subjects). Healthy donor demographics are reported in Table 4.
Table 3.
Human plasma LM-SPM signature profiles: impact of EFA intake
| IS Used | LOD of IS in Matrix, pg | LM in Human Plasma |
|||
|---|---|---|---|---|---|
| 0 h | 4 h | %Change | |||
| DHA bioactive metabolome | |||||
| RvD1 | d5-RvD2 | 0.09 | 3.7 ± 1.0 | 5.3 ± 1.3 (P = 0.15) | +43 |
| 17-epi-RvD1 | d5-RvD2 | 0.09 | 0.9 ± 0.6 | 0.1 ± 0.1 | −89 |
| RvD2 | d5-RvD2 | 0.09 | 2.8 ± 1.5 | 4.0 ± 1.6 (P = 0.23) | +43 |
| RvD3 | d5-RvD2 | 0.09 | 0.2 ± 0.1 | 0.1 ± 0.1 | −50 |
| 17-epi-RvD3 | d5-RvD2 | 0.09 | 0.3 ± 0.2 | 0.1 ± 0.1 | −67 |
| RvD5 | d4-LTB4 | 0.22 | 0.1 ± 0.1 | 0.1 ± 0.1 | 0 |
| RvD6 | d4-LTB4 | 0.22 | 0.5 ± 0.3 | 0.2 ± 0.1 | −60 |
| PD1 | d4-LTB4 | 0.22 | nd | nd | |
| 17-epi-PD1 | d4-LTB4 | 0.22 | 0.4 ± 0.2 | 1.2 ± 0.5† | +200 |
| Δ15-trans-PD1 | d4-LTB4 | 0.22 | nd | nd | |
| 10-epi,Δ15-trans-PD1 | d4-LTB4 | 0.22 | nd | nd | |
| 10S,17S-diHDHA | d4-LTB4 | 0.22 | nd | nd | |
| 22-OH-PD1 | d4-LTB4 | 0.22 | nd | nd | |
| 22-COOH-PD1 | d4-LTB4 | 0.22 | nd | nd | |
| MaR1 | d4-LTB4 | 0.22 | nd | nd | |
| Δ12-trans-MaR1 | d4-LTB4 | 0.22 | nd | nd | |
| 7-epi,Δ12-trans-MaR1 | d4-LTB4 | 0.22 | nd | nd | |
| 7S,14S-diHDHA | d4-LTB4 | 0.22 | nd | nd | |
| 13R,14S-diHDHA | d4-LTB4 | 0.22 | nd | nd | |
| 4S,14S-diHDHA | d4-LTB4 | 0.22 | 0.2 ± 0.2 | 0.3 ± 0.2 | +50 |
| 14S,21-diHDHA | d4-LTB4 | 0.22 | nd | nd | |
| EPA bioactive metabolome | |||||
| RvE1 | d5-LXA4 | 0.05 | 8.8 ± 6.3 | 7.3 ± 4.7 | −17 |
| RvE2 | d4-LTB4 | 0.22 | 1.7 ± 1.1 | 4.9 ± 2.4 (P = 0.07) | +188 |
| RvE3 | d4-LTB4 | 0.22 | 8.6 ± 2.6 | 11.8 ± 3.7 (P = 0.08) | +37 |
| LXA5 | d5-LXA4 | 0.05 | nd | nd | |
| LXB5 | d5-LXA4 | 0.05 | nd | nd | |
| 5S,15S-diHEPE | d4-LTB4 | 0.22 | 0.3 ± 0.2 | 0.3 ± 0.2 | 0 |
| AA bioactive metabolome | |||||
| LXA4 | d5-LXA4 | 0.05 | nd | nd | |
| 15-epi-LXA4 | d5-LXA4 | 0.05 | nd | 0.2 ± 0.2 | |
| LXB4 | d5-LXA4 | 0.05 | 0.4 ± 0.3 | 0.2 ± 0.1 | −50 |
| 15-epi-LXB4 | d5-LXA4 | 0.05 | 1.0 ± 0.3 | 0.3 ± 0.2 | −70 |
| 5S,15S-diHETE | d4-LTB4 | 0.22 | 2.0 ± 0.5 | 1.9 ± 0.7 | −5 |
| LTB4 | d4-LTB4 | 0.22 | 0.3 ± 0.1 | 0.3 ± 0.1 | 0 |
| Δ6-trans-LTB4 | d4-LTB4 | 0.22 | 0.2 ± 0.1 | 0.2 ± 0.1 | 0 |
| 12-epi,Δ6-trans-LTB4 | d4-LTB4 | 0.22 | 0.3 ± 0.1 | 0.5 ± 0.2 | +66 |
| 5S,12S-diHETE | d4-LTB4 | 0.22 | 1.3 ± 0.5 | 0.5 ± 0.2* | −62 |
| 5S,6R-diHETE | d4-LTB4 | 0.22 | 0.8 ± 0.3 | 1.0 ± 0.4 | +25 |
| 20-OH-LTB4 | d4-LTB4 | 0.22 | 1.7 ± 1.7 | 0.3 ± 0.1 | −82 |
| 20-COOH-LTB4 | d4-LTB4 | 0.22 | nd | nd | |
| PGD2 | d4-PGE2 | 0.23 | 5.3 ± 1.5 | 2.3 ± 0.5* | −57 |
| PGE2 | d4-PGE2 | 0.23 | 7.6 ± 1.7 | 5.2 ± 1.1 | −32 |
| PGF2α | d4-PGE2 | 0.23 | 4.7 ± 1.0 | 2.0 ± 0.6* | −58 |
| TxB2 | d4-PGE2 | 0.23 | 71.9 ± 24.0 | 18.2 ± 8.5† | −75 |
Values are LM-specialized pro-resolving mediator (SPM) levels detected in human plasma (means ± SE, n = 10 individuals; in pg/ml) and %change from time 0. Healthy volunteers were given essential fatty acid (EFA) and, 2 h later, 81 mg of acetylsalicylic acid (ASA). Heparinized blood was collected, and plasma LM profiles were investigated using LM metabololipidomics at time 0 and after (4 h) EFA and ASA supplement (see materials and methods for details).
P < 0.05;
P < 0.01, 0 h vs. 4 h.
Table 4.
Characteristics of healthy volunteers
| Healthy Volunteers | |
|---|---|
| Sex | |
| Male | 6 |
| Female | 4 |
| Race | |
| Caucasian | 8 |
| Asian | 2 |
| Age, yr | 34 ± 2 |
| Weight, kg | 69 ± 2 |
| Height, cm | 172 ± 1 |
| BMI, kg/m2 | 23.1 ± 0.7 |
Values are demographics (means ± SE, n = 10 individuals) for the healthy volunteers whose plasma profiles are shown in Fig. 8. Healthy volunteers were asked not to change their dietary habits and not to take any medication or supplement over the 15 days preceding the experimental procedure. BMI, body mass index.
DISCUSSION
The present report documents an approach for operationalizing the identification and profiling of LM-SPM. These mediators are functionally characterized in inflammation and its resolution (for functional annotation of LM and SPM actions, see Ref. 9 and Table S1 therein). Their biosynthetic pathways give rise to specific stereochemistry for each of these local mediators (42) and thus specific signature profiles in human tissues (Figs. 2–8). To this end, we used LC-MS-MS-based LM metabololipidomics together with authentic biologically derived and synthetic standards to establish signature profiles with human tissues. Results from earlier studies established that eicosanoids derived from AA are potent proinflammatory mediators (15, 36), except the lipoxins, which display local anti-inflammatory and pro-resolving actions (3, 42). Our earlier studies employed a QTrap 3200 (ABSciex) system with a limit of detection of ∼10 pg for SPM (6, 7). In the present approach, we employed a QTrap 6500 (ABSciex) system with optimized parameters and additional deuterated internal standards permitting limits of detection of ∼0.1 pg, for example, SPM within plasma matrix, and limits to 20 fg with the mobile phase. Also, the present approach establishes rigorous identification criteria for the resolvin, protectin, and maresin families of n-3-derived local SPM from human peripheral blood (serum and plasma) and other tissues employing MS-MS-based profiling of their biosynthetic pathways.
The SPM as well as LTB4 and prostanoids were identified in these tissues at levels commensurate with their known bioactive ranges in vivo (ng levels; also see Ref. 9, Table S1 within, and Ref. 42). For example, results of the present experiments indicate that LXA4 was present in human peripheral blood serum and lymphoid tissues (i.e., spleen and lymph nodes); also present were RvD1, RvD2, RvD3, and RvD5, as well as the E-series resolvins RvE1, RvE2, and RvE3. RvE3 is a newly identified bioactive resolvin (19). Also, D-series resolvins RvD1 and RvD2 were recently identified with the use of MS-based methods in human blood samples (26), as well as E-series RvE1 and RvE2 (32). With the present new approach, the relationship(s) between each of these mediators and their biosynthetic pathways can be assessed. Hence, bioactive mediators from EFA including each of the AA, DHA, and EPA bioactive metabolomes are amenable to profiling from tissues; their respective relationships and summation index appear to provide information regarding the potential inflammatory and/or resolution status of a given target tissue (see Tables 1 and 3).
Biosynthesis of the potent EFA-derived mediators involves epoxide-containing intermediates (15, 32, 37, 39, 43). In the case of LTA4, the epoxide intermediate is precursor to stereochemically defined LTB4, which reflects its enzymatic formation. In parallel, the nonenzymatic aqueous hydrolysis of the epoxide LTA4 leads to two major isomers (5,12-dihydroxyeicosatetraenoic acid) and two minor isomers (5,6-vicinal diols) (36). Thus the evaluation and relationship between LTB4 and its nonenzymatic related isomers gives a signature profile indicative of the 5-LOX biosynthesis of LTA4. In this regard, 5-HETE, which is produced from the 5-hydroperoxyeicosatetraenoic acid (5-HpETE) intermediate in this leukotriene pathway, can be used as a biosynthetic pathway biomarker reflecting its reduction from 5-HpETE in the AA metabolome. In the SPM metabolomes, 17-HDHA serves as a marker of the biosynthetic conversion of DHA via, for example, human 15-lipoxygenase type I for D-series resolvins and protectins (41; reviewed in Ref. 42). Thus the relative amounts of each individual bioactive LM-SPM, their biosynthetic isomers (i.e., Δ12-trans-MaR1, Δ15-trans-PD1), and biosynthetic pathway markers (such as 5-HETE, 12-HETE, 17-HDHA, 14-HDHA) provide a LM-SPM signature that reflects the status of a particular organ and/or phenotype.
In addition to resolving inflammatory exudates (41), the SPM are also produced by human peripheral blood leukocytes (reviewed in Refs. 32 and 42). Using an earlier LM profiling approach with a QTrap 5500 (ABSciex), we found that distinct human macrophage subtypes (M1 and M2 subtypes) display characteristic LM profiles that are regulated during efferocytosis (9). Human PMN also display distinct LM profiles, with activated PMN producing a proinflammatory LM profile, whereas apoptotic PMN display a pro-resolving LM profile (9). Therefore, the present automated and operationalized approach using a QTrap 6500 documented in this article can also be used with a wide range of cell types and tissues. Titos et al. (46) showed that the inhibition of 5-LOX pathway in rat Kupffer cell leads to apoptosis, therefore demonstrating a key role for bioactive LM. The present approach could be used for profiling Kupffer cells and other tissues relevant to fatty liver disease (24, 47). Along these lines, human adipose tissue was also recently profiled using a QTrap 3200 (ABSciex) without automation, and RvD1, RvD2, and PD1, as well as LXA4, were identified. PD1, which stimulates adiponectin in adipose tissue, was decreased in subcutaneous fat from patients with peripheral vascular disease (7).
In samples obtained from humans, SPM levels are substantially elevated with increased n-3 EFA intake (26). Recently, high levels of the specialized pro-resolving mediators (resolvins and protectins) as well as lipoxins were also identified in human milk (ng/ml range) (48). These levels are orders of magnitude higher than those observed in peripheral blood (Table 1) obtained from healthy individuals, suggesting that delivery of SPM to neonates may be functionally relevant in newborn host defense and development. High levels of resolvins and protectins are also reported in murine placenta that increase with n-3 EFA feeding (21). From our present results (Fig. 7), human pathological lymphoid tissues gave lipoxins, E-series resolvins, and DHA-derived SPM (resolvins, protectins, and maresins). The SPM amounts obtained from these organs are commensurate with their bioactions, which are in the picogram-to-nanogram range in vivo in animal models, and with isolated human cells (32, 41, 42).
Of interest, when comparing human serum and plasma, we found 10–100 times higher LM in serum (Table 1, Fig. 2). Because clot formation at the site of injury is critical in reestablishing homeostasis, local increases in LM can promote clearance of invading microbes and apoptotic cell debris (14, 32) as well as wound healing (10, 16). Of note, we also identified SPM epimers with a hydroxyl group at carbon-15 (lipoxins) or carbon-17 (resolvins and protectins) in predominantly the R configuration (42). Biosynthesis of these epimers is enhanced by ASA, where acetylation of COX-2 leads to insertion of molecular oxygen in the R chirality (1, 32, 39, 41). R chirality can also arise in small amounts from lipoxygenases, which generally insert molecular oxygen in the S configuration, with less in the R configuration. Identification of these in human commercial serum may arise from undeclared consumption of aspirin (ASA) or ASA-containing products by volunteers or from statin use, which also enhances these pathways (2). Another route for the production of these R-containing SPM can arise via P-450 enzymes, which insert oxygen in both R and S configurations (39, 42). SPM carrying the alcohol configuration at carbon positions 17R, 15R, or 18R are metabolically more stable to further enzymatic conversion, displaying higher biological activities than their counterparts (i.e., LXA4, RvD1) (42). SPM presence in serum likely reflects the contribution of cell activation (i.e., platelets, leukocytes) to their production (40) and may indicate potential functional roles in clot retraction and tissue repair in addition to their known roles in inflammation resolution. Along these lines, PCA of results from serum demonstrated specific clusters of LM present in serum compared with the NIST human plasma used in the present studies for reference standards, validation of this approach, and potential calibration reference between laboratories.
In earlier studies, we identified RvE1 (100–400 pg/ml) in human plasma at 4 h after EPA (1 g) and ASA (160 mg) supplementation (1). Present results demonstrate that without known supplementation, RvE1 was identified in serum (both commercial and fresh) as well as in fresh plasma. Its absence in SRM 1950 might reflect a dilution effect with the 100 selected individuals or RvE1 lability in these samples, since it degrades without addition of methanol (as shown in Table 5). Of note, Psychogios et al. (34) reported RvE1 (182 pg/ml) in plasma from a cohort of 70 individuals. This value is similar to present values found after EPA supplementation in other healthy subjects. This could reflect differences in diet. Psychogios et al. (34) also identified RvD1 (17 pg/ml). Mas et al. (26) identified RvD1, 17-epi-RvD1, and RvD2 in both human plasma and serum following EFA supplementation for several weeks at levels commensurate with those we identify here in human serum.
Table 5.
Chemical stability of selected endogenous LM identified in human serum
| LM at Day 0 | %Change |
|||||||
|---|---|---|---|---|---|---|---|---|
| Day 1 | Day 2 | Day 3 | Day 4 | Day 5 | Week 2 | Week 4 | ||
| DHA bioactive metabolome | ||||||||
| RvD1 | 49.5 ± 1.3 | |||||||
| With methanol | −1.0 | −0.2 | +3.2 | −3.2 | −1.1 | |||
| Without methanol | +0.8 | −2.0 | +2.4 | −13.2 | −15.5 | −33.4 | −56.8 | |
| RvD2 | 13.4 ± 0.8 | |||||||
| With methanol | −1.3 | +1.1 | +6.4 | +2.3 | +1.1 | |||
| Without methanol | −9.2 | +2.5 | +2.2 | −1.2 | −19.2 | −39.5 | −59.0 | |
| RvD3 | 68.5 ± 7.5 | |||||||
| With methanol | −3.1 | +8.0 | +6.6 | −4.4 | +6.0 | |||
| Without methanol | −6.8 | −8.5 | −3.3 | −11.3 | −12.6 | −18.9 | −25.4 | |
| RvD5 | 24.9 ± 2.2 | |||||||
| With methanol | +6.5 | −10.5 | −18.0 | −8.4 | −16.8 | |||
| Without methanol | −16.4 | −14.8 | −15.1 | −20.2 | −17.0 | −38.7 | −44.0 | |
| RvD6 | 21.6 ± 2.0 | |||||||
| With methanol | +1.7 | +2.2 | −1.1 | +0.4 | −11.8 | |||
| Without methanol | +4.6 | −9.8 | −12.5 | −17.2 | −14.3 | −19.5 | −85.3 | |
| PD1 | 6.1 ± 0.1 | |||||||
| With methanol | −3.0 | +5.5 | −8.3 | −11.9 | −10.4 | |||
| Without methanol | +6.7 | +1.7 | −18.3 | −26.8 | −23.7 | −33.0 | −36.7 | |
| MaR1 | 9.0 ± 0.8 | |||||||
| With methanol | +2.3 | +0.9 | −8.0 | −6.5 | −17.8 | |||
| Without methanol | −6.5 | −2.5 | −2.6 | −15.7 | −24.7 | −67.9 | −73.1 | |
| EPA bioactive metabolome | ||||||||
| RvE1 | 13.1 ± 0.9 | |||||||
| With methanol | −3.3 | −9.0 | −13.9 | −9.4 | −13.1 | |||
| Without methanol | +7.6 | −4.2 | −22.0 | −23.7 | −24.6 | −50.7 | −57.1 | |
| RvE3 | 686.3 ± 51.0 | |||||||
| With methanol | −6.4 | −7.6 | −5.1 | −7.2 | −4.4 | |||
| Without methanol | −1.3 | −5.2 | −4.5 | −3.5 | −18.7 | −40.9 | −42.2 | |
| AA bioactive metabolome | ||||||||
| LXA4 | 11.2 ± 1.0 | |||||||
| With methanol | 1.8 | +0.5 | −8.6 | −8.3 | −5.9 | |||
| Without methanol | 4.4 | −3.8 | −5.2 | −5.7 | −3.8 | −14.4 | −39.9 | |
| LXB4 | 117.6 ± 2.6 | |||||||
| With methanol | −1.7 | −3.6 | −1.9 | +5.2 | −5.5 | |||
| Without methanol | −1.3 | −5.8 | −3.6 | −5.8 | −11.3 | −17.7 | −57.1 | |
| PGD2 | 55.1 ± 1.9 | |||||||
| With methanol | +9.8 | −6.8 | +3.3 | +3.7 | −15.5 | |||
| Without methanol | +7.6 | −2.8 | +5.8 | +2.1 | −16.9 | −10.9 | −26.7 | |
| PGE2 | 199.2 ± 10.2 | |||||||
| With methanol | +3.7 | −1.2 | +0.1 | −11.8 | −15.6 | |||
| Without methanol | −6.2 | −12.2 | −14.3 | −20.8 | −15.3 | −11.9 | −29.8 | |
| PGF2α | 143.3 ± 2.5 | |||||||
| With methanol | −0.4 | −0.2 | +1.2 | +8.9 | −13.6 | |||
| Without methanol | +8.0 | +1.1 | +1.6 | +4.8 | −9.0 | −15.6 | −34.1 | |
| TxB2 | 6,067.0 ± 128.4 | |||||||
| With methanol | −5.2 | −7.8 | +7.4 | −5.5 | −12.5 | |||
| Without methanol | +9.2 | −3.2 | +7.3 | −16.6 | −19.2 | −17.8 | −34.2 | |
Values are lipid mediator (LM) levels at day 0 (means ± SE, d = 3 determinations; in pg/ml serum) and %change from day 0. Human serum (250 μl) was stored at −20°C with or without 1 ml of methanol. On the designated day (day 0 to 4 weeks), liquid chromatography-tandem mass spectrometry (LC-MS-MS)-based LM metabololipidomics were carried out. See Glossary for definitions.
With humans, omega-3 EFA supplementation studies in some cases have given seemingly opposite results. For example, supplementation was protective in rheumatoid arthritis (12) and certain cardiovascular diseases (11) but was also associated with increased risk of prostate cancer (4). In these and similar human studies, the mechanism of n-3 EFA remains a subject of discussion and emphasizes the need for rigorous identification and functional LM-SPM profiling methods. EFA intake has been associated with some beneficial outcomes in humans when in combination with ASA (25). Using functional LM-SPM metabololipidomics and PLS-DA, we identified a cluster of pro-resolving mediators that were elevated with acute EFA and ASA intake. The levels of SPM were within their bioactive ranges (Table 3) and positively correlated (r2 = 0.77) with increased function, e.g., an enhanced E. coli phagocytosis in whole blood from these subjects. These findings are in accordance with recent findings that SPM enhance bacterial killing in mice (6, 14, 32; reviewed in Ref. 35), lowering antibiotic requirement (6). The present findings also underscore the utility of this approach in determining the potential resolution status of an individual or a target organ following EFA intake. Of interest, diets rich in omega-3 EFA increase both resolvins and protectins in model organisms (21), whereas SPM such as PD1 are reduced in disease as described in human asthma patients (22, 28), where LM can be regulated with increased omega-3 supplementation of asthmatics (23).
Thus the current approach for profiling specific n-3- and n-6-derived bioactive EFA metabolomes with reference tissues that can be used by different research groups for LM-SPM calibration as documented in this article can provide information of potentially diagnostic and therapeutic value. Currently, assessment of omega-3 fatty acids incorporated in red blood cell membranes is a useful method, along with the omega-3 index that correlates with this membrane compartment and functional outcomes such as in aging humans (45). Rigorous LM-SPM profiling is needed because human resolution phenotypes have only recently emerged in healthy individuals (30) and those undergoing surgery (33). Hence, this LC-MS-MS-based profiling approach will permit assessment of when and where individual metabolites may be physiologically relevant and formed in appropriate concentrations to serve as pro-resolving mediators in model organisms as well as in human health and disease.
GRANTS
This work was supported in part by National Institutes of Health Grants P01 HL108801 and P01 GM095467, and a Mérieux Research Grant (to C. N. Serhan).
ENDNOTE
At the request of the authors, readers are herein alerted to the fact that additional materials related to this manuscript may be found at the institutional website of one of the authors, which at the time of publication they indicate is: http://research.bwhanesthesia.org/research-groups/cetri/serhan-lab. These materials are not a part of this manuscript and have not undergone peer review by the American Physiological Society (APS). APS and the journal editors take no responsibility for these materials, for the website address, or for any links to or from it.
DISCLOSURE
C.N.S. is an inventor on patents [resolvins] assigned to B.W.H. and licensed to Resolvyx Pharmaceuticals. C.N.S. is a scientific founder of Resolvyx Pharmaceuticals and owns equity in the company. C.N.S.'s interests were reviewed and are managed by the Brigham and Women's Hospital and Partners HealthCare in accordance with their conflict of interest policies.
AUTHOR CONTRIBUTIONS
R.A.C., M.S., J.D., N.C., and C.N.S. conception and design of research; R.A.C., M.S., J.D., and N.C. performed experiments; R.A.C., M.S., J.D., and N.C. analyzed data; R.A.C., M.S., J.D., N.C., and C.N.S. interpreted results of experiments; R.A.C., M.S., J.D., N.C., and C.N.S. prepared figures; R.A.C. drafted manuscript; R.A.C., M.S., J.D., N.C., and C.N.S. edited and revised manuscript; R.A.C., M.S., J.D., N.C., and C.N.S. approved final version of manuscript.
ACKNOWLEDGMENTS
We thank Mary Halm Small for expert assistance in the manuscript preparation.
Glossary
- 5S,15S-diHETE
5S,15S-dihydroxy-eicosa-6E,8Z,11Z,13E-tetraenoic acid
- AA
Arachidonic acid
- ASA
Acetylsalicylic acid
- COX
Cyclooxygenase
- d
Deuterated
- DHA
Docosahexaenoic acid
- EFA
Essential fatty acid
- EPA
Eicosapentaenoic acid
- EPI
Enhanced product ion scan
- HDHA
Hydroxydocosahexaenoic acid
- HEPE
Hydroxyeicosapentaenoic acid
- HETE
Hydroxyeicosatetraenoic acid
- HpETE
Hydroperoxyeicosatetraenoic acid
- LC-MS-MS
Liquid chromatography tandem mass spectrometry
- LM
Lipid mediators
- LOX
Lipoxygenase
- LT
Leukotriene
- LTB4
Leukotriene B4 (5S,12R-dihydroxy-eicosa-6Z, 8E,10E,14Z-tetraenoic acid)
- LX
Lipoxin
- LXA4
Lipoxin A4 (5S,6R,15S-trihydroxy-eicosa-7E,9E,11Z,13E-tetraenoic acid)
- LXA5
Lipoxin A5 (5S,6R,15S-trihydroxy-eicosa-7E,9E,11Z, 13E,17Z-pentaenoic acid)
- LXB4
Lipoxin B4 (5S,14R,15S-trihydroxy-eicosa-6E,8Z,10E,12E-tetraenoic acid)
- LXB5
Lipoxin B5 (5S,14R,15S-trihydroxy-eicosa-6E,8Z,10E,12E,17Z-pentaenoic acid)
- MaR1
Maresin 1 (7R,14S-dihydroxy-docosa-4Z,8E,10E,12Z,16Z,19Z-hexaenoic acid)
- MRM
Multiple reaction monitoring
- NIST
National Institute of Standards and Technology
- PCA
Principal component analysis
- PD
Protectin
- PD1
Protectin D1 (10R,17S-dihydroxy-docosa-4Z,7Z,11E,13E,15Z,19Z-hexaenoic acid), also known as neuroprotectin D1 (NPD1)
- PGD2
Prostaglandin D2 (11-oxo-9α, 15S-dihydroxy-prosta-5Z, 13E-dien-1-oic acid)
- PGE2
Prostagladin E2 (9-oxo-11α,15S-dihydroxy-prosta-5Z,13E-dien-1-oic acid)
- PGF2α
Prostaglandin F2α (9α,11α,15S-trihydroxy-prosta-5Z,13E-dienoic acid)
- PLS-DA
Partial least squares-discriminant analysis
- PMN
Polymorphonuclear leukocyte
- RT
Retention time
- Rv
Resolvin
- RvD1
Resolvin D1 (7S,8R,17S-trihydroxy-docosa-4Z,9E,11E,13Z,15E,19Z-hexaenoic acid)
- RvD2
Resolvin D2 (7S,16R,17S-trihydroxy-docosa-4Z,8E,10Z,12E,14E,19Z-hexaenoic acid)
- RvD3
Resolvin D3 (4S,11R,17S-trihydroxy-docosa-5Z,7E,9E,13Z,15E,19Z-hexaenoic acid)
- RvD5
Resolvin D5 (7S,17S-dihydroxy-docosa-4Z,8E,10Z,13Z,15E,19Z-hexaenoic acid)
- RvE1
Resolvin E1 (5S,12R,18R-trihydroxy-eicosa-6Z,8E,10E,14Z,16E-pentaenoic acid)
- RvE2
Resolvin E2 (5S,18R-dihydroxy-eicosa-6E,8Z,11Z,14Z,16E-pentaenoic acid)
- RvE3
Resolvin E3 (17R,18R-dihydroxy-eicosa-5Z,8Z,11Z,13E,15E-pentaenoic acid)
- SPM
Specialized pro-resolving mediator
- SRM
Standard reference materials
- Tx
Thromboxane
- TxB2
Thromboxane B2 (9α,11,15S-trihydroxy-thromba-5Z,13E-dien-1-oic acid)
REFERENCES
- 1.Arita M, Bianchini F, Aliberti J, Sher A, Chiang N, Hong S, Yang R, Petasis NA, Serhan CN. Stereochemical assignment, anti-inflammatory properties, and receptor for the omega-3 lipid mediator resolvin E1. J Exp Med 201: 713–722, 2005 [DOI] [PMC free article] [PubMed] [Google Scholar]
- 2.Birnbaum Y, Ye Y. Pleiotropic effects of statins: the role of eicosanoid production. Curr Atheroscler Rep 14: 135–139, 2012 [DOI] [PubMed] [Google Scholar]
- 3.Borgeson E, Godson C. Resolution of inflammation: therapeutic potential of pro-resolving lipids in type 2 diabetes mellitus and associated renal complications. Front Immunol 3: 318, 2012 [DOI] [PMC free article] [PubMed] [Google Scholar]
- 4.Brasky TM, Darke AK, Song X, Tangen CM, Goodman PJ, Thompson IM, Meyskens FL, Jr, Goodman GE, Minasian LM, Parnes HL, Klein EA, Kristal AR. Plasma phospholipid fatty acids and prostate cancer risk in the SELECT trial. J Natl Cancer Inst 105: 1132–1141, 2013 [DOI] [PMC free article] [PubMed] [Google Scholar]
- 5.Calder PC. Fatty acids and inflammation: the cutting edge between food and pharma. Eur J Pharmacol 668, Suppl 1: S50–S58, 2011 [DOI] [PubMed] [Google Scholar]
- 6.Chiang N, Fredman G, Backhed F, Oh SF, Vickery T, Schmidt BA, Serhan CN. Infection regulates pro-resolving mediators that lower antibiotic requirements. Nature 484: 524–528, 2012 [DOI] [PMC free article] [PubMed] [Google Scholar]
- 7.Claria J, Nguyen BT, Madenci A, Ozaki CK, Serhan CN. Diversity of lipid mediators in human adipose tissue depots. Am J Physiol Cell Physiol 304: C1141–C1149, 2013 [DOI] [PMC free article] [PubMed] [Google Scholar]
- 8.Cotran RS, Kumar V, Collins T. (editors). Robbins Pathologic Basis of Disease. Philadelphia, PA: Saunders, 1999, p. 1425 [Google Scholar]
- 9.Dalli J, Serhan CN. Specific lipid mediator signatures of human phagocytes: microparticles stimulate macrophage efferocytosis and pro-resolving mediators. Blood 120: e60–e72, 2012 [DOI] [PMC free article] [PubMed] [Google Scholar]
- 10.Dalli J, Zhu M, Vlasenko NA, Deng B, Haeggstrom JZ, Petasis NA, Serhan CN. The novel 13S,14S-epoxy-maresin is converted by human macrophages to maresin 1 (MaR1), inhibits leukotriene A4 hydrolase (LTA4H), and shifts macrophage phenotype. FASEB J 27: 2573–2583, 2013 [DOI] [PMC free article] [PubMed] [Google Scholar]
- 11.De Caterina R. n-3 fatty acids in cardiovascular disease. N Engl J Med 364: 2439–2450, 2011 [DOI] [PubMed] [Google Scholar]
- 12.Di Giuseppe D, Wallin A, Bottai M, Askling J, Wolk A. Long-term intake of dietary long-chain n-3 polyunsaturated fatty acids and risk of rheumatoid arthritis: a prospective cohort study of women. Ann Rheum Dis. Epub ahead of print. 10.1136/annrheumdis-2013-203338 [DOI] [PubMed] [Google Scholar]
- 13.Fredman G, Oh SF, Ayilavarapu S, Hasturk H, Serhan CN, Van Dyke TE. Impaired phagocytosis in localized aggressive periodontitis: rescue by Resolvin E1. PLoS One 6: e24422, 2011 [DOI] [PMC free article] [PubMed] [Google Scholar]
- 14.Fullerton JN, O'Brien AJ, Gilroy DW. Lipid mediators in immune dysfunction after severe inflammation. Trends Immunol 35: 12–21, 2014 [DOI] [PMC free article] [PubMed] [Google Scholar]
- 15.Haeggstrom JZ, Funk CD. Lipoxygenase and leukotriene pathways: biochemistry, biology, and roles in disease. Chem Rev 111: 5866–5898, 2011 [DOI] [PubMed] [Google Scholar]
- 16.Hasturk H, Kantarci A, Goguet-Surmenian E, Blackwood A, Andry C, Serhan CN, Van Dyke TE. Resolvin E1 regulates inflammation at the cellular and tissue level and restores tissue homeostasis in vivo. J Immunol 179: 7021–7029, 2007 [DOI] [PubMed] [Google Scholar]
- 17.Higgs GA, Salmon JA, Henderson B, Vane JR. Pharmacokinetics of aspirin and salicylate in relation to inhibition of arachidonate cyclooxygenase and antiinflammatory activity. Proc Natl Acad Sci USA 84: 1417–1420, 1987 [DOI] [PMC free article] [PubMed] [Google Scholar]
- 18.Hong S, Gronert K, Devchand P, Moussignac RL, Serhan CN. Novel docosatrienes and 17S-resolvins generated from docosahexaenoic acid in murine brain, human blood and glial cells: autacoids in anti-inflammation. J Biol Chem 278: 14677–14687, 2003 [DOI] [PubMed] [Google Scholar]
- 19.Isobe Y, Arita M, Matsueda S, Iwamoto R, Fujihara T, Nakanishi H, Taguchi R, Masuda K, Sasaki K, Urabe D, Inoue M, Arai H. Identification and structure determination of novel anti-inflammatory mediator resolvin E3, 17,18-dihydroxyeicosapentaenoic acid. J Biol Chem 287: 10525–10534, 2012 [DOI] [PMC free article] [PubMed] [Google Scholar]
- 20.Janes KA, Yaffe MB. Data-driven modelling of signal-transduction networks. Nat Rev Mol Cell Biol 7: 820–828, 2006 [DOI] [PubMed] [Google Scholar]
- 21.Jones ML, Mark PJ, Keelan JA, Barden A, Mas E, Mori TA, Waddell BJ. Maternal dietary omega-3 fatty acid intake increases resolvin and protectin levels in the rat placenta. J Lipid Res 54: 2247–2254, 2013 [DOI] [PMC free article] [PubMed] [Google Scholar]
- 22.Levy BD, Kohli P, Gotlinger K, Haworth O, Hong S, Kazani S, Israel E, Haley KJ, Serhan CN. Protectin D1 is generated in asthma and dampens airway inflammation and hyper-responsiveness. J Immunol 178: 496–502, 2007 [DOI] [PMC free article] [PubMed] [Google Scholar]
- 23.Lundstrom SL, Yang J, Brannan JD, Haeggstrom JZ, Hammock BD, Nair P, O'Byrne P, Dahlen SE, Wheelock CE. Lipid mediator serum profiles in asthmatics significantly shift following dietary supplementation with omega-3 fatty acids. Mol Nutr Food Res 57: 1378–1389, 2013 [DOI] [PMC free article] [PubMed] [Google Scholar]
- 24.Mallat A, Lotersztajn S. Cellular mechanisms of tissue fibrosis. 5. Novel insights into liver fibrosis. Am J Physiol Cell Physiol 305: C789–C799, 2013 [DOI] [PubMed] [Google Scholar]
- 25.Marchioli R, Schweiger C, Tavazzi L, Valagussa F. Efficacy of n-3 polyunsaturated fatty acids after myocardial infarction: results of GISSI-Prevenzione trial. Gruppo Italiano per lo Studio della Sopravvivenza nell'Infarto Miocardico. Lipids 36 Suppl: S119–S126, 2001 [DOI] [PubMed] [Google Scholar]
- 26.Mas E, Croft KD, Zahra P, Barden A, Mori TA. Resolvins D1, D2, and other mediators of self-limited resolution of inflammation in human blood following n-3 fatty acid supplementation. Clin Chem 58: 1476–1484, 2012 [DOI] [PubMed] [Google Scholar]
- 27.McFarlin BK, Williams RR, Venable AS, Dwyer KC, Haviland DL. Image-based cytometry reveals three distinct subsets of activated granulocytes based on phagocytosis and oxidative burst. Cytometry A 83: 745–751, 2013 [DOI] [PubMed] [Google Scholar]
- 28.Miyata J, Fukunaga K, Iwamoto R, Isobe Y, Niimi K, Takamiya R, Takihara T, Tomomatsu K, Suzuki Y, Oguma T, Sayama K, Arai H, Betsuyaku T, Arita M, Asano K. Dysregulated synthesis of protectin D1 in eosinophils from patients with severe asthma. J Allergy Clin Immunol 131: 353–360, 2013 [DOI] [PubMed] [Google Scholar]
- 29.Morita M, Kuba K, Ichikawa A, Nakayama M, Katahira J, Iwamoto R, Watanebe T, Sakabe S, Daidoji T, Nakamura S, Kadowaki A, Ohto T, Nakanishi H, Taguchi R, Nakaya T, Murakami M, Yoneda Y, Arai H, Kawaoka Y, Penninger JM, Arita M, Imai Y. The lipid mediator protectin D1 inhibits influenza virus replication and improves severe influenza. Cell 153: 112–125, 2013 [DOI] [PubMed] [Google Scholar]
- 30.Morris T, Stables M, Colville-Nash P, Newson J, Bellingan G, de Souza PM, Gilroy DW. Dichotomy in duration and severity of acute inflammatory responses in humans arising from differentially expressed proresolution pathways. Proc Natl Acad Sci USA 107: 8842–8847, 2010 [DOI] [PMC free article] [PubMed] [Google Scholar]
- 31.Nakamura M, Shimizu T. Leukotriene receptors. Chem Rev 111: 6231–6298, 2011 [DOI] [PubMed] [Google Scholar]
- 32.Oh SF, Pillai PS, Recchiuti A, Yang R, Serhan CN. Pro-resolving actions and stereoselective biosynthesis of 18S E-series resolvins in human leukocytes and murine inflammation. J Clin Invest 121: 569–581, 2011 [DOI] [PMC free article] [PubMed] [Google Scholar]
- 33.Pillai PS, Leeson S, Porter TF, Owens CD, Kim JM, Conte MS, Serhan CN, Gelman S. Chemical mediators of inflammation and resolution in post-operative abdominal aortic aneurysm patients. Inflammation 35: 98–113, 2012 [DOI] [PMC free article] [PubMed] [Google Scholar]
- 34.Psychogios N, Hau DD, Peng J, Guo AC, Mandal R, Bouatra S, Sinelnikov I, Krishnamurthy R, Eisner R, Gautam B, Young N, Xia J, Knox C, Dong E, Huang P, Hollander Z, Pedersen TL, Smith SR, Bamforth F, Greiner R, McManus B, Newman JW, Goodfriend T, Wishart DS. The human serum metabolome. PLoS One 6: e16957, 2011 [DOI] [PMC free article] [PubMed] [Google Scholar]
- 35.Russell CD, Schwarze J. The role of pro-resolution lipid mediators in infectious disease. Immunology 141: 166–173, 2014 [DOI] [PMC free article] [PubMed] [Google Scholar]
- 36.Samuelsson B. Leukotrienes: mediators of immediate hypersensitivity reactions and inflammation. Science 220: 568–575, 1983 [DOI] [PubMed] [Google Scholar]
- 37.Serhan CN. A search for endogenous mechanisms of anti-inflammation uncovers novel chemical mediators: missing links to resolution. Histochem Cell Biol 122: 305–321, 2004 [DOI] [PubMed] [Google Scholar]
- 38.Serhan CN, Brain SD, Buckley CD, Gilroy DW, Haslett C, O'Neill LAJ, Perretti M, Rossi AG, Wallace JL. Resolution of inflammation: state of the art, definitions and terms. FASEB J 21: 325–332, 2007 [DOI] [PMC free article] [PubMed] [Google Scholar]
- 39.Serhan CN, Clish CB, Brannon J, Colgan SP, Chiang N, Gronert K. Novel functional sets of lipid-derived mediators with antiinflammatory actions generated from omega-3 fatty acids via cyclooxygenase 2-nonsteroidal antiinflammatory drugs and transcellular processing. J Exp Med 192: 1197–1204, 2000 [DOI] [PMC free article] [PubMed] [Google Scholar]
- 40.Serhan CN. (guest editor). Special Issue on Lipoxins and Aspirin-Triggered Lipoxins. Prostaglandins Leukot Essent Fatty Acids 73: 139–321, 2005 [DOI] [PubMed] [Google Scholar]
- 41.Serhan CN, Hong S, Gronert K, Colgan SP, Devchand PR, Mirick G, Moussignac RL. Resolvins: a family of bioactive products of omega-3 fatty acid transformation circuits initiated by aspirin treatment that counter pro-inflammation signals. J Exp Med 196: 1025–1037, 2002 [DOI] [PMC free article] [PubMed] [Google Scholar]
- 42.Serhan CN, Petasis NA. Resolvins and protectins in inflammation-resolution. Chem Rev 111: 5922–5943, 2011 [DOI] [PMC free article] [PubMed] [Google Scholar]
- 43.Shimizu T. Lipid mediators in health and disease: enzymes and receptors as therapeutic targets for the regulation of immunity and inflammation. Annu Rev Pharmacol Toxicol 49: 123–150, 2009 [DOI] [PubMed] [Google Scholar]
- 44.Tabas I, Glass CK. Anti-inflammatory therapy in chronic disease: challenges and opportunities. Science 339: 166–172, 2013 [DOI] [PMC free article] [PubMed] [Google Scholar]
- 45.Tan ZS, Harris WS, Beiser AS, Au R, Himali JJ, Debette S, Pikula A, Decarli C, Wolf PA, Vasan RS, Robins SJ, Seshadri S. Red blood cell omega-3 fatty acid levels and markers of accelerated brain aging. Neurology 78: 658–664, 2012 [DOI] [PMC free article] [PubMed] [Google Scholar]
- 46.Titos E, Claria J, Planaguma A, Lopez-Parra M, Villamor N, Parrizas M, Carrio A, Miquel R, Jimenez W, Arroyo V, Rivera F, Rodes J. Inhibition of 5-lipoxygenase induces cell growth arrest and apoptosis in rat Kupffer cells: implications for liver fibrosis. FASEB J 17: 1745–1747, 2003 [DOI] [PubMed] [Google Scholar]
- 47.Wan J, Benkdane M, Teixeira-Clerc F, Bonnafous S, Louvet A, Lafdil F, Pecker F, Tran A, Gual P, Mallat A, Lotersztajn S, Pavoine C. M2 Kupffer cells promote M1 Kupffer cell apoptosis: a protective mechanism against alcoholic and nonalcoholic fatty liver disease. Hepatology 59: 130–142, 2014 [DOI] [PubMed] [Google Scholar]
- 48.Weiss GA, Troxler H, Klinke G, Rogler D, Braegger C, Hersberger M. High levels of anti-inflammatory and pro-resolving lipid mediators lipoxins and resolvins and declining docosahexaenoic acid levels in human milk during the first month of lactation. Lipids Health Dis 12: 89, 2013 [DOI] [PMC free article] [PubMed] [Google Scholar]
- 49.Zhang MJ, Spite M. Resolvins: anti-inflammatory and proresolving mediators derived from omega-3 polyunsaturated fatty acids. Annu Rev Nutr 32: 203–227, 2012 [DOI] [PubMed] [Google Scholar]