Abstract
Mammalian heart development is built on highly conserved molecular mechanisms with polygenetic perturbations resulting in a spectrum of congenital heart diseases (CHD). However, knowledge of cardiogenic ontogeny that regulates proper cardiogenesis remains largely based on candidate-gene approaches. Mapping the dynamic transcriptional landscape of cardiogenesis from a genomic perspective is essential to integrate the knowledge of heart development into translational applications that accelerate disease discovery efforts toward mechanistic-based treatment strategies. Herein, we designed a time-course transcriptome analysis to investigate the genome-wide dynamic expression landscape of innate murine cardiogenesis ranging from embryonic stem cells to adult cardiac structures. This comprehensive analysis generated temporal and spatial expression profiles, revealed stage-specific gene functions, and mapped the dynamic transcriptome of cardiogenesis to curated pathways. Reconciling known genetic underpinnings of CHD, we deconstructed a disease-centric dynamic interactome encoded within this cardiogenic atlas to identify stage-specific developmental disturbances clustered on regulation of epithelial-to-mesenchymal transition (EMT), BMP signaling, NF-AT signaling, TGFb-dependent EMT, and Notch signaling. Collectively, this cardiogenic transcriptional landscape defines the time-dependent expression of cardiac ontogeny and prioritizes regulatory networks at the interface between health and disease.
Keywords: transcriptome, cardiogenesis, time course microarray, congenital heart disease, heart development
mammalian cardiogenic ontogeny is highly conserved, and avoidance of congenital heart disease (CHD) is dependent on sequential acquisition of cellular features encoded by a core transcription regulatory network (16, 21, 23). Precise temporal and spatial control of gene expression is vital to orchestrate multilineage differentiation during cardiogenesis and regulates physiological homeostasis throughout the lifespan (24, 31, 37). Enormous effort has been invested in studying heart organogenesis, yet a deterministic roadmap of natural cardiogenesis to decode the dynamic complexity of heart development does not currently exist. To this end, available technology for genome-wide expression analysis offers an approach to survey time-course transcriptional profiles when coupled with stage-specific tissues isolated from developing embryos (2, 19). Therefore, we aimed to generate a dynamic transcriptional atlas for cardiogenesis to resolve the temporal and spatial relationships of cardiac development pathways and inform efforts to elucidate genetic contributors driving the morphogenesis of CHD.
CHD affects nearly 40,000 neonates per year in the United States and is the leading cause of birth defect-associated infant illness and death (12, 35). Currently, over 1 million adults in the United States are living with a congenital heart defect, and this number continues to rise because of improved health care and medical intervention (34). The broad goals of CHD research are to find common mechanisms/pathways to predict and diagnose cardiac defects and ultimately engineer preemptive therapeutic strategies. By combining cutting-edge technologies in genomics, epigenomics, transcriptomics, proteomics, and metabolomics, emerging strategies go beyond mechanistic candidate-based model systems toward content-rich data mining and high-throughput small-molecule testing (7). Among these toolkits, gene expression profiling is fundamental, as modification of RNA levels is an established developmental rheostat that patterns downstream effectors to determine the outcome of sequential cardiogenesis. To further scrutinize the molecular mechanisms of CHD beyond targeted candidate gene-based approaches, we aimed to establish a systematic time-course transcriptome analysis to determine the natural roadmap of inherent gene expression in cardiogenesis.
In this study, we serially collected embryonic cardiac structures at six in utero stages [embryonic day (E)7.5, E8.5, E9.5, E12.5, E14.5, and E18.5], cardiac tissue at 3 days after birth, and adult mature cardiac tissue. Utilizing the time-course microarray technology, we established a comprehensive dynamic transcriptional atlas for cardiogenesis and prioritized stage-specific functions of heart development. In addition, we compared the spatial gene expression profiles between left and right ventricles of the heart. To demonstrate the potential applications of this atlas, we applied a time course-dependent, bioinformatics-based analysis to reconstruct a CHD-centric dynamic interactome that integrates gene interaction networks, the cardiogenic transcriptome, known disease genes, and functional pathway enrichment analysis. This approach identified and prioritized the common networks and hubs underlying the pathogenesis of CHD and illuminated pathways that regulate epithelial-mesenchymal transition (EMT), BMP regulation, NF-AT signaling, TGFb-dependent induction of EMT via SMADS, and Notch signaling as recurring CHD mechanisms. This cardiogenic atlas enables the prioritization of high-throughput-omic data sets to define developmental mechanisms of CHD.
MATERIALS AND METHODS
Tissue sample collection and RNA extraction.
Wild-type CD1 strain mouse embryos were harvested at defined stages from timed mating pairs. Morphology and somite count were used as inclusion criteria for each developmental time point. For the first developmental stage, E7.5, whole embryos were collected. For later stages, cardiac structures were microdissected including E8.5 heart tubes and left and right ventricles corresponding to E9.5, E12.5, E14.5, E18.5, newborn, and adult mice. The adult mice were 6–9 mo old. All samples were harvested in biological triplicates, with ∼30–50 embryos/hearts included per replicate corresponding to E7.5, E8.5, and E9.5; 10–20 hearts for each E12.5 or E14.5 sample; three to five hearts pooled for each E18.5 replicate; and one used for newborn (3 days after birth) and adult samples. Embryonic stem cells (ESC) from the R1 line were used as a pluripotent gold standard for the starting point of development. In all cases, RNA was extracted using the Qiagen RNeasy kit. To avoid interference due to high protein content, newborn and adult hearts were fast-frozen and pulverized prior to RNA extraction. All protocols were carried out under the National Institutes of Health guidelines with approval obtained from the Institutional Animal Care and Use Committee at Mayo Clinic.
Microarray experiments.
Time-course microarray experiments were performed on the following developmental stage-specific samples: R1 ESC (as the starting point for development), cardiac tissue at established embryonic stages (E7.5, E8.5, E9.5, E12.5, E14.5, and E18.5) and cardiac tissues at 3 days after birth and from the adult mouse. In total, the experiments include nine time points with triplicate biological samples at each time point. The microarray platform used in this study was the Affymetrix GeneChip Mouse Genome 430 2.0 Array, which contains >45,000 probe sets representing >34,000 well-characterized mouse genes/transcripts (http://www.affymetrix.com). Biotinylated cRNA were prepared according to the standard Affymetrix protocol from 100 ng total RNA. Following fragmentation, 10 μg of cRNA were hybridized for 16 h at 45°C on a GeneChip Mouse Genome 430 2.0 Array. GeneChips were washed and stained in the Affymetrix Fluidics Station 450. GeneChips were scanned using the GeneChip Scanner 3000 7G.
Raw data analysis and quality control.
Raw microarray image data was analyzed by several statistical packages in R and Bioconductor and customized R scripts for quality assessment and quality control (QA/QC), background correction, quantile normalization across chips, and summarization of probe densities using median polish algorithm (11). The QA/QC process (including the assessment of the raw microarray images, MAplot, normalized unscaled standard error, residual images from the RMA model, relative log expression, and RNA degradation based on all probes on the microarray) was performed with customized R scripts using several R and Bioconductor packages: affy, affyPLM, gcrma, and preprocessCore (5, 10, 14, 15). Standard Affymetrix quality metrics were also assessed, such as 3′/5′-ratios, background, scaling factor, spike-in control probes, GAPDH, and percent present calls (36) using R and the Bioconductor package SimpleAffy. The gene expression matrix was calculated by RMA algorithm using the R affy package. All the analysis scripts are available on request.
Principal components analysis and hierarchical analysis.
To explore the underlying data structure, principal components analysis (PCA) was performed using R programming with the singular value decomposition algorithm on the entire expression data matrix of all time points. Hierarchical analysis using R software was applied to the entire data set to build the dendrogram based on the average distance algorithm.
Temporal differential analysis within each ventricle group.
Two types of differential expression analyses were performed on this time course data set: temporal differential analysis within each ventricle group across the time course and spatial differential analysis between left ventricle (LV) and right ventricle (RV) group across the time course. Temporally differentially expressed genes (DEGs) within each ventricle group across the time course were identified by two statistical methods: linear models for microarray analysis (limma) (29) and multivariate empirical Bayes time-course model (tc: timecourse) (33). Genes/probe-sets on the microarray were ranked based on statistical significance by adjusted P values after controlling false discovery rate (FDR) from R “Limma” package and by one-sample multivariate empirical Bayes statistics (the MB statistics, modified Hotelling T2) from R “timecourse” package. Please note the empirical Bayes time-course model is not designed to calculate P values. The top 10,000 differentially expressed probe-sets from LV and RV, respectively, were selected based on both models for comparison, the subsequent heat-map visualization, supervised and unsupervised clustering analysis, and gene function enrichment analysis. The P value cutoff after FDR control for the top 10,000 probe-sets was 10e-7 in the limma method, and the one-sample MB statistic (a variant of one-sample Hotelling T2 statistic) was 800 with at least twofold change.
Spatial differential analysis between two ventricle groups.
Spatial differential analysis between LV and RV was performed with two-sample multivariate empirical Bayes model using the same “timecourse” package (33) but with E8.5 as a starting point and including both LV and RV samples in the subsequent developmental stages. Genes were ranked based on MB statistics and the top 200 were selected for function enrichment analysis with the MB statistic at 200.
Mapping gene expression profiles to pathways/networks.
The top 10,000 probe-sets were first ranked by statistical significance from differential analysis by two statistical methods for LV and RV, respectively, selected and combined together. Second, gene expression values of triplicate samples at each time point were averaged and normalized with mean 0 and standard deviation 1 before mapping the expression data into pathway or gene networks. Data mapping was performed with GenMapp software (28). Pathways are downloaded from the GenMapp database, which is contributed by various researchers. LV and RV data were mapped separately. Each gene in the pathway was represented by a rectangular box that is divided into nine subboxes with each representing one time point, from left to right: ESC (R1), E7.5, E8.5, E9.5, E12.5, E14.5, E18.5, D3 (3 days after birth), and A (adult). The green and red colors indicate low and high expression, respectively.
Gene Ontology enrichment analysis.
Gene function analysis was performed using the Database for Annotation, Visualization and Integrated Discovery (v6.7) (13). Significant function groups were ranked based on statistical significance (P values) from hypergeometric distribution.
PCR verification.
To verify the expression profiles obtained in microarray analysis, quantitative real-time (qRT) PCR was performed on samples originally included in the microarray experiments. For this purpose, RNA-to-cDNA conversion was done with the Bio-Rad iScript cDNA synthesis kit (170-8891). We used 15 ng of cDNA per qRT-PCR reaction in 10 μl total volume. Predesigned primers from iDT (Isl1, Mm.PT.58.8918462; Bmp4, Mm.PT.58.7116776; Fzd7, Mm.PT.58.41510541.g; Fzd8, Mm.PT.58.41702582.g; and normalizing Gapdh, Mm.PT.39a.1) and TaqMan universal PCR master mix (Applied Biosystems 7304437) completed the reaction. Technical triplicates were included to ensure data reproducibility. The ΔΔCt method was used to calculate relative expression, with final represented values corresponding to fold change calculated according to the formula: 2−ΔΔCt.
CHD gene network analysis.
CHD genes were curated (3) for both nonsyndrome and syndrome groups. Each gene in the nonsyndrome group was used as a seed to query the STRING gene/protein interaction database (9), and its top 10 partners were retrieved based on confidence scores of the interaction. Then the CHD disease genes and partners were combined to retrieve the gene-gene interaction information from the same database using the same default settings. Pathway enrichment analysis was performed on CHD genes and their partners. The expression profiles were pulled out from our time-course microarray data for both disease genes and their partners. We designed an R package, Rcircle, to plot these results from multiple Bioinformatic analyses including gene interaction networks, confidence scores of the interactions, number of interactions for each gene (to identify hub genes), transcriptional profiles (heat maps), disease association (known disease genes or partners), and enriched pathways. To simplify the visualization, only interactions linking to CHD genes were illustrated. The same analysis was performed on syndromic gene group.
Accession number.
Raw microarray data and metadata for sample source information, experimental design, sample and data processing, and gene expression matrix are available at the National Center for Biotechnology Information Gene Expression Omnibus database with accession number GSE51483. Also see Supplemental Table S1 for the entire expression matrix with statistical significance ranks of temporal and spatial differential analyses (based on P values or MB statistics).1
RESULTS
Dynamic gene expression profiles diverge at distinctive developmental stages.
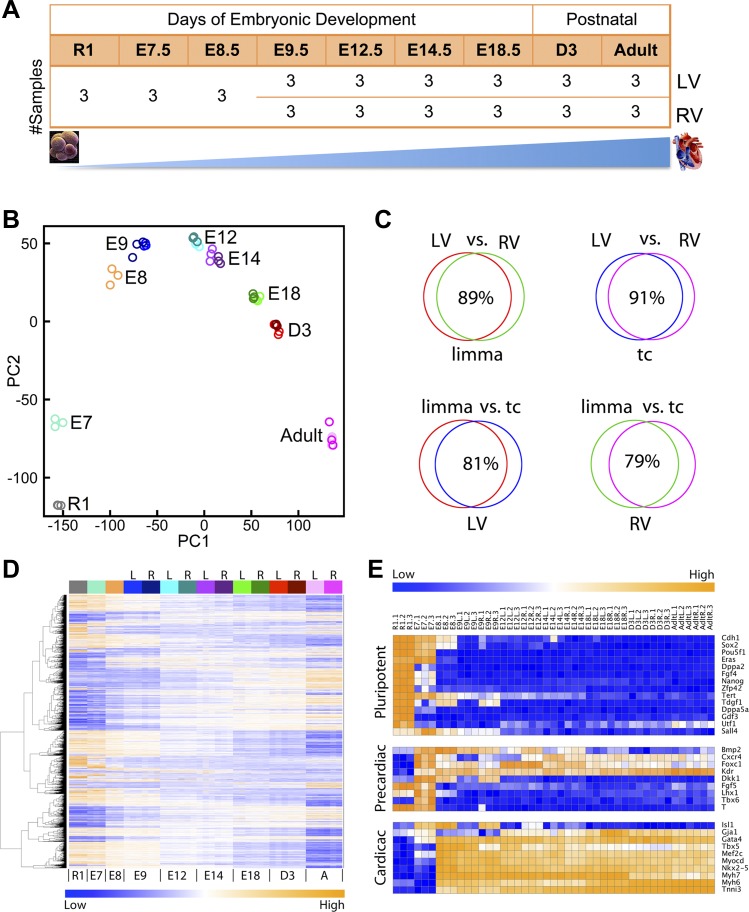
To interrogate the temporal and spatial expression transcriptome profiles during mammalian heart development, we designed a time-course microarray experiment using the mouse model at defined stages of cardiogenesis, including ESC (R1 stem cell line), early embryonic developmental stages: E7.5 whole embryos, E8.5 heart tubes, ventricle tissues at E9.5, E12.5, E14.5, E18.5 to 3 days after birth (D3), and the adult heart (Figs. 1 and 2A). At each time point, microarray experiments were performed on triplicate biological samples. Starting at E9.5, tissue samples from LV and RV were microdissected for RNA purification and microarray analysis to determine spatially differential gene expression. The stage-specific embryonic dissection provided an anatomically demarcated sample set linked to major developmental milestones. After stringent QA and normalization of the raw microarray data (see materials and methods), we assessed the similarities among the tissue samples within and between different developmental stages. We performed PCA on the entire microarray data to reveal the underlying structure of whole genome transcription profiles from nine time points and provide clarity for further analysis (20, 27). PCA showed the similarity of tissue samples within each time point and highlighted the divergence of samples collected from distinct cardiac developmental stages (Fig. 2B). Furthermore, the PCA plot revealed significant overlapping gene expression patterns between LV and RV within each time point, which implies a high degree of similarity in gene expression profiles between the two chambers (starting at E9.5).
Fig. 1.
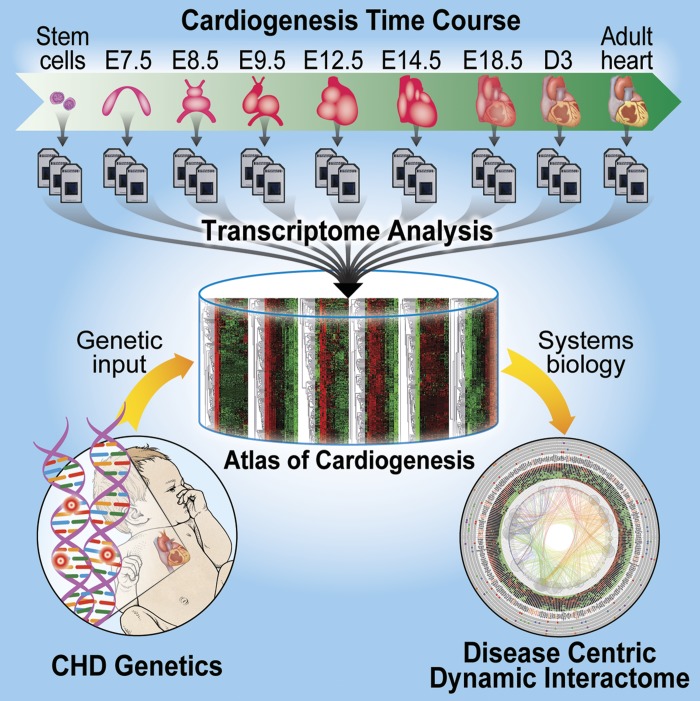
Graphical summary of the study. Mouse embryonic heart tissues from different developmental stages were dissected and processed for time-course microarray analysis to build the genome-wide dynamic transcriptional atlas. To demonstrate the application of this cardiogenic roadmap, congenital heart disease (CHD)-associated genes were integrated with this transcriptome landscape to establish the Disease Centric Dynamic Interactome (DCDI) and decode the developmental hubs linked to CHD. E, embryonic day; D, postnatal day.
Fig. 2.
Dynamic gene expression profiles of cardiogenesis using mouse model from early embryonic to adult stages. A: microarray experimental design. Microarray experiments were performed on 9 time points including mouse R1 embryonic stem cells (ESC) as a starting point, E7.5, E8.5, E9.5, E12.5, E14.5, E18.5, 3 days after birth, and the adult heart. At each time point, biological triplicates were used for gene expression microarray experiments. Starting from E9.5, each time point has biological triplicates from left ventricle (LV) and right ventricle (RV). B: principal components analysis (PCA) of whole genome expression profiles from microarray data on 9 time points shows the similarity of tissue samples within each time point and difference between different stages. LV and RV from same time point are colored with similar colors (see D, top, for color bar legend). C: differential comparison of time-course expression profiles within LV and RV by 2 statistical methods. Limma, linear model for microarray analysis; tc, time course. Red, limma-LV; green, limma-RV; blue, tc-LV; purple, tc-RV. D: dynamic time-course expression patterns shown by heat map for differential genes. Rows represent genes and columns for samples. Samples are arranged from left to right corresponding to the early developmental stage (R1 ESC) to adult (A). Column-side color bar indicates different groups: left (L) ventricle and right (R) ventricle, with the same colors in PCA plot of B. Blue in the heat map represents low expression level, and orange represents high expression level. E: expression heat maps for known pluripotent genes (top), precardiac markers (middle), and cardiac markers (bottom).
Differential gene expression analysis reveals genome-wide molecular signatures during natural cardiogenesis.
Based on the patterns revealed by PCA and clustering analysis, temporally DEGs across the time-course were first identified within each ventricle group. As different statistical methods have slightly different sensitivities to the same data set and in order to verify the DEGs, linear models for microarray analysis (limma) (29) and multivariate empirical Bayes time-course model (tc: timecourse) (33) were applied (see materials and methods). Following differential analysis and FDR control to correct for multiple hypothesis tests, genes were independently ranked based on two statistical approaches by either adjusted P values from the R limma package (29) or by one-sample multivariate empirical Bayes statistics (the MB statistics, a variant of one-sample Hotelling T2 statistic) from the R “timecourse” package (33). The top 10,000 differentially expressed probe-sets from a total of 45,000 on the microarrays in both LV and RV groups were selected using both methods for the comparison and cross validation (Fig. 2C). The P value cutoff for the top 10,000 differential probe-sets was 10e-7 in the limma model and the one-sample MB statistic at 800 in the “timecourse” model. The differentially expressed genes identified by the two models demonstrated at least twofold change during cardiogenesis. As revealed by PCA (Fig. 2B) and clustering analysis, expression profiles in LV and RV were similar to each other with 90% overlap of genes differentially expressed over time (Fig. 2C, top). Furthermore, the results from both methods have ∼80% overlap (Fig. 2C, bottom). The heat map revealed that the majority of DEGs in cardiogenesis fall into two major categories: off/on (or activating, from blue to orange) or on/off (or deactivating, from orange to blue). Gene expression patterns of E8.5–E9.5, E12.5–E14.5, and E18.5–D3 were similar (Fig. 2D). Established pluripotent, precardiac, and cardiac markers were extracted from the time-course expression data (Fig. 2E). The selected profiles show that pluripotent genes express highly in ESCs and diminish at E7.5/E8.5. Precardiac markers have peak expressions around E7.5. Cardiac markers begin expression at E8.5 and remain highly expressed throughout the adult heart. Many cardiac markers are involved in anterior-posterior patterning and morphogenesis, such as Gata4, Tbx5, Nkx2–5, and Mef2c (21). In addition to general expression trends, the expression analysis captured differential expression patterns between LV and RV, such as Tdgf1, Bmp2, Cxcr4, Dkk1, and Isl1. Therefore, our transcriptome analysis of selected stages demonstrated the dramatic changes of genome-wide molecular signatures required for natural cardiogenesis.
Stage-specific cellular functions mapped during cardiogenesis according to clusters of gene expression.
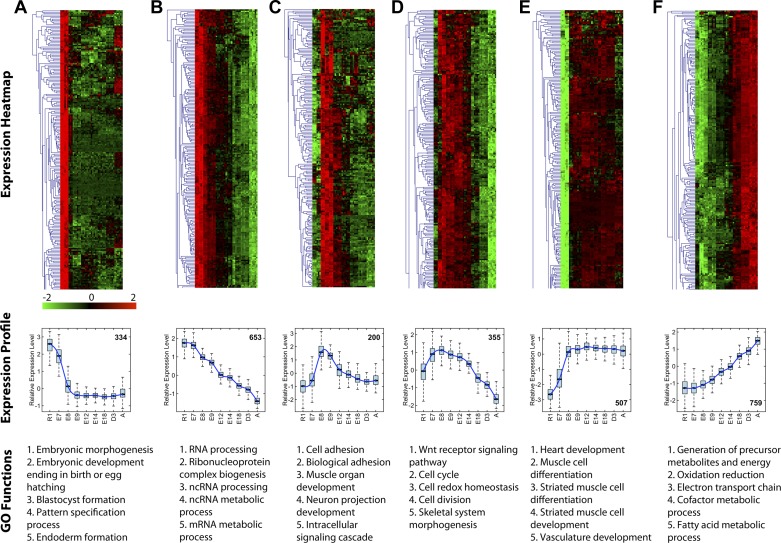
To investigate conserved stage-specific gene functions during cardiogenesis, supervised K-means clustering was performed. Unsupervised hierarchical clustering was then performed on individual clusters. Gene Ontology (GO) functional analysis prioritized enriched gene functions for each cluster. Representative plots of six of the 20 clusters ranging from early to late cardiac stages show distinct expression profiles unique to the developmental stages (Fig. 3). The cluster highly expressed at early stages (ESC and E7.5) contains genes whose functions are associated with embryonic morphogenesis and development, blastocyst formation, pattern specification, endoderm formation, and stem cell maintenance (Fig. 3A). GO functions, such as cell adhesion, muscle organ development, neuron projection development, and intracellular signaling cascade, are prioritized in the cluster of genes enriched at E8.5 and E9.5 with dramatic decrease in expression by E12.5/E14.5 (Fig. 3C). Notably, genes in Wnt receptor signaling, cell cycle, cell redox homeostasis, cell division, and skeletal muscle morphogenesis peaked at E7.5 and E8.5 and then gradually decreased expression from E9.5 to 3 days after birth (Fig. 3D). Functions linked to heart development, striated muscle cell differentiation and development, and vasculature development are all induced abruptly at E7.5–8.5 and remain highly expressed throughout the adult heart (Fig. 3E). Energy metabolism pathways including generation of precursor metabolites and energy, oxidation-reduction, electron transport chain, cofactor metabolic process, and fatty acid metabolism are gradually upregulated to peak only at the postnatal stages of development (Fig. 3F). Beyond the expected pathways previously known to be involved in cardiogenesis, an early expressed group of genes was associated with functions of RNA processing, ribonucleoprotein complex biogenesis, ncRNA processing and metabolism, and mRNA metabolism that gradually decreased from ESC to adult heart tissues (Fig. 3B). By controlling the genetic information transfer from genome to final protein products (26), these tightly grouped genes provide a prioritized wave of regulatory functions not previously recognized as essential for early processes of proper cardiogenesis.
Fig. 3.
Distinct gene functions associate with temporal expression patterns in cardiogenesis. K-means clustering was performed on the ∼8,500 differential genes identified by the 2 statistical methods to cluster the genes into groups according to their expression profiles. Gene Ontology (GO) function analysis for each cluster was performed to investigate the enriched functions within specific patterns. Heat maps and boxplots show the gene expression patterns at each time point for genes in that cluster and smooth lines in boxplots are based on a spline model and highlight the gene expression trend in each cluster. Functions associated with each cluster are listed below the boxplots (ordered by statistical significance). The first 200 genes in each cluster are illustrated as a heat map with the total numbers of genes in each cluster are listed in boxplots.
Sequential gene activation and deactivation of individual family members delineates distinctive regulatory gene functions.
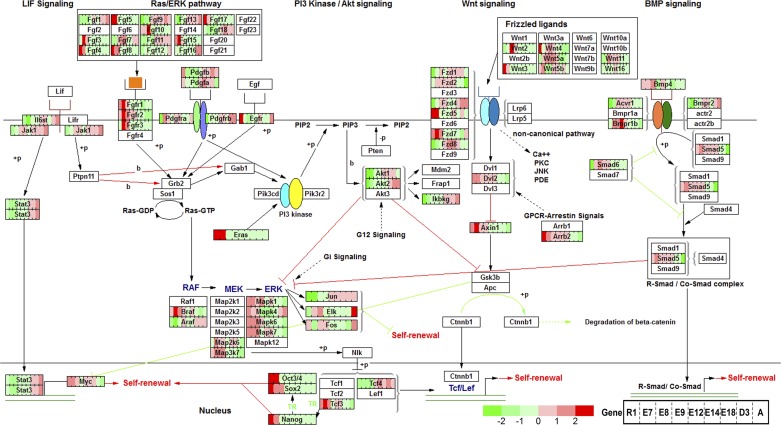
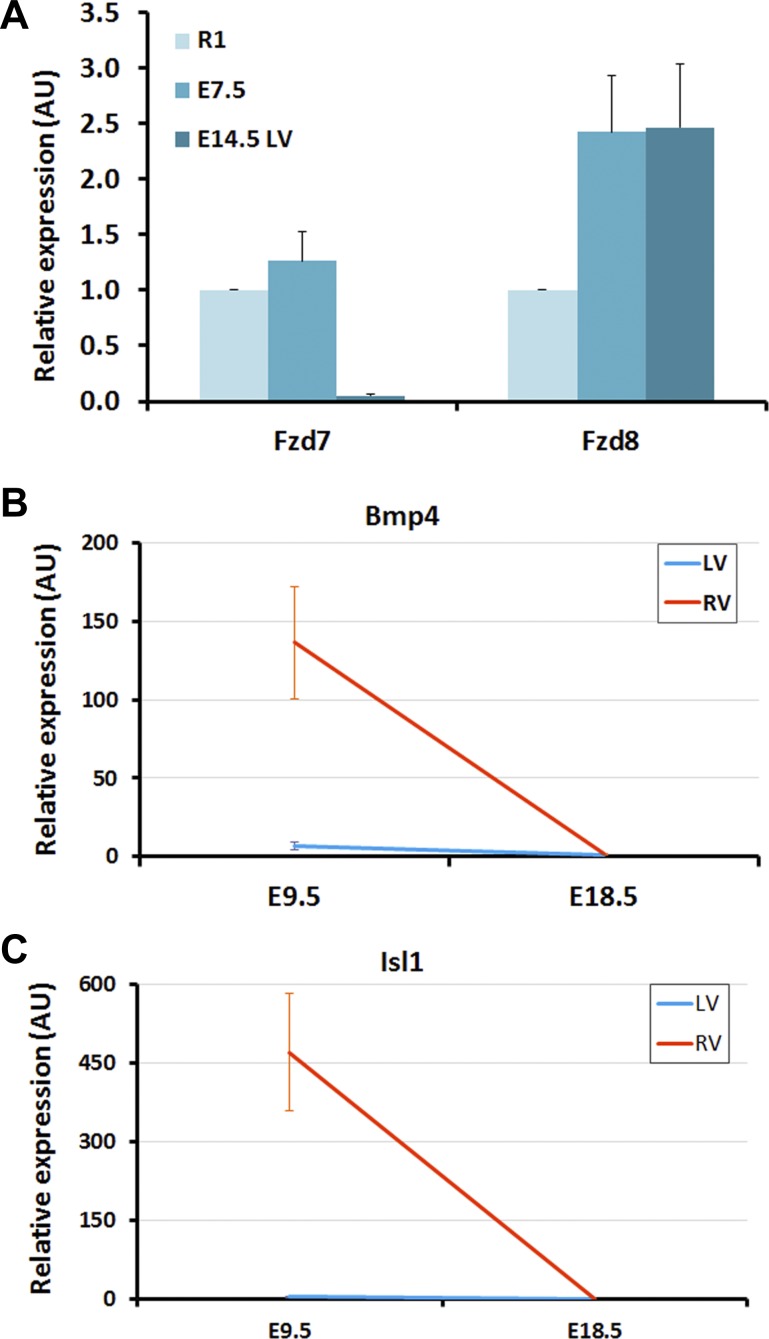
To probe the dynamic expression patterns and selection of regulatory hubs during embryonic development, the time-course expression profiles from pluripotent stem cells to adult heart tissue were mapped to canonical pathways required for normal heart development (Figs. 4–6). Pluripotent stem cell pathways including Oct4 (Pou5f1), Sox2, Nanog, Eras, and Myc were characteristically expressed in the early stages of development and abruptly downregulated as cardiogenesis transitioned into the first embryonic week (Fig. 4). More importantly, the relative expression map revealed that genes from a single family have distinct expression sequences that may regulate sequential acquisition of evolving cellular functions. For example, in the Wnt signaling pathway Wnt3 is transiently expressed in ESC and E7.5 only to be replaced by high levels of Wnt2 and Wnt5a expression downstream. However, Wnt5b is expressed in the early stages (ESC and E7.5) and then returns to high expression at E12.5 to 3 days after birth. Similarly, Fzd5 and Fzd7 peak at ESC and E7.5 and abruptly decrease their expression, which are replaced by Fzd2, Fzd8, and Fzd1 at later stages. Other family members such as Fzd4 are predominantly expressed only in later stages of cardiogenesis. Similar expression patterns for differentially expressed genes in this pathway were observed in both LV (Fig. 4) and RV except for Bmp4 which is highly expressed in RV at E9.5 compared with LV. The distinctive expression patterns for Fzd7 and Fzd8 were verified by PCR results to confirm the sensitivity of the underlying microarray data set (see Fig. 8A).
Fig. 4.
Stage-specific expression of individual genes in Ras and Wnt pathway orchestrate cardiogenesis. Gene expression profiles in LV samples were mapped to mouse pluripotent stem cell pathways. Each gene is represented by a rectangular box that is divided into 9 subrectangles corresponding to 9 time points with ESC (R1) at the left and adult heart at the right of the box. Gene expression data are mapped to gene boxes with low expression in green and high expression in red. A gene with a white box indicates that it is not in the top differential list. Gene expression in RV shows similar results.
Fig. 6.
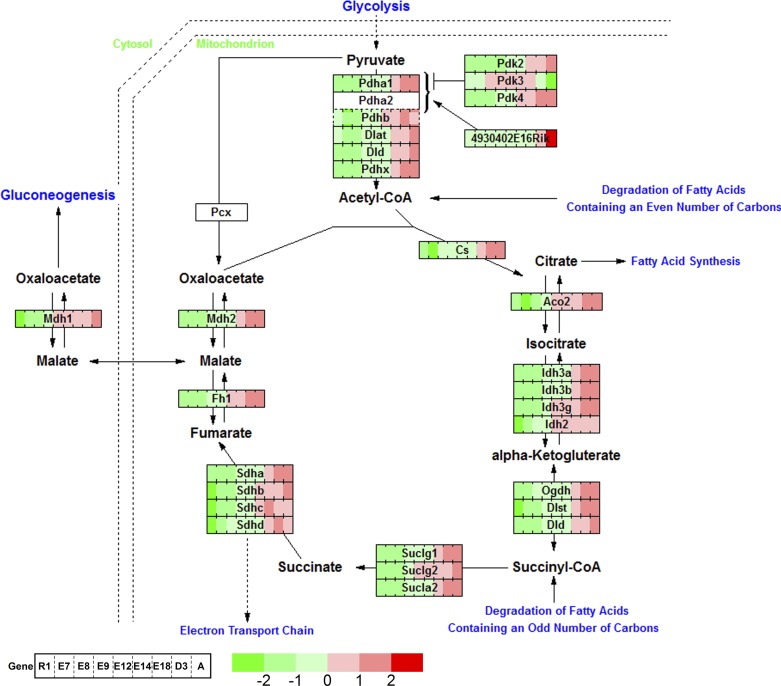
Oxidative energy metabolism peaks at late stages of cardiogenesis. Genes related to energy metabolism in the TCA cycle gradually increase their expression and peak at the adult heart, which coincides with the energy requirement. Pdk3 is a notable gene that is highly expressed from E8.5 to E18.5 and turns down after birth.
Fig. 8.
PCR verification of microarray data. A: Frizzled genes, Fzd7 and Fzd8, were verified by quantitative real-time (qRT) PCR at 3 time points R1, E7.5 and E14.5 (LV). PCR results established Fzd7 peaks at early stage (E7.5) and Fzd8 peaks at later stage (E14.5), which confirmed the microarray expression patterns shown in Fig. 4. B: Bmp4, differentially expressed between LV and RV, was confirmed by qRT-PCR results. C: Isl1, differentially expressed between LV and RV, was confirmed by qRT-PCR results. The spatially differential patterns between LV and RV in microarray data for Bmp4 and Isl1 are shown in Fig. 7.
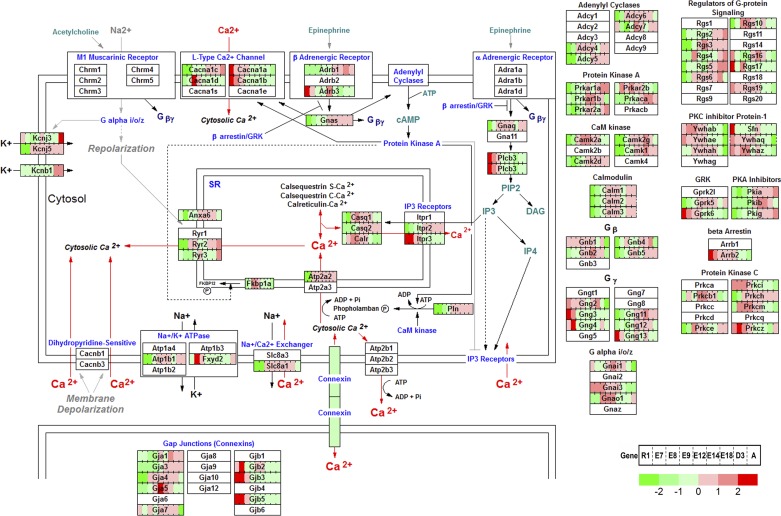
Calcium handling is central to cardiac excitation-contraction coupling. Our data showed that genes in the calcium regulation network in cardiac cells begin dynamic expression profiles at E8.5 (Fig. 5) coinciding with the induction of many cardiac-specific genes (Fig. 3E). For the L-type Ca2+ channel genes, Cacna1d is expressed at E8.5 and E9.5 but Cacna1c is induced later at E14.5 to adult heart. Conversely, Cacna1a and Cacna1b are only expressed within early stages at ESC and E7.5. For IP3 receptors, Itpr3 is expressed from ESC to E9.5, while Itpr2 expression starts around E12.5 and is sustained to the adult heart. Similarly, Gjb family members (Gjb2,3,5) are expressed in the early stages while Gja family members (Gja1,3,4,5) are turned on at later stages of heart development. The results suggested that functions of genes from the same family in development are temporally regulated and complementary. Metabolic regulation during cell fate decisions is influenced by the expression of genes in the TCA cycle of energy metabolism (8). Mapping our time-course expression data to the oxidative pathway shows gradually increasing expression throughout cardiogenesis and reaches maximum levels in the adult heart, coinciding with the increasing cardiac energy requirement to circulate blood according to physiological demands (Fig. 6). Notably, Pdk3 is the only gene in the TCA cycle to peak at mid-embryonic stages, from E8.5 to E18.5 and subsequently turned down after birth. Pdk3 functions as a metabolic switch between glycolysis and mitochondrial respiration, which implies that the energy required for the heart during embryogenesis is provided by glycolysis, whereas the energy requirement later in cardiogenesis switches to predominately mitochondrial respiration (17). Pdk3 is induced by Hif1a, which is also downregulated after birth (Supplemental Table S1). Furthermore, mapping these dynamic transcriptomic data to other pathways in the GenMapp database (28) revealed similar results, indicating genes from the same family play stage-specific roles at different developmental periods to orchestrate proper cardiogenesis.
Fig. 5.
The dynamic gene expression profiles of LV in calcium regulation in cardiac cells.
Similar gene expression profiles in LV and RV.
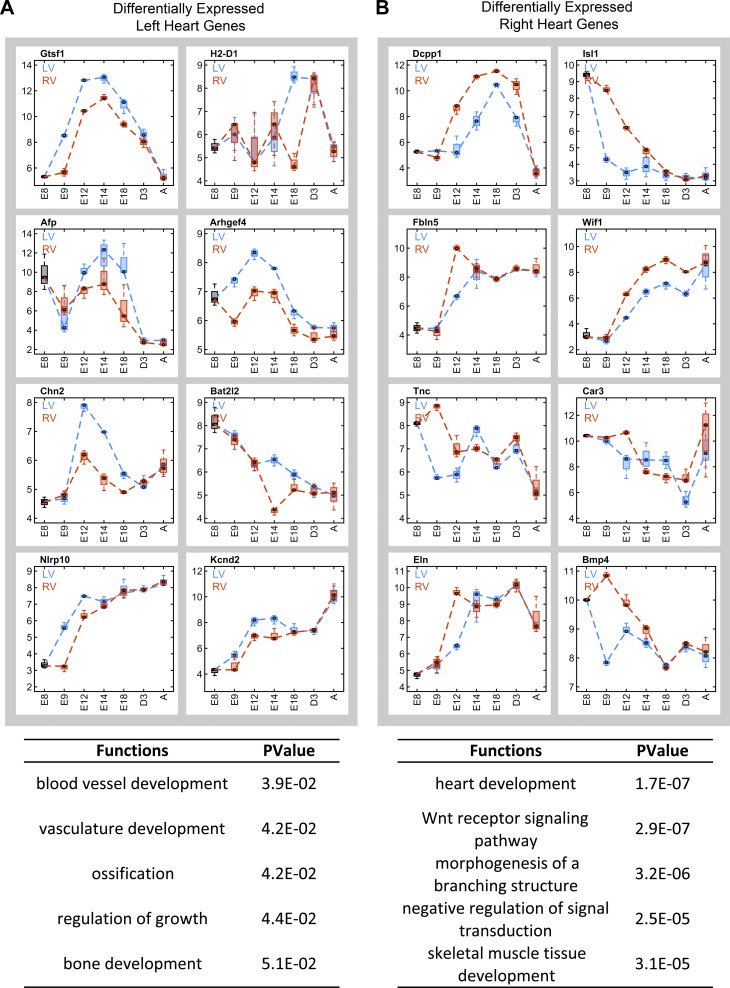
The right and left sides of the heart are derived from distinctive embryonic origins and meet dramatically different functional requirements. However, the temporal differential analyses across the time-course in LV and RV respectively reveal a transcriptome profile with 90% overlap of DEGs between the two ventricles (Fig. 2C). The similarity of gene expression profiles is also highlighted by the correlation analysis of LV vs. RV (with correlation coefficients > 0.99). Expression profiles from LV and RV mapped to the same pathways showed few global differences between the two chambers (data not shown for RV). To further investigate potential differences in gene expression profiles between ventricles, spatial and temporal differential analysis using the R “timecourse” package based on two-sample multivariate empirical Bayes model (33) was performed with E8.5 as a common starting time point for both ventricles to E9.5, E12.5, E14.5, E18.5, D3 (3 days after birth), and adult heart tissues. Gene expression patterns for the top eight differentially expressed genes in LV and RV are shown in Fig. 7 (Supplemental Table S1 lists the entire profile of differential genes between LV and RV). Tenascin C (Tnc) and Bmp4 are more highly expressed in RV than LV at E9.5 and then converge to equivalent expression levels at later stages. Although Isl1 decreased its expression from E8.5 to the adult heart, it demonstrated higher expression in RV at E9.5 and E12.5 compared with expression levels in LV that decreased abruptly at E8.5 to E9.5 (Figs. 7B and 2E). Analogous to Isl1, the homeobox gene Meis2, a known regulator of cardiac development (25), was highly expressed in RV at stages E9.5 and E12.5 (data not shown). Notably, expression differences in DEGs between the two ventricles, even among the top eight genes with the most significant differences (Fig. 7), are relatively insignificant compared with expression level changes between stages of development. The differential expression patterns of microarray data between LV and RV for Bmp4 and Isl1 were verified by PCR results (Fig. 8, B and C).
Fig. 7.
Differential gene expression profiles between LV and RV. Differential analysis between LV and RV is performed with the E8.5 group as a starting time point throughout adult heart. A: top 8 differential genes highly expressed in LV with light blue for LV and red for RV. Boxplots show the gene expression distributions at each time point. Enriched GO functions are shown for the top 200 transcripts highly expressed in LV. Enriched functions are ranked based on statistical P values calculated via hypergeometric distribution. B: top 8 differential genes highly expressed in RV. Enriched GO functions are shown for the top 200 transcripts highly expressed in RV.
Prioritization of conserved pathways disrupted in congenital heart disease.
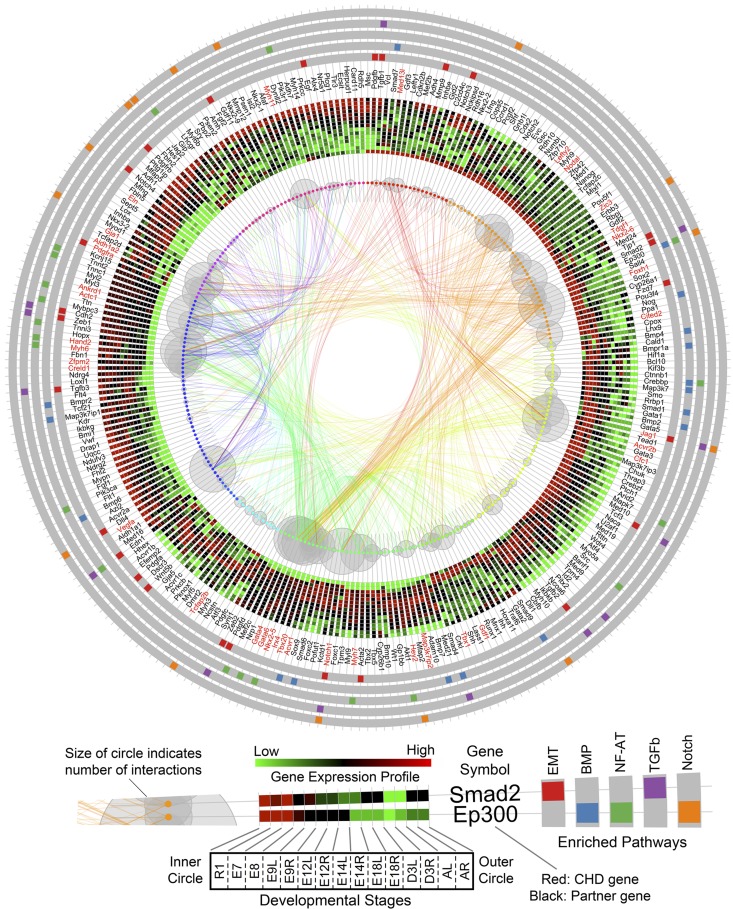
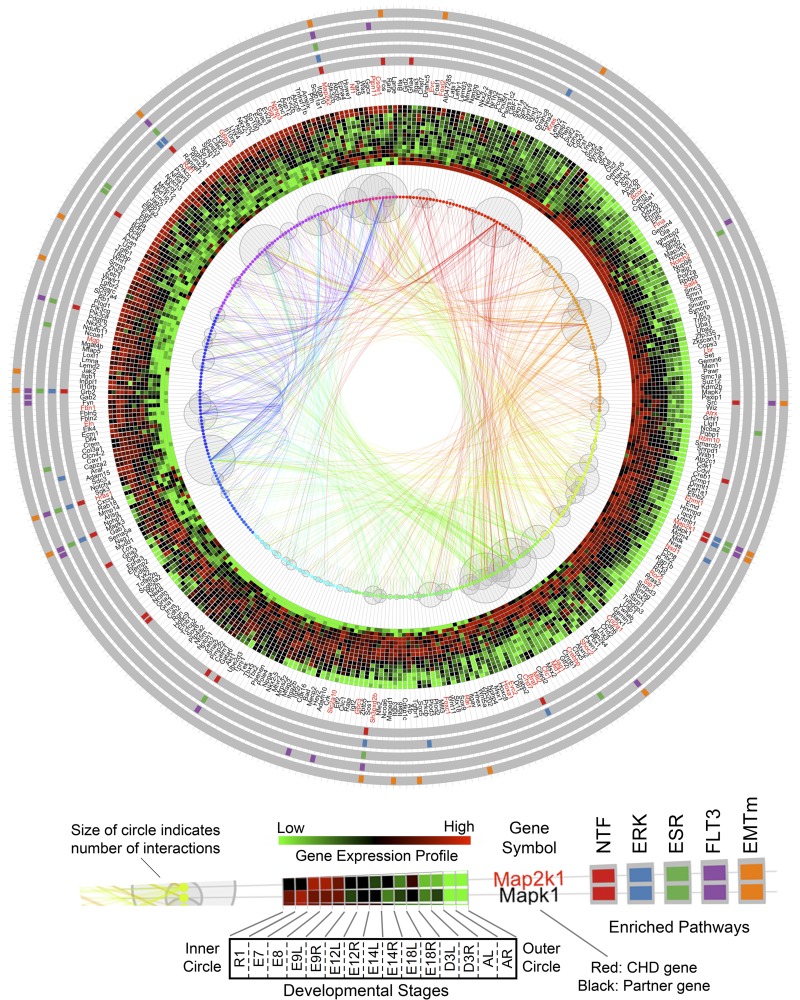
This comprehensive roadmap of natural cardiogenesis enables a bioinformatic examination of the molecular mechanisms inherent to CHD. To prioritize conserved pathways disrupted by CHD-related genes, we analyzed 36 nonsyndromic CHD genes and 50 syndromic CHD genes (3). Each gene in this curated set was used as a seed to query the gene interaction database to extract its top 10 interacting partners based on the confidence score of interaction (9). Both node-edge information and confidence scores were retrieved. Our results showed a subset of genes as common partners for more than one seed gene, which suggested their communicating roles for those individual networks. In total, 236 genes were annotated for the 36 nonsyndromic CHD genes. Using the expanded list of 272 genes, we performed enriched pathway analysis to prioritize the potential conserved pathways disrupted within the embedded developmental interactome. Traditional gene interaction network (node-edge) visualization, especially with a large number of involved genes, generates a hairball structure that blurs the interaction and hub genes. To reconcile the interactome, we developed a custom R package to integrate the results in a single multilayer circular plot (Fig. 9) that incorporates transcriptome information (shown as heat map), known CHD genes (or partners), pathway enrichment analysis, and hub genes connecting these pathways. Our results demonstrate that Foxh1, Acvr2b, Notch1, Nkx2–5, Gata4, Gata6, Vegfa, Hand2, and Actc1 (indicated by larger gray circles representing the larger number of gene-specific interactions) are major hub genes that are genetically linked to CHD and have dynamic expression profiles during natural cardiogenesis (Fig. 9). Our integration strategy also reveals that genes involved in the regulation of EMT (red bars on gray band) are distributed throughout early to late stages of heart development. However, the BMP pathway (blue) is predominately expressed during early embryonic stages, followed by activation of the NF-AT pathway (green) in later stages of cardiogenesis. Other disrupted pathways include TGF-beta-dependent induction of EMT via SMADS and Notch signaling. Many genes are linked to more than two pathways, such as Ep300, Jag1, Tcf3, Tgfb2, Smad4, Notch1, Zeb2, Edn1, Tgfb3, Zeb1, Cdh2, and Tgfb1, which together connect functional pathways into a larger interdependent network implicated in CHD. In addition, similar analysis was performed on the 50 syndromic CHD genes and revealed the top disrupted developmental functions including Neurotrophin family signaling, ERK1/2 signaling pathway, Ligand-independent activation of ESR1 and ESR2, Flt3 signaling, and TGF-beta-dependent induction of EMT via MAPK. Notably, these pathways involve several MAPK family genes, Map2k1, Mapk1, Mapk3, Map2k2, and Sos1, Akt1, Hras1, Grb2, Pik3a, and Raf1 as major hub genes (Fig. 10).
Fig. 9.
Prioritized conserved pathways disrupted by nonsyndromic CHD genes. Genes closely associated with CHD are mapped according to relative expression levels during stage-specific tissue formation of natural cardiogenesis. Early expressed genes in ESC (starting at 12 o'clock position) to late expressed genes in adult heart clockwise are mapped. Genes are represented by dots with surrounding gray bubbles indicating the number of interactions with the other genes. Linking curves indicate gene-gene interactions from interactome database. The width of line corresponds to the confidence score of that interaction. Radially orientated heat maps show the dynamic time-course expression profile with ESC positioned at the inner layer and adult heart at outer layer. Starting at E9.5, there are both LV and RV stage-specific samples embedded within the heat maps for each gene. The heat map shows the average expression level of triplicate samples at each stage-specific and ventricle-specific data points. Official gene symbols are labeled with red for known CHD genes and black for associated partner genes. The outer 5 circular bands with gray background show the top 5 enriched pathways for the 272 genes with color bars linking individual genes with associated pathways. The top 5 pathways are, from inner to outer, regulation of epithelial-to-mesenchymal transition (EMT), BMP signaling, NF-AT signaling in cardiac hypertrophy, TGFb-dependent EMT, and Notch signaling pathway.
Fig. 10.
Prioritized conserved pathways disrupted by syndromic CHD genes. Known syndromic CHD genes were collected and used as seeds to query the gene interaction database and retrieve the top 10 partners for each of them. Then genes were arranged clockwise according to their expression profiles from early to late in cardiogenesis: Early expressed genes in ESC (starting at 12 o'clock position) to late expressed genes in adult heart. Genes are represented by dots with surrounding gray bubbles indicating the number of interactions with the other genes. Linking curves indicate gene-gene interactions from interactome database. The width of line corresponds to the confidence score of that interaction. Heat map shows the dynamic time-course expression profile for each gene at 9 different developmental stages with ESC in inner circle and adult heart at outer circle. Starting at E9.5, there are LV and RV. The heat map shows the average expression level of triplicate samples at each time point. Official gene symbols are labeled after the heat map with red for known CHD genes and black for their partner. The outer 5 bands with gray background show the top 5 enriched pathways for the known syndromic CHD-genes are, from inner to outer, Neurotrophin family signaling (NTF), ERK1/2 signaling pathway (ERK), Ligand-independent activation of ESR1 and ESR2 (ESR), Flt3 signaling (FLT3), TGF-beta-dependent induction of EMT via MAPK (EMTm). Color bars indicate which genes are identified in each pathway. The analysis revealed genes from MAPK family as the critical hub genes implicated in syndromic CHD.
DISCUSSION
The heart is the first organ formed during embryogenesis via a series of complex steps involving simultaneous morphogenesis and differentiation. Development of the heart requires precise control of early pluripotent gene expression evolving into tissue-specific profiles. Slight perturbations in these transition periods may cause severe cardiac malformations. To advance the understanding of the molecular underpinnings of cardiogenesis, we performed a holistic survey of transcriptome profiles across discrete stages of embryonic development and established a comprehensive transcriptome landscape of natural cardiogenesis using time-course microarray. Our results showed dramatic differential expression changes across a large number of genes during cardiogenesis, revealing a previously unrecognized complexity that regulates transcriptional networks during cardiac morphogenesis. The identified molecular signatures defining these stages may enhance the molecular knowledge of heart developmental biology, facilitate CHD mechanistic investigations, and inform in vitro disease modeling of CHD genetics (1, 4, 7, 22, 32).
Our study identified temporal gene function maps within and between LV and RV that regulate proper morphogenesis by clustering genes into major groups based on their expression patterns using supervised algorithms followed by enrichment analysis. The majority of genes related to cardiac development are activated around E8.5 and have a sustained expression profile throughout adult hearts. Therefore, these genes are typically fully expressed at the stage of cardiac tube formation prior to septation and cardiac chamber formation. Furthermore, it is notable that individual genes within a family were distinctively expressed at different stages of development, indicating the roles of individual family members to modify transition states of cardiogenesis. Together, these previously unrecognized patterns provide the topography of gene expression that builds the complete landscape of natural cardiogenesis and illuminates individual genes within regulatory families to guide follow-up studies to map deterministic features.
The major embryonic distinctions of cardiac ontogeny are the primary and secondary heart fields, which provide progenitor cells for the development of the left- and right-sided structures of the heart. Notably, gene expression comparison between LV and RV established a remarkably similar pattern between both chambers during heart development with only a small number of differentially expressed genes among the total of 45,000 probe-sets/transcripts on microarray. In fact, the developmental stage of collected samples segregated with far greater certainty than the samples isolated from LV vs. RV of same time points (Fig. 2B). The similarities of the gene expression profiles between the two ventricles imply that the mechanism of distinctive right- and left-sided pathology in complex congenital heart defects may be modified beyond cell-autonomous regulatory networks and include regulatory hurdles such as posttranslational modifications. The highly consistent temporal regulation between LV and RV also suggests that mechanical or stress load variables during the development of a physiological system may contribute to chamber-specific functionality beyond the similarity of innate gene expression patterns.
This transcriptome scrutiny provides a roadmap to interpret candidate genes hypothesized to contribute to CHD, which is the leading cause of birth defect-related deaths with linkage of mutations in specific genes to specific phenotypes (3, 7). The etiology of CHD remains idiopathic and is hypothesized to involve complex modes of inheritance patterns such as haploinsufficiency and polygenetic mutations. Systems biology provides a powerful toolkit to enhance our understanding of CHD in terms of gene networks by integrating different types of genomic data (30). Herein, we identified the partners for known CHD-related genes and built a novel disease-centric interaction network from the context of natural cardiogenesis. Our findings showed that the top enriched pathways associated with nonsyndromic CHD genes and their partners are EMT, BMP, NF-AT, TGFb-dependent EMT, and Notch pathways, found to be expressed at different developmental stages. Notably, a subset of known CHD genes in the interactome are specifically expressed in pluripotent or precardiac stages of development. This indicates the possibility of a new mechanistic paradigm whereby genes expressed prior to cardiac maturation could modulate or contribute to latent expression dysregulation leading to structural heart defects, despite the absence of gene expression in developing cardiac tissues. Another novel finding in this study is that the genes involved in the syndromic CHD are mainly related to the MAPK family, which affect many different pathways and are distinct from the nonsyndromic CHD.
Microarray technology is a powerful tool with which one can investigate a whole transcriptome simultaneously. However, it is limited by the heterogeneity of biological materials in the experiments, especially in studies of organogenesis that inevitably involve multiple tissue or cell types. In this study, whole embryo tissues (E7.5) and whole ventricle tissues were used in a microarray experiment. These tissue samples contain multiple cell types that are vital to proper cardiogenesis. The expression levels of genes detected by microarray are the average expression levels among these cells, and one should exercise caution in interpreting gene expression using this roadmap. In addition, the CHD interactome analysis is dependent on the current version of interactome database (STRING V9.1). We expect that more interactions will show up in the network presented here as more interaction information is added into the database. However, we do not expect dramatic changes in the hub genes identified in our study.
In summary, this atlas of cardiogenic gene expression provides a bioinformatics platform to partition and visualize evolutionarily conserved molecular features of cardiogenesis from sequential differentiation of pluripotent stem cells to mature adult cardiac tissues. This blueprint of innate developmental gene expression now permits comparative analysis of proposed CHD-causing mechanisms by which to decipher temporal relationships and identify molecular targets for novel diagnostic and therapeutic strategies. Individual genes or pathways that are hypothesized to contribute to CHD may now be analyzed according to their natural expression profiles within the context of stage-specific regulatory mechanisms to define the balance between health and disease.
GRANTS
This study was supported by the American Heart Association (postdoctoral fellowship, A. Martinez-Fernandez), National Institute of Health (OD007015-01, T. J. Nelson), Marriot Heart Disease Program, Mayo Clinic Center for Regenerative Medicine, Fondation Leducq, and Todd and Karen Wanek Family Program for Hypoplastic Left Heart Syndrome.
DISCLOSURES
No conflicts of interest, financial or otherwise, are declared by the author(s).
AUTHOR CONTRIBUTIONS
Author contributions: X.L., A.M.-F., K.A.H., J.-P.A.K., A.T., and T.J.N. conception and design of research; X.L., A.M.-F., and K.A.H. performed experiments; X.L., A.M.-F., T.M.O., and T.J.N. analyzed data; X.L., A.M.-F., and T.J.N. interpreted results of experiments; X.L. and T.J.N. prepared figures; X.L. and T.J.N. drafted manuscript; X.L., A.M.-F., K.A.H., J.-P.A.K., T.M.O., A.T., and T.J.N. edited and revised manuscript; T.J.N. approved final version of manuscript.
Supplementary Material
ACKNOWLEDGMENTS
The authors thank the Mayo Clinic Gene Expression Core for performing the microarray experiment.
Footnotes
The online version of this article contains supplemental material.
REFERENCES
- 1.Addis RC, Epstein JA. Induced regeneration–the progress and promise of direct reprogramming for heart repair. Nat Med 19: 829–836, 2013. [DOI] [PMC free article] [PubMed] [Google Scholar]
- 2.Bar-Joseph Z, Gitter A, Simon I. Studying and modelling dynamic biological processes using time-series gene expression data. Nat Rev Genet 13: 552–564, 2012. [DOI] [PubMed] [Google Scholar]
- 3.Barriot R, Breckpot J, Thienpont B, Brohee S, Van Vooren S, Coessens B, Tranchevent LC, Van Loo P, Gewillig M, Devriendt K, Moreau Y. Collaboratively charting the gene-to-phenotype network of human congenital heart defects. Genome Med 2: 16, 2010. [DOI] [PMC free article] [PubMed] [Google Scholar]
- 4.Bernstein HS, Srivastava D. Stem cell therapy for cardiac disease. Pediatr Res 71: 491–499, 2012. [DOI] [PubMed] [Google Scholar]
- 5.Brettschneider J, Collin F, Bolstad BM, Speed TP. Quality assessment for short oligonucleotide microarray data. Technometrics 50: 241–264, 2008. [Google Scholar]
- 6.Christoffels VM, Pu WT. Developing insights into cardiac regeneration. Development 140: 3933–3937, 2013. [DOI] [PubMed] [Google Scholar]
- 7.Fahed AC, Gelb BD, Seidman JG, Seidman CE. Genetics of congenital heart disease the glass half empty. Circ Res 112: 707–720, 2013. [DOI] [PMC free article] [PubMed] [Google Scholar]
- 8.Folmes CDL, Nelson TJ, Martinez-Fernandez A, Arrell DK, Lindor JZ, Dzeja PP, Ikeda Y, Perez-Terzic C, Terzic A. Somatic oxidative bioenergetics transitions into pluripotency-dependent glycolysis to facilitate nuclear reprogramming. Cell Metab 14: 264–271, 2011. [DOI] [PMC free article] [PubMed] [Google Scholar]
- 9.Franceschini A, Szklarczyk D, Frankild S, Kuhn M, Simonovic M, Roth A, Lin JY, Minguez P, Bork P, von Mering C, Jensen LJ. STRING v9.1: protein-protein interaction networks, with increased coverage and integration. Nucleic Acids Res 41: D808–D815, 2013. [DOI] [PMC free article] [PubMed] [Google Scholar]
- 10.Gautier L, Cope L, Bolstad BM, Irizarry RA. affy - analysis of Affymetrix GeneChip data at the probe level. Bioinformatics 20: 307–315, 2004. [DOI] [PubMed] [Google Scholar]
- 11.Gentleman RC, Carey VJ, Bates DM, Bolstad B, Dettling M, Dudoit S, Ellis B, Gautier L, Ge YC, Gentry J, Hornik K, Hothorn T, Huber W, Iacus S, Irizarry R, Leisch F, Li C, Maechler M, Rossini AJ, Sawitzki G, Smith C, Smyth G, Tierney L, Yang JYH, Zhang JH. Bioconductor: open software development for computational biology and bioinformatics. Genome Biol 5: R80, 2004. [DOI] [PMC free article] [PubMed] [Google Scholar]
- 12.Go AS, Mozaffarian D, Roger VL, Benjamin EJ, Berry JD, Borden WB, Bravata DM, Dai SF, Ford ES, Fox CS, Franco S, Fullerton HJ, Gillespie C, Hailpern SM, Heit JA, Howard VJ, Huffman MD, Kissela BM, Kittner SJ, Lackland DT, Lichtman JH, Lisabeth LD, Magid D, Marcus GM, Marelli A, Matchar DB, McGuire DK, Mohler ER, Moy CS, Mussolino ME, Nichol G, Paynter NP, Schreiner PJ, Sorlie PD, Stein J, Turan TN, Virani SS, Wong ND, Woo D, Turner MB; American Heart Association Statistics Committee, Stroke Statistics Subcommittee. Heart disease and stroke statistics-2013 update: a report from the American Heart Association. Circulation 127: E6–E245, 2013. [DOI] [PMC free article] [PubMed] [Google Scholar]
- 13.Huang DW, Sherman BT, Lempicki RA. Systematic and integrative analysis of large gene lists using DAVID bioinformatics resources. Nat Protoc 4: 44–57, 2009. [DOI] [PubMed] [Google Scholar]
- 14.Irizarry RA, Bolstad BM, Collin F, Cope LM, Hobbs B, Speed TP. Summaries of affymetrix GeneChip probe level data. Nucleic Acids Res 31: 2003. [DOI] [PMC free article] [PubMed] [Google Scholar]
- 15.Irizarry RA, Hobbs B, Collin F, Beazer-Barclay YD, Antonellis KJ, Scherf U, Speed TP. Exploration, normalization, and summaries of high density oligonucleotide array probe level data. Biostatistics 4: 249–264, 2003. [DOI] [PubMed] [Google Scholar]
- 16.Kathiresan S, Srivastava D. Genetics of human cardiovascular disease. Cell 148: 1242–1257, 2012. [DOI] [PMC free article] [PubMed] [Google Scholar]
- 17.Kluza J, Corazao-Rozas P, Touil Y, Jendoubi M, Maire C, Guerreschi P, Jonneaux A, Ballot C, Balayssac S, Valable S, Corroyer-Dulmont A, Bernaudin M, Malet-Martino M, de Lassalle EM, Maboudou P, Formstecher P, Polakowska R, Mortier L, Marchetti P. Inactivation of the HIF-1 alpha/PDK3 signaling axis drives melanoma toward mitochondrial oxidative metabolism and potentiates the therapeutic activity of pro-oxidants. Cancer Res 72: 5035–5047, 2012. [DOI] [PubMed] [Google Scholar]
- 18.Martinez-Fernandez A, Li X, Hartjes KA, Terzic A, Nelson TJ. Natural cardiogenesis-based template predicts cardiogenic potential of induced pluripotent stem cell lines. Circ Cardiovasc Genet 6: 462–471, 2013. [DOI] [PMC free article] [PubMed] [Google Scholar]
- 19.McKinney-Freeman S, Cahan P, Li H, Lacadie SA, Huang HT, Curran M, Loewer S, Naveiras O, Kathrein KL, Konantz M, Langdon EM, Lengerke C, Zon LI, Collins JJ, Daley GQ. The transcriptional landscape of hematopoietic stem cell ontogeny. Cell Stem Cell 11: 701–714, 2012. [DOI] [PMC free article] [PubMed] [Google Scholar]
- 20.Misra J, Schmitt W, Hwang D, Hsiao LL, Gullans S, Stephanopoulos G. Interactive exploration of microarray gene expression patterns in a reduced dimensional space. Genome Res 12: 1112–1120, 2002. [DOI] [PMC free article] [PubMed] [Google Scholar]
- 21.Moorman AF, Christoffels VM. Cardiac chamber formation: development, genes, and evolution. Physiol Rev 83: 1223–1267, 2003. [DOI] [PubMed] [Google Scholar]
- 22.Nelson TJ, Terzic A. Induced pluripotent stem cells: an emerging theranostics platform. Clin Pharmacol Ther 89: 648–650, 2011. [DOI] [PubMed] [Google Scholar]
- 23.Olson EN. Gene regulatory networks in the evolution and development of the heart. Science 313: 1922–1927, 2006. [DOI] [PMC free article] [PubMed] [Google Scholar]
- 24.Olson EN, Schneider MD. Sizing up the heart: development redux in disease. Genes Dev 17: 1937–1956, 2003. [DOI] [PubMed] [Google Scholar]
- 25.Paige SL, Thomas S, Stoick-Cooper CL, Wang H, Maves L, Sandstrom R, Pabon L, Reinecke H, Pratt G, Keller G, Moon RT, Stamatoyannopoulos J, Murry CE. A temporal chromatin signature in human embryonic stem cells identifies regulators of cardiac development. Cell 151: 221–232, 2012. [DOI] [PMC free article] [PubMed] [Google Scholar]
- 26.Pauli A, Rinn JL, Schier AF. Non-coding RNAs as regulators of embryogenesis. Nature Rev Genet 12: 136–149, 2011. [DOI] [PMC free article] [PubMed] [Google Scholar]
- 27.Raychaudhuri S, Stuart JM, Altman RB. Principal components analysis to summarize microarray experiments: application to sporulation time series. Pac Symp Biocomput: 455–466, 2000. [DOI] [PMC free article] [PubMed] [Google Scholar]
- 28.Salomonis N, Hanspers K, Zambon AC, Vranizan K, Lawlor SC, Dahlquist KD, Doniger SW, Stuart J, Conklin BR, Pico AR. GenMAPP 2: new features and resources for pathway analysis. BMC Bioinformatics 8: 217, 2007. [DOI] [PMC free article] [PubMed] [Google Scholar]
- 29.Smyth GK. Linear models and empirical Bayes methods for assessing differential expression in microarray experiments. Stat Appl Genet Mol Biol 3: Article3, 2004. [DOI] [PubMed] [Google Scholar]
- 30.Sperling SR. Systems biology approaches to heart development and congenital heart disease. Cardiovasc Res 91: 269–278, 2011. [DOI] [PubMed] [Google Scholar]
- 31.Srivastava D. Making or breaking the heart: from lineage determination to morphogenesis. Cell 126: 1037–1048, 2006. [DOI] [PubMed] [Google Scholar]
- 32.Srivastava D, Berry EC. Cardiac reprogramming: from mouse toward man. Curr Opin Genet Dev 23: 574–578, 2013. [DOI] [PMC free article] [PubMed] [Google Scholar]
- 33.Tai YC, Speed TP. A multivariate empirical Bayes statistic for replicated microarray time course data. Ann Stat 34: 2387–2412, 2006. [Google Scholar]
- 34.van der Bom T, Bouma BJ, Meijboom FJ, Zwinderman AH, Mulder BJM. The prevalence of adult congenital heart disease, results from a systematic review and evidence based calculation. Am Heart J 164: 568–575, 2012. [DOI] [PubMed] [Google Scholar]
- 35.van der Linde D, Konings EEM, Slager MA, Witsenburg M, Helbing WA, Takkenberg JJM, Roos-Hesselink JW. Birth prevalence of congenital heart disease worldwide a systematic review and meta-analysis. J Am Coll Cardiol 58: 2241–2247, 2011. [DOI] [PubMed] [Google Scholar]
- 36.Wilson CL, Miller CJ. Simpleaffy: a BioConductor package for Affymetrix quality control and data analysis. Bioinformatics 21: 3683–3685, 2005. [DOI] [PubMed] [Google Scholar]
- 37.Wu SM, Chien KR, Mummery C. Origins and fates of cardiovascular progenitor cells. Cell 132: 537–543, 2008. [DOI] [PMC free article] [PubMed] [Google Scholar]
Associated Data
This section collects any data citations, data availability statements, or supplementary materials included in this article.


