Abstract
Extracting neural structures with their fine details from confocal volumes is essential to quantitative analysis in neurobiology research. Despite the abundance of various segmentation methods and tools, for complex neural structures, both manual and semi-automatic methods are ine ective either in full 3D or when user interactions are restricted to 2D slices. Novel interaction techniques and fast algorithms are demanded by neurobiologists to interactively and intuitively extract neural structures from confocal data. In this paper, we present such an algorithm-technique combination, which lets users interactively select desired structures from visualization results instead of 2D slices. By integrating the segmentation functions with a confocal visualization tool neurobiologists can easily extract complex neural structures within their typical visualization workflow.
Keywords: Computer Graphics [I.3.8]: Methodology and Techniques; Interaction techniques; Image Processing and Computer Vision [I.4.6]: Segmentation; Region growing, partitioning; Life and Medical Sciences [J.3]: Biology and genetics
1 Introduction
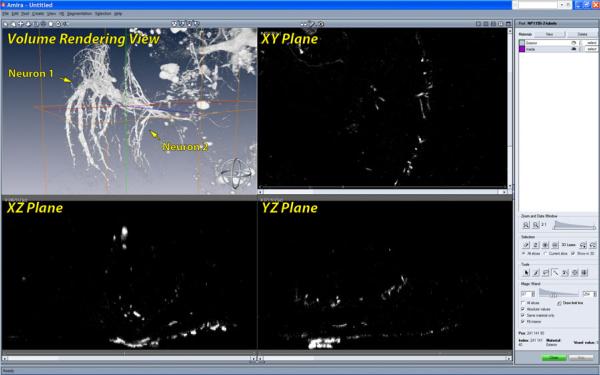
In neurobiology research, data analysis focuses on extraction and comparison of geometric and topological properties of neural structures acquired from microscopy. In recent years, laser scanning confocal microscopy has gained substantial popularity because of its capability of capturing fine-detailed structures in 3D. With laser scanning confocal microscopy, neural structures of biological samples are tagged with fluorescent staining and scanned with laser excitation. Although there are tools that can generate clear visualizations and facilitate qualitative analysis of confocal microscopy data, quantitative analysis requires extracting important features. For example, a user may want to extract just one of two adjacent neurons and analyze its structure. In such case, segmentation requires the user's guidance in order to correctly separate the desired structure from the background. There exist many interactive segmentation tools that allow users to select seeds (or draw boundaries) within one slice of volumetric data. Either the selected seeds grow (or the boundaries evolve) in 2D and then user repeats the operation for all slices, or the seeds grow (or the boundaries evolve) three dimensionally. Interactive segmentation with interactions on 2D slices may be su cient for structures with relatively simple shapes, such as most internal organs or a single fiber. However, for most neural structures from confocal microscopy, the high complexity of their shapes and intricacy between structures make even identifying desired structures from 2D slices difficult. Figure 1 shows the user interface of Amira [30], which is commonly used in neurobiology for data processing. Neurons of a Drosophila adult brain are loaded. From its interactive volume rendering view, two neurons are in proximity, whereas the fine structures of branching axons are merely distinct blobs in the 2D slice views. This makes 2D-slice-based interactions of most volume segmentation tools in neurobiology ine ective. It becomes difficult to choose proper seeds or draw boundaries on slices. Furthermore, even if seeds are chosen and their growth in 3D is automatic, it is difficult for unguided 3D growth to avoid over- or under-segmentations, especially at detailed and complex structures such as axon terminals. Lastly, there is no interactive method to quickly identify and correct the segmented results at problematic regions. With well-designed visualization tools, neurobiologists are able to observe the complex neural structures and inspect them from different view directions. Segmentation interactions that are designed based on volume visualization tools and let users select from what they see are apparently the most intuitive. In practice, confocal laser scanning can generate datasets with high throughput, and neurobiologists often conduct experiments and scan multiple mutant samples in batches. Thus, a segmentation algorithm for neural structure extraction from confocal data also needs to make good use of the parallel computing power of contemporary PC hardware and generate a stable segmented result with real-time speed.
Figure 1.
The user interface for segmentation in Amira. In the volume rendering view, we can observe that two neurons are in proximity and have complex details. However it is difficult to tell them apart or infer their shapes from any of the slice views. Unfortunately, users have to select structures from the slice views rather than the volume rendering view, where they can actually see the data more clearly. Many interactive volume segmentation tools in neurobiology use similar interactions, which are difficult to use for complex shapes.
The contribution of this paper is a novel segmentation method that is able to interactively extract neural structures from confocal microscopy data. It uses morphological diffusion for region-growing, which can generate stable results for confocal data in real-time; its interaction scheme explores the visualization capabilities of an existing confocal visualization system, FluoRender [31], and lets users paint directly on volume rendering results and select desired structures. The algorithm and interaction techniques are discussed in this paper, which is organized as follows: Section 2 discusses related work; Section 3 introduces morphological diffusion by formulating it as an anisotropic diffusion under non-conserving energy transmission; Section 4 uses the result from Section 3 and details our interactive scheme for confocal volume segmentation; Section 5 discusses implementation details and results; and the paper concludes in Section 6.
2 Related Work
Current segmentation methods for volumetric data are generally categorized into two kinds: full manual and semi-automatic. The concept of fully automatic segmentation does exist, however either the implementations are limited to ideal and simple structures, or they require complex parameter adjustment, or a vast amount of manually segmented results are used for training. They fail in the presence of noisy data, such as confocal scans. Thus, robust fully automatic segmentation methods do not exist in practice, especially in cases described in the introduction, where complex and intricate structures are extracted according to users’ research needs.
In biology research, fully manual segmentation is still the most-used method. Though actual tools vary, they all allow selecting structures from each slice of volumetric data. For example, Amira [30] is often used for extracting structures from confocal data. For complex structures, such as neurons in confocal microscopy data, it requires great familiarity with the data and the capability of inferring 3D shapes from slices. For the same confocal dataset shown in Figure 1, it took one of the neurobiologist co-authors one week to manually select one neuron, since it was difficult to separate the details of the two neurons in proximity. However, such intense work would not guarantee a satisfactory result: some fine fibers of low scalar intensities might be missing. Even when the missing parts could be visualized with a volume rendering tool, it was still difficult to go back and track the problems within the slices. To improve the e ciency of manual segmentations, biologists have tried different methods. For example, VolumeViewer from Sowell et al. [26] allows users to draw contours on oblique slicing planes, which helps surface construction for simple shapes but is still not e ective for complex structures. Using the volume intersection technique from Martin and Aggarwal [13] or Space Carving from Kutulakos and Seitz [10], Tay et al. [27] drew masks from two orthographic MIP renderings and projected them into 3D to carve a neuron out from their confocal data. However, the extracted neuron in their research had very simple shape.
For extracting complex 3D structures, semi-automatic methods, which combine specific segmentation algorithms with user guidance, seem to be more advantageous than manual segmentation. However, choosing an appropriate combination of algorithm and user interaction for a specific segmentation problem, such as neural structure extraction from confocal data, remains an active research topic. Though the variety of segmentation algorithms is myriad, which cannot be enumerated here, many of them for extracting irregular shapes consist of two major calculations, i.e. noise removal and boundary detection. Most filters designed for 2D image segmentation can be easily applied for volumetric data. Filters commonly seen include all varieties of low-pass filters, bilateral filters, and rank filters (including median filter, as well as dilation and erosion from mathematical morphology) [6]. Boundaries within the processed results are very commonly extracted by calculations on their scalar values, gradient magnitudes, and sometimes curvatures. Prominent segmentation algorithms that see many practical applications in biology research include watershed [28], level set [15], and anisotropic diffusion [19]. The latest technological advances in graphics hardware allow interactive application of many previously proposed algorithms to volumetric data. Sherbondy et al. [24] implemented anisotropic diffusion on programmable graphics hardware and applied the framework to medical volume data. Viola et al. [29] implemented nonlinear filtering on graphics hardware and applied it to segmenting medical volumes. Lefohn et al. [11] implemented the level-set algorithm on graphics hardware and demonstrated an interactive volume visualization/segmentation system. Jeong et al. [8] applied the level-set method to EM datasets, and they demonstrated an interactive volume visualization/segmentation system. Hossain and Möller [7] presented an anisotropic diffusion model for 3D scalar data, and used the directional second derivative to define boundaries. Saad et al. [22] developed an interactive analysis and visualization tool for probabilistic segmentation results in medical imaging. They demonstrated a novel uncertainty-based segmentation editing technique, and incorporated shape and appearance knowledge learned from expert-segmented images [21] to identify suspicious regions and correct the misclassification results. Kniss and Wang [9] presented a segmentation method for image and volume data, which is based on manifold distance metrics. They explored a range of feature spaces and allowed interactive, user-guided segmentation.
Most segmentation research has focused on improving accuracy and robustness, but little has been done from the perspective of user interactions, especially in real-world applications. Sketch-based interaction methods, which let users directly paint on volume rendering results and select desired structures, have demonstrated the potential towards more intuitive semi-automatic volume segmentation schemes. Yuan et al. [32] presented a method for cutting out 3D volumetric structures based on simple strokes that are drawn directly on volume rendered images. They used a graph-cuts algorithm and could achieve near-interactive speed for CT and MRI data. Chen et al. [5] enabled sketch-based seed planting for interactive region growing in their volume manipulation tool. Owada et al. [18] proposed several sketching user interface tools for region selection in volume data. Their tools are implemented as part of the Volume Catcher system [17]. Bürger et al. [3] proposed direct volume editing, a method for interactive volume editing on GPUs. They used 3D spherical brushes for intuitive coloring of particular structures in volu-metric scalar fields. Abeysinghe and Ju [1] used 2D sketches to constrain skeletonization of intensity volumes. They tested their interactive tool on a range of biomedical data. To further facilitate selection and improve quality, Akers [2] incorporated a tablet screen into his segmentation system for neural pathways. We extend the methodology of sketch-based volume selection methods. Our work focuses on searching for a combination of segmentation algorithm and interactive techniques, as well as developing an interactive tool for intuitive extraction of neural structures from confocal data.
3 Mathematical Background of Morphological Diffusion
For interactive speed of confocal volume segmentation, we propose morphological diffusion on a mask volume for selecting desired neural structures. Morphological diffusion can be derived as one type of anisotropic diffusion under the assumption that energy can be non-conserving during transmission. Its derivation uses the results from both anisotropic diffusion and mathematical morphology.
3.1 Diffusion Equation and Anisotropic Diffusion
The diffusion equation describes energy or mass distribution in a physical process exhibiting diffusion behavior. For example, the distribution of heat (u) in a given isotropic region over time (t) is described by the heat equation:
| (1) |
In Equation 1, c is a constant factor describing how fast temperature can change within the region. We want to establish a relationship between heat diffusion and morphological dilation. First we look at the conditions for a heat diffusion process to reach its equilibrium state. Equation 1 simply tells us that the change of temperature equals the divergence of the temperature gradient field, modulated by a factor c. We can then classify the conditions for the equilibrium state into two cases:
Zero gradient
Temperatures are the same everywhere in the region.
Solenoidal (divergence-free) gradient
The temperature gradient is non-zero, but satisfies the divergence theorem for an incompressible field, i.e. for any closed surface within the region, the total heat transfer (net heat flux) through the surface must be zero.
The non-zero gradient field can be sustained because of the law of conservation of energy. Consider the simple 1D case in Figure 2, where the temperature is linearly increasing over the horizontal axis. For any given point, it gives heat out to its left neighbor with lower temperature and simultaneously receives heat of the same amount from its right neighbor. In this 1D case, the loss and gain of heat reach a balance when the temperature field is linear. As we are going to see later, if we lift the restriction of energy conservation, the condition for equilibrium may not hold, and we need to rewrite the heat equation under new propositions.
Figure 2.

Conserving and non-conserving energy transmissions. A: the initial state has a linear gradient. We are interested in the energy change of the center piece. B: Energy is transferred from high to low (gradient direction), as indicated by the arrows. C: Result of typical conserving transmission. The center piece receives and gives the same amount of energy, which maintains a solenoidal gradient field. D: Result of dilation-like transmission, which is not energy conserving. The center piece gains energy and a solenoidal gradient field cannot be sustained.
The generalized diffusion equation is anisotropic. Specifically, we are interested in the anisotropic diffusion equation proposed by Perona and Malik [19], which has been extensively studied in image processing.
| (2) |
In Equation 2, the constant c in the heat equation is replaced by a function g(), which is commonly calculated in order to stop diffusion at high gradient magnitude of u.
3.2 Morphological Operators and Morphological Gradients
In mathematical morphology, erosion and dilation are the fundamental morphological operators. The erosion of an image I by a structuring element B is:
| (3) |
And the dilation of an image I by a structuring element B is:
| (4) |
For a flat structuring element B, they are equivalent to filtering the image with minimum and maximum filters (rank filters of rank 1 and N, where N is the total number of pixels in B) respectively.
In differential morphology, erosion and dilation are used to define morphological gradients, including Beucher gradient, internal and external gradients, etc. Detailed discussions can be found in [20] and [25]. In this paper, we are interested in the external gradient with a flat structuring element, since for confocal data we always want to extract structures with high scalar values and the region-growing process of high scalar values resembles dilation. Thus the morphological gradient used in this paper is:
| (5) |
Please note that for a multi-variable function I, Equation 5 is essentially a discretization scheme for calculating the gradient magnitude of I at position x.
3.3 Morphological Diffusion
If we consider the morphological dilation defined in Equation 4 as energy transmission, it is interesting to notice that energy is not conserved. In Figure 2, we show that within a neighborhood of a given position, the local maximum can give out energy without losing its own. Thus, for a closed surface within the whole region, the net energy flux can be non-negative. In other words, under the above assumption of non-conserving energy transmission, the solenoidal gradient condition (Section 3.1) for the equilibrium of heat diffusion no longer holds. Therefore, the heat diffusion can only reach its equilibrium when the energy field has zero gradient.
Based on the above reasoning, we can rewrite the heat equation (Equation 1) to its form under the dilation-like energy transmission:
| (6) |
Equation 6 can be simply derived from Fourier's law of heat conduction [4], which states that heat flux is proportional to negative temperature gradient. However we feel our derivation can better reveal the relationship between heat diffusion and morphological dilation. To solve this equation, we use forward Euler through time and the morphological gradient in Equation 5. Notice that the time step Δt can be specified with c for simplicity when the discretization of time is uniform. Then the discretization of Equation 6 becomes:
| (7) |
When c = 1, the trivial solution of Equation 6 becomes the successive dilation of the initial heat field, which is exactly what we expected.
Thus, we have established the relationship between morphological dilation and heat diffusion from the perspective of energy transmission. We name Equation 7 morphological diffusion, which can be seen as one type of heat diffusion process under non-conserving energy transmission. Though a similar term has been used in the work of Segall and Acton [23], we use morphological operators for the actual diffusion process rather than calculating the stopping function of anisotropic diffusion. Our purpose of using the result for interactive volume segmentation rather than simulating physical processes legitimizes the lifting of the requirement for conservation. We are interested in the anisotropic version of Equation 7, which is obtained simply by replacing the constant c with a stopping function g(x):
| (8) |
In Equation 8, when the stopping function g(x) is in [0,1], the iterative results are bounded and monotonically increasing, which lead to a stable solution. By using morphological dilation (i.e. maximum filtering), morphological diffusion has several advantages when applied to confocal data and implemented with graphics hardware. Morphological dilation's kernel is composed of only comparisons and has the least computational overhead. The diffusion process only evaluates at non local maxima, which are forced to reach their stable states with fewer iterations. This unilateral influence (vs. bilateral of a typical anisotropic diffusion) of high intensity signals upon lower ones may not be desired for all situations. However, for confocal data, whose signal results from fluorescent staining and laser excitation, high intensity signals usually represent important structures, which can then be extracted with a faster speed. As shown in Section 5, when coupled with our user interactions, morphological diffusion is able to extract desired neural structures from typical confocal data with interactive speed on common PCs.
4 User Interactions for Interactive Volume Segmentation
Paint selection [14], [12] with brush strokes is considered one of the most useful methods for 2D digital content authoring and editing. Incorporated with segmentation techniques, such as level set and anisotropic diffusion, it becomes more powerful yet still intuitive to use. For most volumetric data, this method becomes difficult to use directly on the renderings, due to occlusion and the complexity of determining the depth of the selection strokes. Therefore many volume segmentation tools’ user interactions are limited to 2D slices. Taking advantage that the confocal channels usually have sparsely distributed structures, direct paint selection on the render viewport is actually very feasible, though selection mistakes caused by occlusion cannot be completely avoided. Using the result from Section 3, we developed interaction techniques that generate accurate segmentations of neural structures from confocal data. These techniques share similarities with the sketch-based volume selection methods described in previous literatures [32], [5], [18], [1]. However, the algorithm presented in Section 3 allows us to use paint strokes with varying sizes, instead of thin strokes in previous work. We design them specifically for confocal data and emphasize accuracy for neural structure extraction.
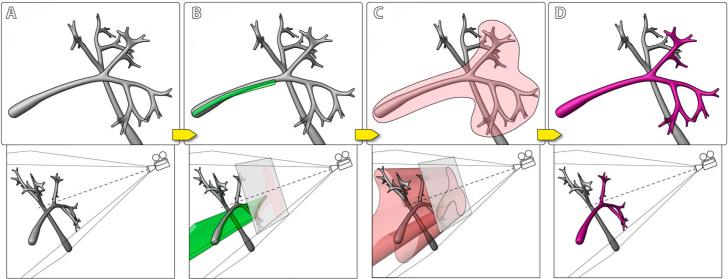
Figure 3 illustrates the basic process of extracting a neural structure from confocal volume with our method. First, a scalar mask volume is generated. Then user defines seed regions by painting on the render viewport. The pixels of the defined region are then projected into 3D as a set of cones (cylinders if the viewport is orthographic) from the camera's viewpoint. Voxels within the union of these cones are thresholded to generate seeds in the mask volume, where seeds have the maximum scalar value, and other voxels have zero value. Then a wider region, which delimits the extent of subsequent diffusion, is defined by painting again on the viewport. The second region is projected into the volume similarly. Then in the mask volume, the selected seeds propagate by iteratively evaluating Equation 8. Structures connected to those registered by the seeds are then selected in the mask volume. The resulting mask volume is not binary, though the structural boundaries can be more definitive by adjusting the stopping function, which is subsequently discussed. After each stroke, the mask volume is instantly applied to the original volume, and the selected structures are visualized with a different color against the original data. User can repeat this process for complex structures, since the calculation only modifies the mask volume and leaves the original data intact.
Figure 3.
Volume paint selection of neural structures from a confocal volume. A: The visualization of certain neural structures (top) and the camera setup (bottom). B: A user paints on the viewport. The stroke (green) is projected back into the volume to define the seed generation region. C: The user paints on the viewport to define the diffusion region. The stroke (red) is projected similarly and the seeds generated in B grow to either the structural boundaries or the boundary defined by the red stroke. D: The intended neural structure is extracted.
We use gradient magnitude (|ΔV V|) as well as scalar value (V) of the original volume to calculate the stopping function in Equation 8, since, for confocal data, important structures are stained by fluorescent dyes, and they should have high scalar values:
| (9) |
The graphs of the two parts of the stopping function are in Figure 4. t1 and t2 translate the fallo s of g1() and g2(), and the fallo steepness is controlled by k1 and k2. The combined e ect of g1() and g2() is that the seed growing stops at high gradient magnitude values and low intensities, which are considered borders for neural structures in confocal data.
Figure 4.
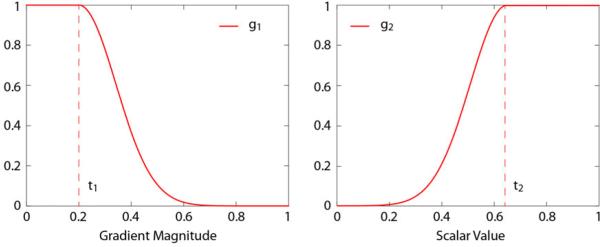
The two parts of the stopping function. g1() is for stopping the growth at high gradient magnitude values and g2() is for stopping at low scalar intensities. The final stopping function is the product of g1() and g2().
By limiting the seed growth region with brush strokes, users have the flexibility of selecting the desired structure from the most convenient angle of view. Furthermore, it also limits the region for diffusion calculations and ensures real-time interactions. For less complex neural structures, seed generation and growth region definition can be combined into one brush stroke; for over-segmented or mistakenly selected structures, an eraser can subtract the unwanted parts. We designed three brush types for both simplicity and flexibility. Neurobiologists can use these brushes to extract different neural structures from confocal data.
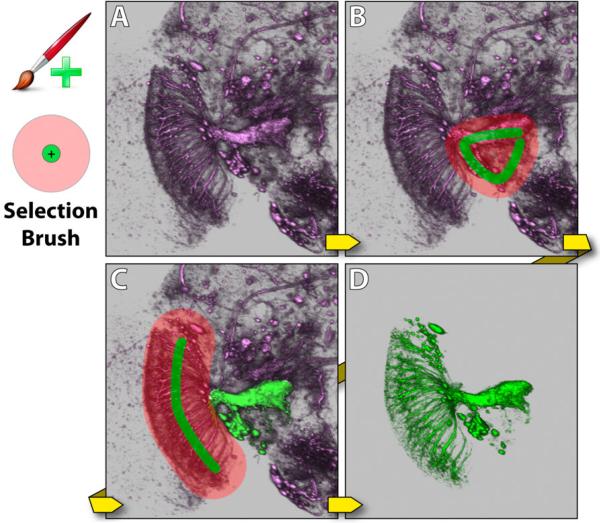
Selection brush combines the definition of seed and diffusion regions in one operation. As shown in Figure 5, it has two concentric circles in the brush stamp shape. Strokes created by the inside circle are used for seed generation, and those created by the outside circle are for diffusion region definition. Usually the diameter of the inside circle is set slightly smaller than the root of a structure. The diameter of the outside circle is determined by how the sub-structures branch out from the root structure. By combining the two operations, it makes interaction easier. For example, to extract an axon and its terminal branches, the inside circle is set roughly to the size of the axon, and the outside circle is set to that can enclose the terminals. Morphological diffusion is calculated on finishing each stroke, which appends newly selected structures to existing selections. Since users can easily rotate the view while painting, it is helpful to use this tool and select multiple structures or different parts of one complex structure from the most convenient observing directions. Figure 5 demonstrates using the selection brush to extract a visual projection neuron of a Drosophila brain.
Figure 5.
Selection brush. The dataset contains neurons of a Drosophila adult brain. A: The original dataset has a neuron that a user wants to extract, which is visual projection neuron LC14 [16]. B: A stroke is painted with the selection brush. C: A second stroke is painted, which covers the remaining part of the neuron. D: The neuron is extracted.
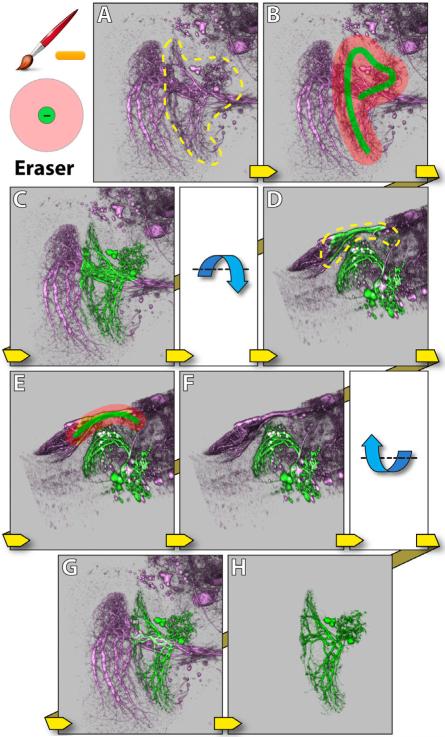
Eraser behaves similarly to the selection brush, except that it first uses morphological diffusion to select structures, and then subtracts the selection from previous results. The eraser is an intuitive solution to issues caused by occluding structures: mistakenly selected structures because of obstruction in 2D renderings can usually be erased from a different angle of view. Figure 6 demonstrates such a situation where one neuron obstructs another in the rendering result. The eraser is used to remove the mistakenly selected structures.
Figure 6.
Eraser. The dataset contains neurons of a Drosophila adult brain. A: The yellow dotted region indicates the structure that a user wants to extract (visual projection neuron LT1 [16]). From the observing direction, the structure obstructs another neuron behind (visual projection neuron VS [16]). B: A stroke is painted with the selection brush. C: LT1 is extracted, but VS is partially selected. D: The view is rotated around the lateral axis. The yellow dotted region indicates extra structures to be removed. E: A stroke is painted with the eraser. F: The extra structures are removed. G: The view is rotated back. H: A visualization of the extracted neuron (LT1).
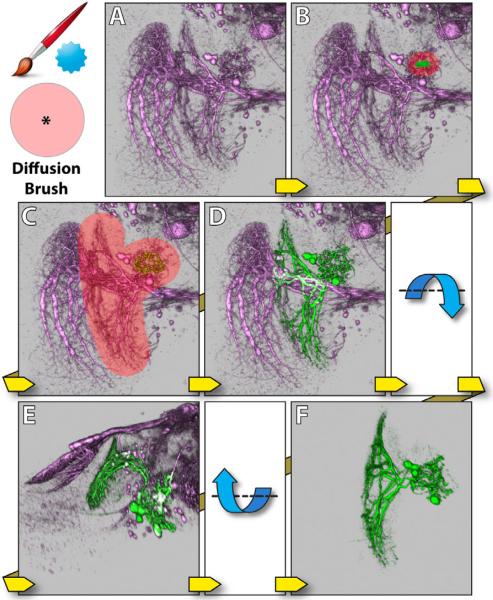
Diffusion brush only defines diffusion region. It generates no new seeds and only diffuses existing selections within the region defined by its strokes. Thus it has to be used after the selection brush. With the combination of the selection brush and the diffusion brush, occluded or occluding neural structures can be extracted easily, even without changing viewing angles. Figure 7 shows the same example as in Figure 6. First, the selection brush is used to extract only the non-obstructing part of the neuron. Then the remaining of the neuron is appended to the selection by painting with the diffusion brush. Since the obstructing part is not connected to the neuron behind, and the diffusion brush does not generate new seeds in that region, the neuron behind is not selected.
Figure 7.
Diffusion brush. The dataset contains neurons of a Drosophila adult brain. A: The original dataset is the same as in Figure 6. B: A stroke is painted with the selection brush on the non-obstructing part of LT1. C: Part of LT1 is selected. Then the diffusion brush is used to select the remaining of LT1. D: LT1 is selected, without selecting the obstructed neuron (visual projection neuron VS). E: The view is rotated around the lateral axis, to confirm the result. F: A visualization of neuron LT1 after extraction.
As seen in the above examples, our interactive segmentation scheme allows inaccurate user inputs within fairly good tolerance. However, using a mouse to conduct painting work is not only imprecise but also causes fatigue. We support the latest digital tablets in our tool for dexterity enhancement. The active tablet area is automatically mapped to the render viewport. Thus, all the available area on the tablet is used in order to maximize the precision, and the user can better estimate the location of the strokes even when the stylus is hovering above the active area of the tablet. Furthermore, stylus pressure is utilized to control the brush size. Though the pressure sensitive brushes are a feature that can be turned o by users, our collaborating neurobiologists like the flexibility of changing the brush sizes on the fly. It helps to extract neural structures of varying sizes more precisely (Figure 8).
Figure 8.
A digital tablet and its usage. The dataset contains neurons of a zebrafish head. A: The original dataset contains stained tectum lobes and photoreceptors of eyes. Since the tectum lobes and the photoreceptors actually connect, we want to better control the brush size for diffusion at the regions of connection, when only the tectum lobes are to be extracted. B: Two strokes are painted with the selection brush. The stroke size changes as user varies the pressure applied to the tablet's stylus. C: The tectum lobes are selected. D: The tectum lobes are extracted and visualized.
5 Results and Discussion
The interactive volume segmentation functions have been integrated into a confocal visualization tool, FluoRender [31]. The calculations for morphological diffusion use FluoRender's rendering pipelines, which are implemented with OpenGL and GLSL. As shown in the accompanying video, painting interactions are facilitated by keyboard shortcuts, which make most operations fluid.
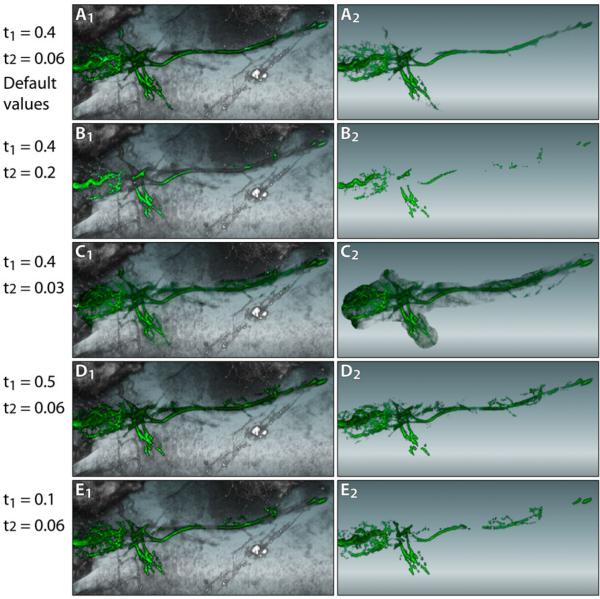
As discussed in Section 4, the stopping function of morphological diffusion has four adjustable parameters: shift and steepness values for scalar and gradient magnitude fallo s. In order to reduce the total number of user-adjustable parameters, we empirically determine and fix the steepness values (k1 and k2 in Equation 9) to 0.02, which can generate satisfactory structural boundary definitions for most of the data that our collaborating neurobiologists are working with. The shift values are controlled by user. Figure 9 compares the results when these parameters are adjusted, as well as results of the default values that we have determined empirically. The default values can usually connect faintly stained fibers however still keep noise data from being selected. Since our segmentation method is real-time, users can tweak the parameters between strokes and deal with over- and under-segmentation problems. The one remaining parameter is the iteration times for morphological diffusion. Common implementations usually test convergence after each iteration, however it slows down the calculation. Therefore we also empirically determine and set iteration times to 30. As discussed in Section 3.3, morphological diffusion requires fewer iterations to reach a stable state. The determined value ensures both satisfactory segmentation results and interactive speed.
Figure 9.
The influence of the stopping function parameters on segmentation results. A User wants to extract the eye muscle motor neurons from a zebrafish head dataset. The left column shows the selected results; the right column shows the extracted results. A: The default values give satisfactory results: completely selected fiber without much noise. B: Shifting the scalar falloff higher to 0.2 can barely select any fiber at its faintly stained regions. C: Decreasing the scalar falloff includes more noise to the selection. D: Increasing the gradient magnitude falloff includes more details. However further increasing the value does not make much difference, since higher gradient magnitude values become scarce in the data. E: Decreasing the gradient magnitude falloff results disconnected fiber.
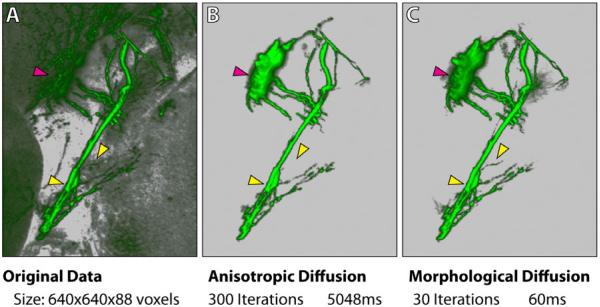
To demonstrate the computational efficiency of our segmentation algorithm, we use the same user interactions however two different methods for region growing: standard anisotropic diffusion as in [24] and morphological diffusion. The comparisons are shown in Figure 10. The iteration numbers of the two methods are determined so that the diffusion processes converge. Our method uses both fewer iterations and less computation time to converge. Therefore, it can be carried out for interactive volume painting selection with negligible latency. Certain fine details of the confocal data shown in Figure 10 are also better extracted, which make the result more appealing to neurobiologist users. However, as discussed in Section 3, our method is based on the assumption that high scalar values are always preferred over lower ones in the volume. For dense volume data with multiple layers of different scalar intensities, our method has the limitation that it may not correctly extract desired structures. One possible extension of our method is combining it with transfer function designs, which can usually generate re-ordered scalar intensities depending on importance for structure extraction. Another direction for future research is to look at other morphological gradients other than the external gradient. For example, we can use the internal gradient if low scalar values are preferred.
Figure 10.
A comparison between standard anisotropic diffusion and morphological diffusion. A user wants to extract the eye muscle motor neurons from a zebrafish head dataset. The same selection brush stroke from this viewing angle is applied for both methods. However, morphological diffusion can extract the result with fewer iterations and less time. All arrowheads point to regions where details are better extracted with our method. The magenta arrowhead indicates part of the eye motor neuron being extracted, which was originally occluded behind the tectum. Timings are measured on a PC with an Intel i7 975 3.33GHz processor, 12GB memory, an AMD Radeon HD4870 graphics card with 1GB graphics memory, and Microsoft Windows 7 64-bit.
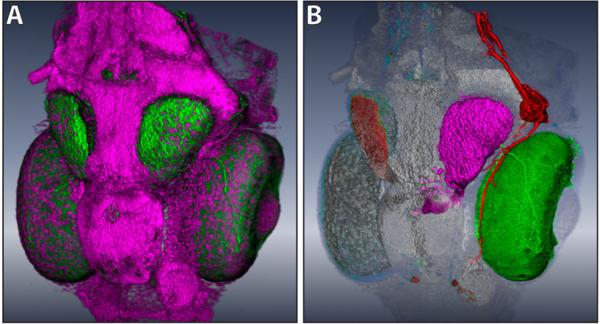
With the easy-to-use segmentation functions available with FluoRender, neurobiologist users can select and separate structures with different colors when they visualize their data. Thus our method can be used for interactive data exploration in addition to transfer function adjustments. Figure 11 shows a result generated with our interactive segmentation method. The zebrafish head dataset has one channel of stained neurons and one of nuclei. The tectum (magenta), the eye motor neuron (red) and the eye (green) are extracted and colored differently, which make their spatial relationships better perceived. The nucleus channel is layered behind the extracted structures and used as a reference for their positions in the head.
Figure 11.
A: A zebrafish dataset originally has two channels: neurons (green) and nuclei (magenta). B: After extracting three different structures (the tectum, the eye motor neuron and the eye are on the same side of the head) from the neuron channel, the spatial relationships are clearly visualized with different colors applied.
6 Conclusion
In this paper, we present interactive techniques for extracting neural structures from confocal volumes. We first derived morphological diffusion from anisotropic diffusion and morphological gradient, and then we used the result to design user interactions for painting and region growing. Since the user interactions work directly on rendering results and are real-time, combined visualization and segmentation are achieved. Using this combination it is now easy and intuitive to extract complex neural structures from confocal data, which are usually difficult to select with 2D-slice-based user interactions. For future work, we would like to improve and complete the segmentation/visualization tool for confocal microscopy data, and make it useful for all neurobiologists working with confocal data. A short list of the improvements for the current system includes recording operation history, undo/redo support, batch segmentation for multiple confocal datasets and channels, segmentation of 4D confocal data sequence, and volume annotation.
Acknowledgements
This publication is based on work supported by Award No. KUS-C1-016-04, made by King Abdullah University of Science and Technology (KAUST), DOE SciDAC:VACET, NSF OCI-0906379, NIH-1R01GM098151-01. We also wish to thank the reviewers for their suggestions, and thank Chems Touati of SCI for making the demo video.
Contributor Information
Yong Wan, SCI Institute and the School of Computing, University of Utah.
Hideo Otsuna, Department of Neurobiology and Anatomy, University of Utah.
Chi-Bin Chien, Department of Neurobiology and Anatomy, University of Utah.
Charles Hansen, SCI Institute and the School of Computing, University of Utah.
References
- 1.Abeysinghe S, Ju T. Interactive skeletonization of intensity volumes. The Visual Computer. 2009;25(5):627–635. [Google Scholar]
- 2.Akers D. Cinch: a cooperatively designed marking interface for 3d pathway selection.. Proceedings of the 19th annual ACM symposium on User interface software and technology.2006. pp. 33–42. [Google Scholar]
- 3.Bürger K, Krüger J, Westermann R. Direct volume editing. IEEE Transactions on Visualization and Computer Graphics. 2008;14(6):1388–1395. doi: 10.1109/TVCG.2008.120. [DOI] [PubMed] [Google Scholar]
- 4.Cannon JR. The One-Dimensional Heat Equation. first edition Addison-Wesley and Cambridge University Press; 1984. [Google Scholar]
- 5.Chen H-LJ, Samavati FF, Sousa MC. Gpu-based point radiation for interactive volume sculpting and segmentation. The Visual Computer. 2008;24(7):689–698. [Google Scholar]
- 6.Gonzalez RC, Woods RE. Digital Image Processing. third edition Prentice Hall; 2008. [Google Scholar]
- 7.Hosssain Z, Möller T. Edge aware anisotropic diffusion for 3d scalar data. IEEE Transactions on Visualization and Computer Graphics. 2010;16(6):1376–1385. doi: 10.1109/TVCG.2010.147. [DOI] [PubMed] [Google Scholar]
- 8.Jeong W-K, Beyer J, Hadwiger M, Vazquez A, Pfister H, Whitaker RT. Scalable and interactive segmentation and visualization of neural processes in em datasets. IEEE Transactions on Visualization and Computer Graphics. 2009;15(6):1505–1514. doi: 10.1109/TVCG.2009.178. [DOI] [PMC free article] [PubMed] [Google Scholar]
- 9.Kniss J, Wang G. Supervised manifold distance segmentation. IEEE Transactions on Visualization and Computer Graphics. 2011;17(11):1637–1649. doi: 10.1109/TVCG.2010.120. [DOI] [PubMed] [Google Scholar]
- 10.Kutulakos K, Seitz S. A theory of shape by space carving.. Computer Vision, 1999. The Proceedings of the Seventh IEEE International Conference on.1999. pp. 307–314. [Google Scholar]
- 11.Lefohn AE, Kniss JM, Hansen CD, Whitaker RT. Interactive deformation and visualization of level set surfaces using graphics hardware. Proceedings of the 14th IEEE Visualization 2003 (VIS’03) 2003:75–82. [Google Scholar]
- 12.Liu J, Sun J, Shum H-Y. Paint selection. ACM Transactions on Graphics. 2009;28(3):69:1–69:7. [Google Scholar]
- 13.Martin WN, Aggarwal JK. Volumetric descriptions of objects from multiple views. IEEE Transactions on Pattern Analysis and Machine Intelligence. 1983;5(2):150–158. doi: 10.1109/tpami.1983.4767367. [DOI] [PubMed] [Google Scholar]
- 14.Olsen DR, Jr., Harris MK. Edge-respecting brushes.. Proceedings of the 21st annual ACM symposium on User interface software and technology.2008. pp. 171–180. [Google Scholar]
- 15.Osher S, Sethian JA. Fronts propagating with curvature-dependent speed: algorithms based on hamilton-jacobi formulations. Journal of Computational Physics. 1988;79(1):12–49. [Google Scholar]
- 16.Otsuna H, Ito K. Systematic analysis of the visual projection neurons of drosophila melanogaster. i. lobula-specific pathways. The journal of comparative neurology. 2006;497(6):928–958. doi: 10.1002/cne.21015. [DOI] [PubMed] [Google Scholar]
- 17.Owada S, Nielsen F, Igarashi T. Volume catcher. Proceedings of the 2005 symposium on Interactive 3D graphics and games.2005. pp. 111–116. [Google Scholar]
- 18.Owada S, Nielsen F, Igarashi T, Haraguchi R, Nakazawa K. Projection plane processing for sketch-based volume segmentation.. Proceedings of the 5th IEEE International Symposium on Biomedical Imaging: From Nano to Macro.May, 2008. pp. 117–120. [Google Scholar]
- 19.Perona P, Malik J. Scale-space and edge detection using anisotropic diffusion. IEEE Transactions on Pattern Analysis and Machine Intelligence. 1990;12(7):629–639. [Google Scholar]
- 20.Rivest J-F, Soille P, Beucher S. Morphological gradients. Journal of Electronic Imaging. 1993;2(4):326–341. [Google Scholar]
- 21.Saad A, Hamarneh G, Möller T. Exploration and visualization of segmentation uncertainty using shape and appearance prior information. IEEE Transactions on Visualization and Computer Graphics. 2010;16(6):1366 –1375. doi: 10.1109/TVCG.2010.152. [DOI] [PubMed] [Google Scholar]
- 22.Saad A, Möller T, Hamarneh G. Probexplorer: Uncertainty-guided exploration and editing of probabilistic medical image segmentation. Computer Graphics Forum. 2010;29(3):1113–1122. [Google Scholar]
- 23.Segall C, Acton S. Morphological anisotropic diffusion. Proceedings of International Conference on Image Processing 1997. 1997 Oct;3:348–351. [Google Scholar]
- 24.Sherbondy A, Houston M, Napel S. Fast volume segmentation with simultaneous visualization using programmable graphics hardware. Proceedings of the 14th IEEE Visualization 2003 (VIS’03) 2003:171–176. [Google Scholar]
- 25.Soille P. Morphological Image Analysis: Principles and Applications. second edition Springer-Verlag; 2002. [Google Scholar]
- 26.Sowell R, Liu L, Ju T, Grimm C, Abraham C, Gokhroo G, Low D. Volume viewer: an interactive tool for fitting surfaces to volume data.. Proceedings of the 6th Eurographics Symposium on Sketch-Based Interfaces and Modeling.2009. pp. 141–148. [Google Scholar]
- 27.Tay TL, Ronneberger O, Ryu S, Nitschke R, Driever W. Comprehensive catecholaminergic projectome analysis reveals single-neuron integration of zebrafish ascending and descending dopaminergic systems. Nature Communications. 2011;2:171. doi: 10.1038/ncomms1171. [DOI] [PMC free article] [PubMed] [Google Scholar]
- 28.Vincent L, Soille P. Watersheds in digital spaces: an efficient algorithm based on immersion simulations. IEEE Transactions on Pattern Analysis and Machine Intelligence. 1991;13(6):583–598. [Google Scholar]
- 29.Viola I, Kanitsar A, Gröller ME. Hardware-based nonlinear filtering and segmentation using high-level shading languages. Proceedings of the 14th IEEE Visualization 2003 (VIS’03) 2003:309–316. [Google Scholar]
- 30.Visage Imaging. Amira. 2011 http://www.amiravis.com.
- 31.Wan Y, Otsuna H, Chien C-B, Hansen C. An interactive visualization tool for multi-channel confocal microscopy data in neurobiology research. IEEE Transactions on Visualization and Computer Graphics. 2009;15(6):1489 – 1496. doi: 10.1109/TVCG.2009.118. [DOI] [PMC free article] [PubMed] [Google Scholar]
- 32.Yuan X, Zhang N, Nguyen MX, Chen B. Volume cutout. The Visual Computer. 2005;21(8):745–754. [Google Scholar]


