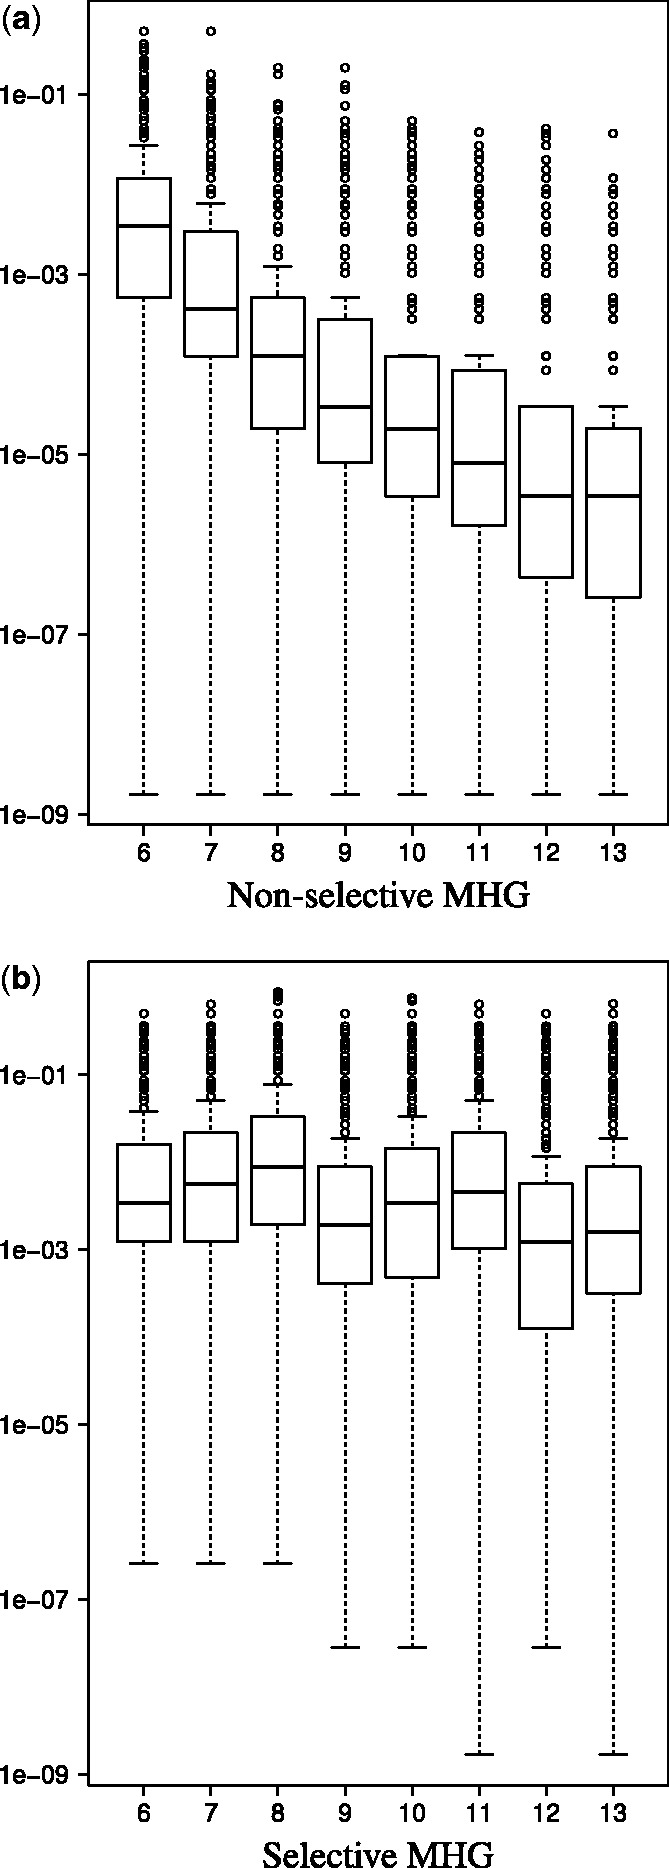
Fig. 1.

Null distribution of motif scores. The figure shows the boxplots constructed from 10 000 observations of non-selective (a) and selective (b) versions of the MHG scores for each motif width (ranged from 6 to 13). The scores were generated by applying MEME to randomly drawn input set of sequences of a fixed dimension (number of sequences and their lengths). See Supplementary Section S1.2 for details
