

Abstract
Artificial Neural Networks (ANNs) are trained using High Throughput Screening (HTS) data to recover active compounds from a large data set. Improved classification performance was obtained on combining predictions made by multiple ANNs. The HTS data, acquired from a Methionine Aminopeptidases Inhibition study, consisted of a library of 43,347 compounds, and the ratio of active to non-active compounds, RA/N, was 0.0321. Back-propagation ANNs were trained and validated using Principal Components derived from the physico-chemical features of the compounds. On selecting the training parameters carefully, an ANN recovers one-third of all active compounds from the validation set with a three-fold gain in RA/N value. Further gains in RA/N values were obtained upon combining the predictions made by a number of ANNs. The generalization property of the back-propagation ANNs was utilized to train those ANNs with the same training samples, after being initialized with different sets of random weights. As a result, only 10% of all available compounds were needed for training and validation, and the rest of the data set was screened with more than a ten-fold gain of the original RA/N value. Thus, ANNs trained with limited HTS data might become useful in recovering active compounds from large data sets.
Keywords: pattern classification, neural networks, generalization property
1. INTRODUCTION
Over the last few decades, the experimental High Throughput Screening (HTS) process has become the first major step toward drug discovery.1 It is essentially an expensive laboratory process that measures chemical and biological activities of a large number of molecules toward one or several target molecules. The compounds that are found active toward a target molecule are further investigated for discovering new drugs. The test set for HTS often consists of a few thousand to several hundred thousand compounds on high-density microplates, and automated robotic instruments are used to run the HTS assays.2 Due to ever increasing costs of laboratory experimentation with such a large number of samples that are mostly found to be non-active toward a target molecule, alternative low-cost computer-assisted approaches are considered desirable. A Support Vector Machine (SVM)-based approach has been used to analyze HTS data of a Methionine Aminopeptidases (MetAPs) Inhibition study.3 This approach described an increased ratio of active to non-active compounds (RA/N) by seven-fold in the classified set. This enhancement in the RA/N value was obtained when more than 10,000 examples, out of approximately 40,000 available samples, were used to train the classifier.
Among other computer-assisted approaches, the Artificial Neural Network (ANN)-based schemes have gained significant momentum.2,4 A back-propagation ANN is well-known for its inherent ability in learning to generalize from a small number of examples per class, and it often provides robust performances when the input data are corrupted with incomplete and/or noisy information.5, 6 It has been noted that the methodologies that can tolerate noisy data might become useful in HTS data mining.3 This valuable information and previous successes of ANNs in classifying targets from their noisy responses have been the primary impetuses for using ANN in classifying active compounds.6,7 This paper investigates the feasibility of training and validating ANNs using relatively small experimental HTS data set, and then recovering active compounds from a large test set.
The HTS data from a Methionine Aminopeptidases (MetAPs) Inhibition study was made available by the HTS Laboratory at the University of Kansas.8 A chemical library of 43,347 chemical compounds was examined by the experimental HTS process, and a normalized sorted data set was obtained in the order of decreasing activities toward Cobalt. Then, 1,347 molecules with inhibition activity greater than or equal to 40% toward Cobalt were selected as active, and the remaining 42,000 compounds were considered as non-active. Thus, for the original data set, the ratio of active to non-active compounds (RA/N) was 0.0321. Each compound of the given data set was characterized by a feature vector of 16 elements corresponding to the 16 physical and chemical properties of that compound. The overall measured inhibition activities toward Cobalt for the compounds were normalized between 0 and 1.
The original data set is first divided into a development set and a test set, and then the development set is further divided into training and validation sets. ANNs are trained using the samples selected randomly from the training set, and then validated using all the members of the validation set. It is important to note that RA/N values, obtained from classifying the validation set, actually provide a measure of the ratio of true positives to false positives. In addition, the RA/N value is found to increase when the predictions made by a large number of trained ANNs are combined. However, this increase is recurrently accompanied by a decrease in the actual number of recovered active compounds. In order to train those large numbers of ANNs without using numerous training samples, the generalization property of a back-propagation ANN is exploited.5
The ANNs that provided superior performances during validation procedure are then applied to analyze the test set. On combining the predictions made by these ANNs, nearly a ten-fold gain is obtained in RA/N values while recovering about one-sixth (or nearly 16%) of all the active compounds from the test set. We also demonstrate that during the training process, an ANN basically learns to provide a gain “G” in the RA/N values from the initial values available in the validation or even the test set. Thus, in order to get an estimate of the G value from the validation process, it is not necessary to collect a large number of samples for the validation set, but the value of RA/N for the validation set needs to be approximately equal to that of the test set. When a total of only 10% of all the available samples are used for training and validation purposes, the rest of the data is classified with over a ten-fold gain in RA/N value while nearly one-fifth (or 20%) of available active compounds are recovered. As a result, the ANNs trained with a limited amount of HTS data are beneficial in providing a parallel and a low-cost solution for predicting active compounds from large industrial data libraries.
2. METHODS
2.1 Understanding the characteristics of the available data
Sixteen different features used to characterize each compound are: Molecular Weight, ClogP, Molar Reactivity, Total Surface Area, Polar Surface, Volume, Polar Volume, Atom Count, Bond Count, Rotatable Counts, Ring Count, Diversity Fingerprint, Atom Pair Paths, H-bond Acceptors, H-Bond Donors and Hydrophobic Centers. For each compound, 16 values are used to define the fingerprint, and one additional number is used to define the inhibition activity. Thus, on combining the active and non-active compounds, 43,347 feature vectors are made available for this investigation. As previously mentioned, the 1,347 feature vectors correspond to the set of active compounds, while the remaining 42,000 feature vectors are considered to be non-active compounds. A 2-D scatter diagram is plotted in Figure 1 using two randomly selected components of the feature vectors from both classes. It shows that the features from both classes vastly overlap in that 2-D space. The scatter plots using different pairs of features also demonstrate similar behavior. Because of the high degree of overlap, if a classifier is not properly trained, the number of false positives may progressively increase as we try to recover more and more active compounds. Thus, the primary objective of this investigation is to train ANNs to successfully learn about the non-linear decision boundaries between the two classes in the multidimensional feature space.
Figure 1.

Scatter plot of two randomly selected components, out of total 16 components, of the normalized feature vectors for the entire data set
2.2 Data partitioning
The computer-assisted HTS process is considered as a two-class pattern classification problem where one class consists of active compounds and the other class contains the non-active compounds. The available data are divided into two parts: the development set and the test set. Since the original set had 1,347 active and 42,000 non-active compounds, the development set yields 674 active and 21,000 non-active compounds, and the test set acquires 673 active and 21,000 non-active compounds. The development set is then divided equally into the training and validation sets, where each set consists of 337 active and 10,500 non-active compounds. The number of samples that will be used for training diverse networks would be different but the trained networks will be validated by all the feature vectors of the validation set.
2.3 ANN Configuration and Feature Selection for Validation
Prior to training any ANN, it is essential to establish the requirements that an ANN needs to satisfy during the validation process. From the drug discovery point of view, identification of active compounds is the principal goal. The higher the ratio of active to non-active compounds in the classified set, the better it is. However, following Figure 1, it is realized that the more active compounds we would want to identify, the more non-active compounds will be misclassified as active compounds. Thus, our initial objective is to identify an optimal combination of network architectures and training features that would classify the validation set with RA/N values higher than 0.0321.
The training and validation of ANNs are conducted interactively and iteratively, while varying the design parameters of the classifier, such as, network architectures, number of samples used for training, convergence criteria, etc. The basic architecture of an ANN used in this investigation is shown in Figure 2. There are 16 fixed neurons or nodes at the input layer and 2 nodes at the output layer. The number of hidden layers is varied between one and three, and the number of nodes in each hidden layer is selected interactively. All the neurons of the network possess a sigmoid input-output activation function. For a feature vector representing an active compound, the desired outputs from the first and second nodes of the output layer are set to (1, 0), and the outputs are set to (0, 1) for non-active compounds. The overall mean squared error (MSE) criterion for convergence is set to be less than or equal to 10−4. These networks operate in the feed-forward mode and are trained with a back-propagation learning algorithm.5
Figure 2.

Graphical representation of a feed-forward Artificial Neural Network with two hidden layers
During the validation process, a feature vector from the validation set is applied to the input layer of a trained ANN, and the outputs from the two neurons of the output layer are computed in the feed-forward manner. If the output from the first node is greater than the output from the second node, the input pattern will be classified as active. Otherwise, the input pattern will be classified as non-active. Basically, a winner take all scheme is used for classification.
Due to the presence of a disproportionate majority of non-active compounds and a high overlap of the features from both classes in the feature space, selecting an appropriate number of training samples has been challenging. When numerous examples from both classes are used to train an ANN, the network encountered difficulty in learning to generalize, and often the network does not converge. On the other hand, training an ANN with just a few examples from both classes may cause the loss of the ability of an ANN to successfully learn about the complex non-linear boundaries between two classes. Therefore, those ANNs cannot provide sufficient improvement in RA/N values during validation.
After selecting the number of training samples to be used from both classes, actual feature vectors are collected randomly from the training set. These training vectors from both classes are treated as one set of vectors with 16 columns for each vector, and each column of that set is normalized independently between 0 and 1. Then, the normalized active and non-active feature vectors are separated into two groups for training an ANN. The maximum and minimum values for each feature that are used to normalize each column of the training vectors are also used to scale the corresponding feature of all the feature vectors of the validation set.
In addition to the use of original normalized features, the Principal Component Analysis (PCA)-based features,9 Discrete Cosine Transform (DCT)-based features,10 and Wavelet Transform-based features11 are extracted from the original data set for training and validating the ANNs. After training the ANNs with these new sets of features, the performances of these networks in classifying the validation set are studied, and the results are compared with those obtained from using the original normalized features. The goal here is to find an optimal combination of a set of features and networks configurations so that higher RA/N values are obtained from classifying the validation set. The compounds of the test set are then screened by that optimal combination.
3. RESULTS
A protracted interactive approach is used to find a set of network architectures and the number of training samples so that a practical classifier can be constructed. A fixed set of 30 nodes for the first hidden layer is utilized and then varying the number of nodes in the second hidden layer from 5 to 20, RA/N values of the order of 0.06 are obtained in several cases. The number of training samples varied from 50 to 200 for the active compounds and from 300 to 600 for the non-active compounds. Some of the results obtained from this part of the investigation are plotted as scattered circles in Figure 3. The maximum value of RA/N is found to be equal to 0.09 while the ANN identifies only 89 active compounds. This implies that about one-forth (26%) of all the active compounds available in the validation set are recovered with less than a three-fold gain in the RA/N value. In a 2-D plot, this result corresponds to a point (89, 0.09) as shown in Figure 3. A straight line is drawn from the location (89, 0.09) to the location (337, 0.0321) which represents characteristics of the validation set. The end points of this line are indicated by ‘*’ marks. Any result on or below this line can be produced by tweaking the training parameters of an ANN. However, results above the line may not be obtained by the chosen combination of the network architecture and training features. It has been shown that an ANN trained with 88 active and 1,912 non-active feature vectors provides a classified set with RA/N=0.1210, and the number of active compounds found in this set was 129.12 Since the test set contained 1,347−88=1,259 active compounds, the network has recovered only one-tenth of all the active compounds while providing a four-fold gain in RA/N. Thus, the use of a large number of training samples might not be optimal in recovering a high portion of the active compounds.
Figure 3.
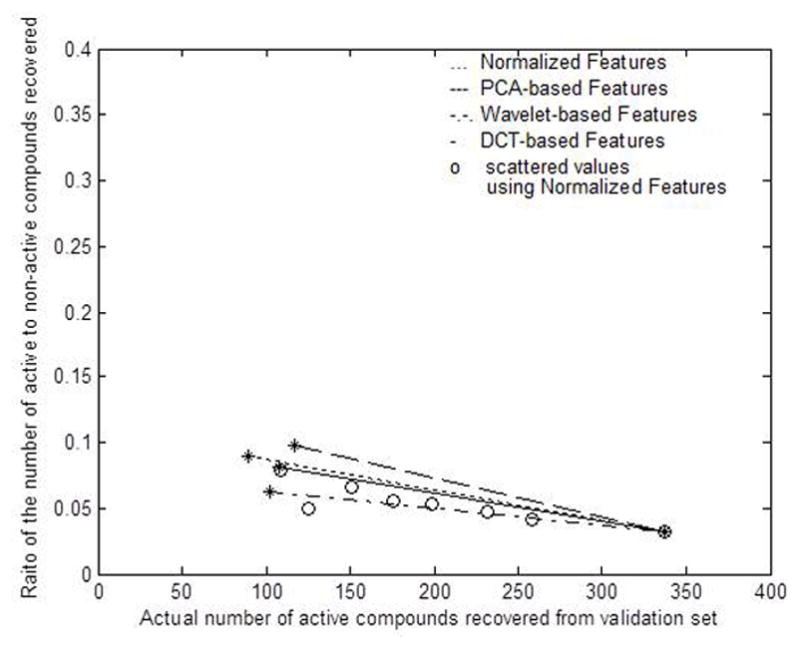
Classification performances obtained from using four different types of features
3.1 Classifier validation using different types of features
PCA, DCT, and Wavelet-based features are extracted from the original set to improve classification performance. For both PCA and DCT-based transforms of the original feature vector, a new feature vector of 16 elements is computed for all the 43,347 compounds. For wavelet-based transforms also 43,347 feature vectors are obtained, but with only 9 wavelet coefficients per vector after the Discrete Wavelet Transform.13 So, the input layer of the ANN consisted of 9 nodes instead of 16 when the wavelet-based features were used for training and validation. While maintaining the architectural framework of the ANNs, the aforementioned training and validation processes are repeated with each of the three new sets of feature vectors.
We have shown that an ANN can recover about one-half of the available active compounds with nearly a two-fold gain in RA/N values. However, it recovers less than one-forth (89) of the available active compounds while the gain in RA/N value is slightly greater than three folds. So, we determine that a useful network should provide at least a three-fold gain in the value of RA/N while recovering at least one-third of all the available active compounds from the validation set. Thus, classifications results around ((337/3), 3 × 0.0321) or (112, 0.0963) are considered desirable. For each type of feature used to train and validate the ANNs, a line is drawn from the location (337, 0.0321) to the location that comes closest to the aforementioned desirable results. The end points of each line are depicted by ‘*’ marks. The networks trained with PCA-based features have provided superior performance over the others by extracting 177 active compounds with RA/N=0.0971, as shown in Figure 3. The best results provided by the Wavelet and DCT-based features are (102, 0.0631) and (107, 0.0814). Due to its superior performance, the PCA-based features are used for the rest of the investigation. In addition, all the 16 principal components are used for training, validation, and testing since the performance of the classifier deteriorates gradually as fewer and fewer principal components are used.
3.2 Classifier training and validation using PCA-based features
A large number of networks are trained and validated using PCA-based features. The training parameters are slowly varied from the configuration that previously provided the result (117, 0.0971). Different configurations of the trained networks and the corresponding classification results are summarized in Table I, and the tabulated data shows that the maximum value of RA/N found during validation is 0.0996 while 125 active compounds are recovered. When the number of active compounds recovered reaches around 200, the RA/N value decreases close to 0.06. The root cause for this problem is the considerable overlap of the features from both classes in the feature space. On the other hand, since the number of active compounds available is relatively small, there might be more common active compounds classified by the two different ANNs than the non-active compounds. Therefore, in the next section, predictions made by multiple ANNs are combined and the performance of this combination process is studied.
Table I.
Classifier Validation Using PCA-based features
| No. of Hidden Nodes used by the ANNs (First layer, Second layer) | No. of Training Samples Used (Active, Non-active) | Total No. of Compounds Classified as Active Compound (NT) | Actual No. of Active Compounds Found in the Classified Set (NA) | Actual No. of Non-active Compounds Found in the Classified Set (NN) | Ratio of the Actual No. of Active and Non-active Compounds Identified (RA/N)=NA/NN |
|---|---|---|---|---|---|
| (15,10) | (70, 300) | 3672 | 196 | 3476 | 0.0564 |
| (15,20) | (70, 370) | 4242 | 212 | 4030 | 0.0526 |
| (15,20) | (60, 300) | 1706 | 129 | 1577 | 0.0818 |
| (24,10) | (60, 390) | 1407 | 117 | 1205 | 0.0971 |
| (24,10) | (60,393) | 1380 | 125 | 1255 | 0.0996 |
| (24,10) | (60,395) | 1391 | 85 | 1306 | 0.0651 |
| (25,0) | (50, 100) | 4194 | 221 | 3973 | 0.0556 |
| (25,0) | (50, 200) | 623 | 53 | 570 | 0.0930 |
| (25,0) | (50, 300) | 1614 | 107 | 1507 | 0.0710 |
| (25,10) | (100, 600) | 1503 | 117 | 1385 | 0.0845 |
| (30,10) | (50, 200) | 2277 | 132 | 2145 | 0.0615 |
3.3 Validation by combining outputs from multiple networks
Thus far, one ANN at a time has been used to classify the validation set, with limited success. We anticipate that during the training process, a single ANN learns some aspects of the shape of the boundary between two classes at a certain location of the feature space. As a result, it only succeeds to extract some active compounds, while misclassifying a large number of non-active compounds. Next, we train several ANNs with different sets of initial conditions so that these ANNs could learn about the boundaries between the two classes at different locations of the feature space. During validation, we expect that there will be more active compounds in common between the predictions made by two different ANNs, since there are fewer active compounds available than the non-active compounds. Combining the predictions made by different ANNs the changes in the classification performance are investigated.
Table I shows that an ANN consisting of 24 nodes in the first hidden layer and 10 nodes in the second hidden layer, trained with 60 and 393 examples from active and non-active compounds respectively, provided comparatively superior performance during validation. Subsequently, several networks with identical architectural design are constructed. In order to minimize the number of samples needed to train these ANNs, we have utilized the generalization property of the back-propagation ANNs5. Consequently, different ANNs with the identical design, trained with the same examples after being initialized with different sets of randomized weights, would behave differently during the validation process. This property arises mainly because the converged weights are located at dissimilar positions of the multidimensional weight space for different networks, even with equivalent training examples. As a result, those different ANNs would provide similar output for the training vectors, but different outputs for other feature vectors not used during training process.
After several ANNs of identical architecture are trained with the same 60 of active and 393 of non-active compounds, all these ANNs are used to classify the validation set. From this set of large number of ANNs, the first ten networks that individually satisfy the criterion of a useful classifier are then selected to improve the overall performance of the classification process. The number of times a compound is predicted as active by these ten networks is computed, and then a threshold number nth is used for classifying that compound. For example, if the compound number Nc has been identified as active compound by P different networks, then the compound number Nc will be classified as active if P≥nth; otherwise, the compound number Nc will be considered as non-active. Using this approach, the classification results are computed for different values of nth. The outcome is presented in the left half of Table II. This result shows that the procedure succeeds in classifying 139 active compounds for nth=3 and RA/N=0.1531. Thus, nearly a five-fold gain in RA/N value is obtained, while recovering more than one-third of all active compounds in the validation set. The gains in RA/N values are plotted in Figure 4 as a function of the number of recovered active compounds. It can be seen that the value of RA/N becomes fourteen-fold higher as compared to its original value when 63 active compounds are correctly classified. Higher RA/N values can be obtained as higher threshold values are used for combining outputs from these networks. In addition, the trend of recovering fewer active compounds with higher gains is also illustrated.
Table II.
Results after combining outputs from ten high performance ANNs
| Threshold Used for Acceptance as an Active Compound (nth) | For Validation | For Testing | ||||
|---|---|---|---|---|---|---|
| Actual No. of Active Compounds Found (NA) | Actual No. of Non-active Compounds Found (NN) | RA/N =NA/NN | Actual No. of Active Compounds Found (NA) | Actual No. of Non-active Compounds Found (NN) | RA/N =NA/NN | |
| 1 | 198 | 2338 | 0.0847 | 379 | 4737 | 0.0800 |
| 2 | 161 | 1463 | 0.1100 | 303 | 3056 | 0.0991 |
| 3 | 139 | 908 | 0.1531 | 252 | 1938 | 0.1300 |
| 4 | 109 | 537 | 0.2030 | 199 | 1165 | 0.1708 |
| 5 | 84 | 308 | 0.2727 | 148 | 617 | 0.2399 |
| 6 | 63 | 149 | 0.4228 | 104 | 287 | 0.3624 |
| 7 | 38 | 79 | 0.4810 | 47 | 107 | 0.4393 |
| 8 | 19 | 35 | 0.5429 | 17 | 30 | 0.5667 |
| 9 | 3 | 5 | 0.6000 | 0 | 0 | - |
| 10 | 0 | 0 | - | 0 | 0 | - |
Figure 4.

Gain in the ratio of active to non-active compounds achieved on combining predictions from multiple ANNs
3.4 Screening of the test set
Ten networks that provided comparatively superior performance during the validation process are used to screen the 673 active and 21,000 non-active compounds of the test set. The results obtained from combining the outputs of these networks are also presented Table II as a function of the threshold. This outcome shows that the procedure succeeds in classifying 252 active compounds for nth=3, while providing RA/N=0.13. This RA/N value is about four-fold higher than the value in the test set. The gain in RA/N values are plotted in Figure 4 as a function of the number of active compounds recovered from the test set. It can be seen from Figure 4 that the gain in RA/N values becomes ten-fold when 104 active compounds are correctly classified, and nearly seventeen-fold gain is obtained when 17 active compounds are correctly classified.
This approach combined the results from several useful classifiers to enhance or boost the performance of the overall classification process. However, this procedure differs from the popular “boosting” algorithm/procedure14 used in data mining publications. In that boosting algorithm, the training set of the ith classifier is selected following the performances of the previous (i−1) classifiers. The goal is to enable each new classifier predict those examples better that are poorly classified by the previous classifiers. In our approach, the individual classifiers are trained independent of each other where each classifier satisfies the basic criterion of a useful classifier.
4. DISCUSSIONS
Thus far, we have used about half of all the available samples (21,674 out of 43,347 samples) to train and validate the ANNs. The remaining half that consists of 21,673 compounds have been screened by ten selected high-performance networks. That set of ten ANNs can now be employed to classify a very large industrial library of chemicals. It is also worthwhile to investigate the possibility of training and validating ANNs with fewer samples than what we have used, and the rationale is described below.
4.1 Possible reduction in the size of the training and validation sets
We demonstrate that an individual ANN can be designed and trained with only 60 examples of active and 393 non-active compounds to improve the ratio of RA/N in the classified set by three folds from the original data set. Furthermore, it takes several hours to train ANNs with more than a total of 1,000 examples. Even if a network converges with large number of training samples, its classification performance is not that useful. In addition, when the ratio of the non-active to active compounds increases beyond ten during training procedure -- the value of RA/N becomes less than 0.06 during validation. Thus, we conclude that a maximum of randomly selected 100 active and 1,000 non-active samples should be adequate for the training set. We could subsequently select 60 active and 393 non-active compounds from this training set. So, we construct a new training set using a total of only 1,100 samples. In order to determine an acceptable size for the validation set, the following procedure has been used.
After training many different configurations of back-propagations ANNs, we have observed that each ANN learns something very basic through the training process. It actually learns to classify an untrained data set by making an “F-fold” improvement in the RA/N value, and almost inverse relationship exists on the number of active compounds recovered by that ANN. For example, if an ANN improves the value of RA/N value by three folds from classifying an untrained set of data, almost one-third of all active compounds will then be recovered from that set. This observation is illustrated in Table II. So, in order to estimate the gain in RA/N that a trained ANN would provide during testing, it is not necessary to analyze and classify a large validation set, but the ratio of the active to non-active compounds in the validation set should be kept very similar to that of the test set. Thus, a validation set is constructed with 100 active and 3,000 non-active compounds.
An ANN possessing 24 nodes in the first hidden layer and 10 nodes in the second hidden layer, as before, is trained with 60 active and 393 non-active compounds collected from the new training set of 1100 compounds. After training, the ANN is used to analyze the validation set that consists of 100 active and 3000 non-active compounds, and the ANN recovers 31 active compounds with an RA/N value equal to 0.0940. This results a three-fold gain in RA/N value, while about one-third of the active compounds are recovered from the validation set. Ten identically designed ANNs are then trained using same training samples, and the predictions made by these ANNs in analyzing the validation set are combined using a threshold value as discussed before. The results are presented in the left half of Table III where we utilized a total of 200 active and 4000 non-active compounds by combining together training and validation sets. The remaining data set of 1,137 active and 38,000 non-active compounds are then tested with those ten ANNs. The results obtained on combining the outcomes from the ten ANNs are presented in the right half of Table III. Furthermore, the results obtained from analyzing this large test set of 1,137+38,000=39,137 compounds, and that obtained from the previously classified test set with 673+21,000=21,673 samples are plotted in Figure 5. It is shown that a smaller training and validation sets allow larger pool of test data to be analyzed, and more active samples are recovered at gains lower than six in RA/N values. However, similar numbers of active compounds are recovered from both the test sets at any gain greater than six. Thus, the use of only 4,200 samples for the combined training and validation sets should be adequate to construct ANNs that would meaningfully improve the values of RA/N from classifying the test set.
Table III.
Results from Using Limited Number of Compounds for Training and Validation
| Threshold Used for Acceptance as an Active Compound (nth) | For Validation (100 Active and 3000 Non-active Compounds) | For Testing (1147 Active and 38000 Non-active Compounds) | ||||
|---|---|---|---|---|---|---|
| Actual No. of Active Compounds Found (NA) | Actual No. of Non-active Compounds Found (NN) | RA/N =NA/NN | Actual No. of Active Compounds Found (NA) | Actual No. of Non-active Compounds Found (NN) | RA/N =NA/NN | |
| 1 | 46 | 575 | 0.0800 | 587 | 6809 | 0.0862 |
| 2 | 38 | 317 | 0.1198 | 447 | 3966 | 0.1127 |
| 3 | 32 | 162 | 0.1975 | 336 | 2283 | 0.1471 |
| 4 | 26 | 81 | 0.3209 | 229 | 1236 | 0.1853 |
| 5 | 15 | 33 | 0.4545 | 144 | 610 | 0.2360 |
| 6 | 4 | 6 | 0.6667 | 75 | 208 | 0.3605 |
| 7 | 0 | 0 | - | 13 | 24 | 0.5416 |
| 8 | 0 | 0 | - | 1 | 1 | 1.0000 |
| 9 | 0 | 0 | - | 0 | 0 | - |
| 10 | 0 | 0 | - | 0 | 0 | - |
Figure 5.
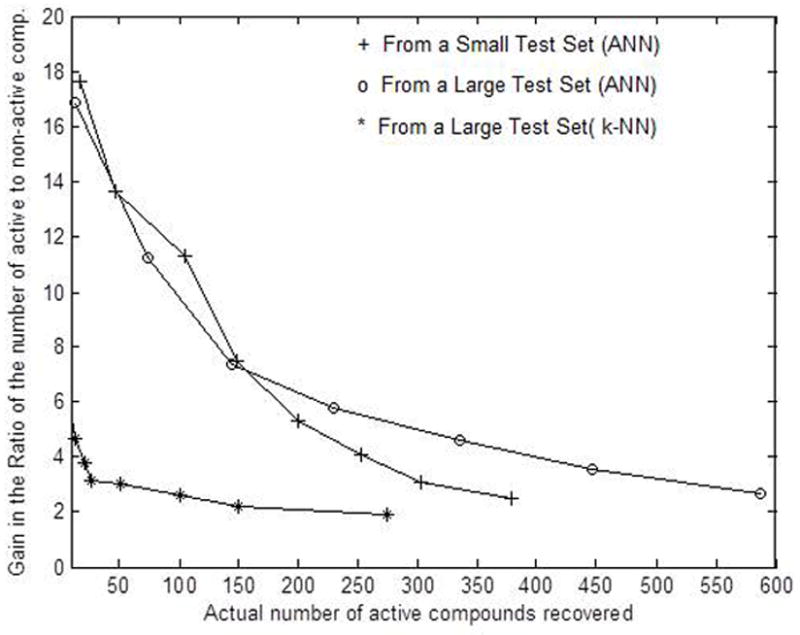
Gain in the ratio of active to non-active compounds achieved from analyzing small and large test sets
4.2 Comparison with statistical k-NN–based classification scheme
A straight forward non-parametric k-Nearest Neighbor (k-NN) based classification algorithm is also used to classify the large aforementioned test set.10,11 The same 60 examples from the active class and 393 examples from the non-active class that were used to train the ANNs are selected to form the training set for the k-NN-based classification scheme. Thus, a total of 60+393=453 training samples are used to screen the large test set that consists of 39137 compounds. For a given test vector, the k-NN algorithm computes the Euclidean distances of the test vector with all the training vectors from both classes and generates a list of distances in the ascending order. The algorithm then takes the lowest “k” distances from the set, and finds the class for each of those “k” training vectors. The input test vector is assigned to that class “i” that appears more frequently in the list of k minimum distances. We used i=1 and 2 to represent active and non-active classes, respectively. In this investigation, the value “k” is varied from 11 to 51 in steps of 4, and the gain in RA/N values are also plotted in Figure 5 as a function of number of active compounds recovered. In this case, higher gains in RA/N values are obtained for higher values of k. It can be seen form Figure 5 that the ANN-based classification scheme has clearly provided better performance over the k-NN-based algorithm. Improved performance is expected from the k-NN-based approach if more training samples are used in the training set. However, the focus of this investigation has been the comparison of the performances of these two methods using identical training samples.
5. CONCLUDING REMARKS
The HTS data was subjugated by the non-active compounds. The initial ratio of the active to non-active compounds (RA/N) was 0.0321, and the actual numbers of active and non-active compounds were 1,347 and 42,000, respectively. In addition, the feature vectors of the compounds from both classes exceedingly overlapped in the 16-dimensional feature space. The challenge was to develop an ANN-based design that would provide the RA/N value considerably higher than 0.0321, while correctly identifying a large number of active compounds.
Initially, the given data set was divided into training, validation, and test sets. Both the training and validation sets contained 337 active and 10,500 non-active compounds, while the test set contained 673 active and 21,000 non-active compounds. Among the original, PCA, DCT, and Wavelet-based features, the PCA-based features provided the best classification performance. When a single ANN was trained with the PCA-based features, it provided a three-fold gain in the RA/N value, while recovering about one-third of all the active compounds available for the validation set. The overall classification performance for the validation set was substantially improved on combining the predictions made by ten different networks where each ANN provided about three-fold gain in RA/N values. The generalization property of the ANNs was exploited when all those ten ANNs were trained with same training examples after being initialized with diverse sets of random weights. As a result, we used a total of only 60+393=453 samples for training all the ANNs which is about 1% of the available samples. These ten networks were also used to classify the test set. As expected, combining the outputs from these networks resulted in approximately a ten-fold gain in RA/N value while recovering 104 or about one-sixth of all active compounds available for testing. The number of active compounds extracted from the test set decreased as higher RA/N values were obtained. This fact could become particularly useful if our intention is to collect a limited number of active compounds with high precision. For example, Table II showed that we could extract 47 active compounds with the value RA/N equal to 0.4393, which is about a fourteen-fold improvement.
The back-propagation ANNs ability to learn and classify features from multiple classes, using a limited number of training examples, has enabled us to develop a training set with only 1100 examples. We also empirically established the fact that once an ANN was trained, it basically learned to classify an untrained set by F-fold improvement in the RA/N value, while recovering a fraction 1/F of the available active compounds. As a result, we could use a smaller validation set maintaining the original ratio of RA/N. We selected 100 examples of active and 3,000 of non-active compounds to create the validation set. Total of 1,100+3,100=4,200 samples for training and validating the ANNs were utilized, while the remaining 1,137 examples of active and 38,000 of non-active compounds formed a new test set of 39,137 samples. Two important facts were revealed from the comparative analysis of this large test set and previous test sets. First, considerable improvement was obtained in recovering the number of active compounds from the larger test set at small gains in RA/N values. Then, at higher gains in RA/N values, the number of active compounds recovered became almost equal for both test sets. Thus, using only 4,200 samples (or 10%) for the combined training and validation sets similar classification performances were obtained when 21,674 samples (or 50%) of the data were used for the combined training and validation sets.
In addition, since fewer active compounds were successfully identified with higher RA/N values, this procedure could be used to collect a small number of active compounds with high precision from a large library of compounds. Therefore, the ANN-based procedure has a vital potential in providing an efficient and low-cost solution to identify active compounds from large data sets.
Acknowledgments
This work was supported by the K-INBRE Bioinformatics Core, NIH grant number P20 RR016475 and Kansas IDDRC, P30 NICHD HD07526. We thank Dr. Gerald H. Lushington (Molecular Graphics and Modeling Laboratory, The University of Kansas, Lawrence, KS) for providing all the molecular descriptors. We also thank Dr. Qi-Zhuang Ye, former director of HTS Laboratory for his assistance. The ITTC and the EECS Department of the University of Kansas have provided the computing resources.
References
- 1.Armstron JW. A review of high-throughput screening approaches for drug discovery [Online] Retrieved from http://www.combichemistry.com/articles/htsscreening.pdf.
- 2.Wikel James H, Dow Ernst R, Heathman Michael. Interpretative Neural Networks for QSAR [Online] Retrieved from. http://www.netsci.org/Science/Compchem/feature02.html.
- 3.Fang J, Dong Y, Lushington GH, Qi-Zhuang Y, Georg GL. Support Vector Machines in HTS Data Mining: Type I MetAPs Inhibition Study. J Biomol Screen. 2006;11:138–144. doi: 10.1177/1087057105284334. [DOI] [PubMed] [Google Scholar]
- 4.Winkler DA. Neural Networks as Robust Tools in Drug Lead Discovery and Development. Molecular Biotech. 2004;27:139–167. doi: 10.1385/MB:27:2:139. [DOI] [PubMed] [Google Scholar]
- 5.Haykin S. Neural Networks A Comprehensive Foundation. New York: Prentice Hall; 1999. pp. 156–255. [Google Scholar]
- 6.Setiawan E, Chakrabarti S. Robust Classification of Radar Signals Using a Fault-Tolerant Feed-Forward ANN: An Empirical Study. Proceedings of the Artificial Neural Networks in Engineering. 1997;7:817–822. [Google Scholar]
- 7.Dubois M, Bohling S, Chakrabarti S. Comparison of Four Approaches to a Rock Facies Classification Problem. J Computers and Geosciences. 2007;33:599–617. [Google Scholar]
- 8.High Throughput Screening Laboratory at the University of Kansas [ONLINE] Retrieved from http://www.hts.ku.edu.
- 9.Sing-Tze B. Pattern Recognition and Image Processing. New York: Marcel Dekker, Inc; 2002. pp. 57–110. [Google Scholar]
- 10.Theodoridis S. Pattern Recognition. London: Academic Press; 2006. pp. 11–30. [Google Scholar]
- 11.Vijayan L, Chakrabarti S, Petr D, Khan S. Extentions to Multi-fractal Wavelet Model for Synthesizing Network Traffic. Proceedings of the IEEE International conference on Communications. 2002;9:1–5. [CD] [Google Scholar]
- 12.Hebar M, Svojanovsky SR, Lushington GH, Georg G, Smith PG, Chakrabarti S. Artificial Neural Network in High Throughput Screening – Classifying the Activity Toward Cobalt [Poster 619]. Presented at the ninth Conference of “Beyond Genome –The Future of Medicine; San Francisco. June 2005. [Google Scholar]
- 13.MATLAB. Neural Network and Wavelet Toolboxes. [ONLINE] Retrieved from http://www.mathworks.com/
- 14.Schwenk H, Bengio Y. Boosting Neural Networks. Neural Computation. 2000;12:1869–1887. doi: 10.1162/089976600300015178. [DOI] [PubMed] [Google Scholar]