

Abstract
Tight junctions (TJs) are the structural basis for the intestinal epithelium barrier. Increased intestinal permeability caused by variations in TJ proteins may result in bacterial translocation (BT). There is increasing evidence that BT might contribute to the occurrence and development of cancer cachexia, but the details are not known. Aims, we undertook further investigations into the pathway of BT in cancer cachexia. Results: BT-positive patients had a higher level of claudins-2 (CL-2, P=0.035) and a lower level of occludin (P=0.038) and Zonula occluden-1 (P=0.01) than BT-negative patients. Moreover, the levels of IL-6, TNF-α, and IFN-γ in BT-positive cachexia patients were higher compared with BT-negative cachexia patients (P<0.001, P=0.01, P<0.001) and BT-positive noncachexia patients (P<0.001, P=0.025, P<0.001). In the BT-positive cachexia patients, the local concentration of IL-6, TNF-α, and IFN-γ, in the middle colic vein, was higher than in the peripheral venous (P=0.04, P=0.03, P=0.038). In addition, endotoxin was detected within the small intestinal wall, and the concentration of endotoxin decreased from the mucosal side to the serosal side gradually in BT-positive patients. This study suggests that the altered TJs could be an important gateway of BT in gastric cancer cachexia and local cytokines could play a more important role than systemic cytokines in the process.
Introduction
Cancer cachexia is a multifactorial disease with progressive weight loss and depletion of host reserves of adipose tissue and skeletal muscle. It may be compounded by anorexia, increased expenditure of basal energy, and resistance to conventional nutritional support (Tisdale 2000; Donohoe and others 2011). It correlates with poor response to chemotherapy regardless of tumor mass or the presence of metastases, and at least 20% patients die from it (Pirlich and others 2006). Although the main mechanism of cancer cachexia is not known, studies have shown that bacterial translocation (BT) may contribute to its occurrence and development (Mi and others 2012).
BT can be defined as the passage of indigenous bacteria or their products colonizing the intestine through the intestinal mucosal barrier to the mesenteric lymph nodes and other distant sites (Gencay and others 2008). Impairment of the intestinal barrier function has been proposed to be a major promoter of BT (Gatt and others 2007). The epithelial barrier, which is the base of the intestinal barrier function can be disrupted by a number of cytokines, such as TNF-α and IFN-γ (Sanders 2005). These cytokines can disrupt the structure of tight junctions (TJs) and affect the epithelial barrier independently and synergistically. Alterations in gastrointestinal microflora and deficiencies in host immunity also play important roles in BT (Gatt and others 2007). Interestingly, these cases are often found in cachexia patients (Wiest and Rath 2003; Li and others 2009). Therefore, we undertook further investigations into the link between these factors and cachexia.
TJs, which are a structural basis for the intestinal epithelium barrier, are comprised by 4 types of transmembrane proteins: occludin (OC), claudins (CL), junctional adhesion molecules, and tricellulin. Claudins and OC are the most prominent members among these proteins (Xuexuan and others 2011). Zonula occludens (ZO) proteins are linked with the main transmembrane proteins, and form the claudin–ZO protein interactions that are essential for TJ formation (Findley and Koval 2009). These structural proteins can be reorganized by some inflammatory cytokines (Wang and others 2005).
The aim of the present study was to research the possible pathway of BT in gastric cancer cachexia.
Materials and Methods
Patients
One thousand seven hundred fifty-three consecutive patients with gastric cancer admitted to the Affiliated Hospital of Medical College, Qingdao University and Qingdao Municipal Hospital for surgical treatment from July 2010 until June 2012 were considered. Informed consent was obtained from all patients or their close relatives. The protocol was approved by the Ethics Committee of Qingdao University, which acts to meet the demands in the Helsinki Declaration. Patients were divided into cachectic and noncachectic according to severity of weight loss and C-reactive protein (CRP) levels. Patients were considered to be cachectic if they had weight loss >10% of their preillness stable weight within 6 months and serum CRP>10 mg/L. To obtain tissue samples of ileocecal junction, patients were confirmed to have a stomach adenocarcinoma with involvement of transverse mesocolon and to be suitable to undergo right hemicolectomy besides radical gastrectomy. Exclusion criteria were the following: (1) anorexia nervosa, (2) major gastrointestinal disease, chronic heart failure, hepatic failure and renal failure, uncontrolled diabetes, infection, or HIV, (3) antibiotic treatment in the 2 weeks before surgery, (4) abdominal infection or contamination, (5) surgery, radiotherapy, or chemotherapy during the previous 4 weeks, or (6) intestinal obstruction. We obtained peripheral blood samples and urine samples after patients were admitted to hospital and before treatment. The specimens from the intestinal wall and mesenteric lymph nodes (MLNs) were taken from the ileocecal junction during surgery, another blood samples were drawn from the middle colic vein and the portal vein.
Measurement of intestinal permeability
Intestinal barrier function is reflected by intestinal permeability (Secondulfo and others 2004). Intestinal permeability was assessed using a sugar-drink test as described previously (Buhner and others 2006). After an overnight fast (>6 h) and urine emptying, and after ensuring nutritional support had not been given, each patient drank a solution containing 10 g lactulose and 5 g mannitol dissolved in 100 mL of water. Intake of alcohol or nonsteroidal anti-inflammatory drugs was not allowed within 24 h before the test. Patients were in a fasting state during the first 5 h and encouraged to drink water 2 h after the start of the test. Urine samples were taken during the first 5 h of the test. Each urine sample was stored at −20°C. Urine was then desalted with amberlite-mixed bed-3 resin. Sugars were separated using meso-erythritol and turanose as internal standards. Sugars were analyzed by high-performance liquid chromatography with pulsed electrochemical detection (chromatography module: 250; Dionex, Idstein, Germany) and a 40-mm Carbopac PA-1 column (Dionex; eluent 150 mmol NaOH) at a flow of 1 mL/min.
Fecal smear examination
Intestinal flora imbalance was determined by fecal smear examination. We obtained stool samples after patients were admitted to hospital and before treatment. A sterile cotton swab was used to spread a layer of fresh feces quantum satis from a sterile container on a clean slide; the smear was fixed and stained with Gram's methods after it was air-dried, and then the specimen was observed with a microscope (field lens 100× eye lens 10) and recorded. Patients were considered to be alteration of intestinal flora if the ratio of Gram-positive cocci to total bacteria was over 20%.
Bacterial culture
MLNs from the terminal ileum were obtained using a new sterile blade scalpel during surgery, as described previously (MacFie and others 2006). Preventive use of antibiotics was instigated after blood samples and MLNs samples were taken. The MLNs samples mentioned above was homogenized in saline in a type-II laminar flow cabinet through maceration in a sterile mortar. It was then sown in a blood agar plate, in differential selective (MacConkey) agar, brain–heart infusion agar, and anaerobic blood agar plus phenylethyl alcohol media. Cultures were incubated under aerobic or anaerobic conditions as required. Micro-organisms observed in cultures of MLNs were identified through light microscopy and automated biochemical tests (MicroScan Walk-Away®).
Isolation, amplification sequencing of DNA
Blood samples were drawn from the portal vein during surgery. Bacterial DNA was detected as described previously (Such and others 2002). Briefly, 200 μL plasma from the portal vein was incubated in lysozyme-proteinase K buffer for 2 h and placed into QIAamp Spin Columns (Qiagen, Hilden, Germany). A broad-range polymerase chain reaction (PCR) for the amplification of a conserved region of the 16S ribosomal RNA prokaryotic gene was carried out using the following universal primers: 5′-AGA GTTTGATCATGGCTCAG-3′ and 5′-ACCGCGACTGCT GCTGGCAC-3′. The primers were located at positions 7–27 and 531–514 (Escherichia coli numbering). The total PCR volume was filtered with QIAquick Spin Columns (Qiagen) to remove the remaining primers and analyzed by 2% agarose gel electrophoresis and ultraviolet visualization. The final product was purified by precipitation with ethanol-acetate and analyzed with an ABI PRISM 310 Automated Sequencer (Applied Biosystems, Foster City, CA). Sequences obtained were compared with the database of the National Center for Biotechnology Information (NCBI; www.ncbi.nih.gov) using the advanced BLAST search tool. DNA extracted from E. coli as a positive control was used in PCRs to ascertain whether the PCR was successful. Additionally, sterile water and PCR mixtures (without template) were used as negative controls. The limit of detection of the method was evaluated. One colony from a culture of E. coli was diluted up to 100,000-fold in sterile water. DNA isolation from 200 μL of each dilution was undertaken. The yield and purity of DNA were measured by reading optical densities at 260 nm and 260/280 nm, respectively. Of each sample, 2 μL was included in a PCR.
Isolation of intestinal epithelial cells
Isolation of intestinal epithelial cells was undertaken as described previously (Hofmann and others 2007). Surgical specimens were dissected into small pieces, kept in RIPA buffer [Tris, NaCl, deoxycholic acid, Triton-X-100, sodium dodecyl sulfate (SDS), complete proteinase inhibitor mixture; Roche, Mannheim, Germany] and homogenized.
Quantification of serum cytokines levels
The blood samples from peripheral venous and the middle colic vein were collected in non-EDTA vacutainers (Greiner Bio-One GmbH, Kremsmuenster, Austria). Serum was removed after centrifugation at 1,610 g for 10 min and stored at −70°C until use. Detection of IL-6, TNF-α, and IFN-γ was done using the Human Th1/Th2/Th17 CBA kit (BD Biosciences, San Jose, CA) as per the manufacturer's instructions (Xu and others 2013). Beads coated with capture antibodies specific to the above named cytokines were mixed. Fifty microliters of the capture bead mixture was added to 50 μL of sample. To this sample-bead mixture, 50 μL of Phycoerythrin-conjugated detection antibody was added. The mixture was incubated for 3 h in the dark with occasional shaking to allow sandwich complexes to form which yield a fluorescent signal that is proportional to the concentration of the respective analyte. The samples were washed with 1 mL of wash buffer (200 g, 5 min) and the pellet resuspended in 300 μL wash buffer. Two hundred microliters of each sample was plated on PRO-BIND™ 96 well assay plates and analyzed on the FACSArray Bioanalyzer using FCAP FCS Filter and FCAP Array Software (BD Biosciences).
Visualization of TJ proteins OC, CL-2, and ZO-1 by immunohistochemistry
Immunohistochemistry was performed as described previously (Kinugasa and others 2007). After operations, terminal ileum tissues were excised and fixed in Bouin's solution and embedded in paraffin. Immunohistochemistry was performed on 5-μm-thick paraffin sections. After deparaffinization and dehydration, endogenous peroxidase was blocked with 30 mL/L H2O2 for 15 min. After blocking of endogenous peroxidases for nonspecific binding, slides were incubated with specific primary antibody overnight at 4°C. Primary antibodies [rabbit anti-human CL-2 antibody: Zymed Laboratories, San Francisco, CA; rabbit anti-OC antibody: Santa Cruz Biotechnology, Santa Cruz, CA; mouse anti-ZO-1 antibody: BD, Heidelberg, Germany] were applied in PBS according to the dilutions advised by the manufacturers. Next, the slides were washed 3 times for 5 min each with PBS and incubated with biotinylated goat anti-rabbit IgG (Jackson ImmunoResearch, Hamburg, Germany) at 37°C for 30 min, washed as before, and developed with horseradish peroxidase (HRP)-labeled streptavidin. The incubation and the subsequent washing were exactly the same as done before. Finally, diaminobenzidine chromogen, a peroxidase substrate, was added for color development. The reaction was stopped with a tap water rinse. The sections were counterstained with hematoxylin and mounted for examination.
Quantification of TJ proteins OC, CL-2, and ZO-1 by western blotting
Western blotting analyses were undertaken according to standard protocols using the following primary antibodies: rabbit anti-claudin-2 (2 μg/mL; Zymed), mouse anti-OC (clone 19, 1:250 dilution; BD, San Diego, CA), and mouse anti-ZO-1 (clone 1, 1:250 dilution; BD), as described previously (Ma and others 2010). Membranes were blocked at room temperature for 1 h in Tris buffer saline containing 0.05% Tween 20 (TBS-T) and 5 wt% nonfat dry milk. Nitrocellulose membranes were incubated with primary antibodies for 1 h at room temperature under slight agitation. Specific staining was controlled using the corresponding isotypes. Equal loading was ensured by staining with mouse anti-β-actin antibody (clone C4, 1:3,000 dilution; Chemicon, Temecula, CA). After washing, the HRP-conjugated secondary antibody (goat anti-rabbit IgG-HRP, 1:8,000; goat anti-mouse IgG-HR P, 1:3,000 dilution) was added and the membrane incubated for a further 1 h under gentle shaking. Proteins were detected using the ECL-Plus-western blotting detection system (Amersham Life Science, Braunschweig, Germany). Protein bands were quantified by densitometry using Image-Pro Plus 6.0 (Media Cybernetics, Rockville, MD).
Fluorescence in situ hybridization for translocated bacteria and immunohistochemistry for endotoxin
For visualization of translocated bacteria, fluorescence in situ hybridization (FISH) were used as described previously (Hogardt and others 2000). Paraffin-embedded intestinal tissue sections (5 μm) were fixed in 4% paraformaldehyde and rehydrated in a graded ethanol series. Slides were incubated for 30 min in preheated prehybridization solution (0.9 M NaCl, 20 mM Tris-HCl, and 0.01% SDS) at 46°C. This was followed by a 3-h incubation with the probe-containing hybridization solution (0.9 M NaCl, 20 mM Tris-HCl, 0.05% SDS, and 5 ng/mL probe) at a constant temperature of 46°C in a humidity chamber. Probe sequences were as follows: Universal Bacteria Antisense16S rRNA (EUB338) Cy3–5′-GCT GCC TCC CGT AGG AGT-3′. Subsequently, slides were washed for 15 min in preheated washing buffer (0.9 M NaCl, 20 mM Tris-HCl, and 0.01% SDS). After washing in H2O, slides were air-dried and counterstained with DAPI. Microscopic evaluation of stained bacteria was achieved using fluorescent microscopy. For the detection of endotoxin, specimens were incubated with primary mouse anti-Gram-negative endotoxin antibody (IgG2a, monoclonal, clone B40/23; Acris, Hiddenhausen, Germany). Mouse IgG2a (Sigma-Aldrich, Taufkirchen, Germany) was used as the isotype control at identical concentrations. Biotin-conjugated goat anti-mouse secondary antibody [IgG(H+I); Jackson ImmunoResearch, Hamburg, Germany] and the ABC Elite standard system (Vector Laboratories, Burlingame, CA) were employed. After washing, tissue was incubated with NovaRED (AEC; Vector Laboratories) for red immunostaining. Double-labeled immunohistochemistry was undertaken as described previously (Menzel and others 2006). Immunohistochemical-stained sections were captured (4 high-power fields) with a microscope at the indicated magnifications (Axiovert; Zeiss, Goettingen, Germany).
Statistical analyses
Continuous variables are expressed as mean±SD. Categorical variables are expressed as frequencies or percentages. Statistical differences in basal characteristics between groups were analyzed using the χ2 test for categorical data and the 2-sample t-test for quantitative data. We used the analysis of variance test with Bonferroni correnction for multiple comparisons of cytokines. The quantification of the 3 TJ proteins were expressed as mean±SD and compared with the Mann–Whitney U test. P<0.05 (2-sided) was considered significant. All analyses were conducted using SPSS ver18.0 (SPSS, Chicago, IL).
Results
Patient characteristics
According to exclusion criteria, 126 patients with gastric cancer were enrolled into the study. Table 1 shows the features of cachectic and noncachectic patients. All of the tumors were adenocarcinoma. No significant difference was noted with respect to sex or age between patients with cachexia and those without cachexia. The weight loss and CRP were significantly different between the 2 groups. Additionally, the serum albumin levels in the cachectic patients were obviously higher than in the noncachectic patients.
Table 1.
Characteristics of Patients with Advanced Gastric Cancer
| Cachexia (n=39) | Noncachexia (n=87) | P | |
|---|---|---|---|
| Gender (M/F) | 19/20 | 42/45 | 0.963a |
| Age (year) | 59.0±12.0b | 60.5±13.5 | 0.719c |
| C-reactive proteins (mg/L) | 17.3±6.5 | 7.6±4.1 | 0.028c |
| Serum ablumin (g/L) | 30.5±4.5 | 34.3±5.3 | 0.033c |
| Weight loss in within 6 months (%) | 13.2±2.8 | 6.3±4.9 | 0.031c |
| Positive MLNs cultures [n (%)] | 6 (15.4%) | 4 (4.6%) | 0.031a |
Pearson's χ2-test.
Mean±SD (all such values).
Two-sample t-test.
MLNs, mesenteric lymph nodes.
BT ratio and bacterial cultures in different groups
PCR technique had shown higher sensitivity in bacterial detection than conventional methods; therefore, we defined the patients detected with bacterial DNA from the portal vein as BT-positive. In the serum samples from the portal vein, fragments of bacterial DNA were detected in 11 of 39 patients with cachexia (28.2%) and in 8 of 87 noncachectic patients (9.2%); significant differences were found between cachectic and noncachectic patients (P=0.013). Additionally, Table 1 showed that the ratio of positive cultures of MLNs samples in cachectic patients (15.4%) were significantly higher than those in noncachectic patients (4.6%). A representative photograph of a DNA agarose electrophoresis gel is shown in Fig. 1a. All of the microorganisms identified are shown in Fig. 1b. The details of microorganisms identified by PCR in serum were displayed in Fig. 1c1 and c2, and Fig. 1d1 and d2 stand for the results of bacterial cultures from MLNs. It should be noted that 7 cachetic and 3 noncachetic patients were identified with more than 1 bacterial species by PCR in serum and 3 cachetic and 2 noncachetic patients were identified with more than 1 bacterial species by MLNs cultures.
FIG. 1.

(a) Demonstration of agarose gel electrophoresis results from PCR. Lane 1: DNA marker, lane 2: positive control (Escherichia coli), lanes 3–7 show an ∼545-base pair band corresponding to lane 3: E. coli, lane 4: Staphylococcus aureus, lane 5: Klebsiella pneumoniae, lane 6: Streptococcus pneumoniae, lane 7:Enterococcus facealis, lane 8: sterile water, lane 9: PCR mixtures without template. The microorganisms recognized in the experiment were shown in (b). The detailed number and species of bacteria identified by PCR in serum and bacterial cultures from MLNs were also included in this figure. (c1, c2) samples from serum, (d1, d2) samples from MLNs, 1: cachexia patients; 2: noncachexia patients. PCR, polymerase chain reaction; MLNs, mesenteric lymph nodes.
Intestinal permeability
The intestinal permeability (reflected by the ratio of lactulose to mannitol) was further increased in cachectic patients (Fig. 2), and it indicates the intestinal barrier dysfunction.
FIG. 2.

The differences in intestinal permeability between cachectic patients and noncachectic patients. Values are expressed as mean±SD.
Intestinal flora imbalance ratio in different groups
According to the results of fecal smear examination, alteration of intestinal flora appeared in 12 of 39 patients with cachexia (30.8%) and in 8 of 87 noncachectic patients (9.2%). A dramatically higher ratio of alteration of intestinal flora was found in cachectic patients compared with noncachectic patients (P<0.001). Among the total 20 patients who identified with positive fecal smears, 15 were identified as bacterial DNA positive and 5 were identified as bacterial DNA negative by PCR in serum. The ratio of alteration of intestinal flora in BT(+) patients (78.9%) was also significantly higher than that in BT(−) patients (4.7%, P<0.001).
Serum cytokines levels in different groups
The levels of IL-6, TNF-α, and IFN-γ in different groups were shown in Fig. 3. We found significantly higher levels of all these 3 kinds of cytokines in BT(+) cachectic patients than in BT(−) cachectic patients and BT(+) noncachexia patients. Moreover, the concentration of the cytokines in the middle colic vein was higher than in the peripheral venous in BT(+) cachectic patients.
FIG. 3.

The levels of IL-6, TNF-α, and IFN-γ of each grooup. CP: cachectic patients. NCP: noncachectic patients. Values are expressed as mean±SD. #P<0.05 middle colic vein of BT(+) CP versus middle colic vein of BT(–) CP. *P<0.05 middle colic vein of BT(+) CP versus middle colic vein of BT(+) NCP. §P<0.05 middle colic vein of BT(+) CP versus peripheral blood of BT(+) CP. BT, bacterial translocation.
TJ proteins OC, CL-2, and ZO-1
As seen from Fig. 4 a, in tissues from BT(+) patients, increased levels of CL-2 could be detected by immunohistochemistry staining as compared with BT(–) patients. The CL-2 proteins were detected mainly under the epithelial cells and presented spot granular staining in epithelium of BT(–) patients, whereas much more spot granular staining existed in the whole epithelial cells of BT(+) patients. OC and ZO-1 accumulated in the entire mucosa, and was obviously decreased in BT(+) patients. To confirm the differences in relevant TJ proteins found in immunohistochemistry staining, western blot analyses were carried out using lysates from isolated intestinal epithelial cells (Fig. 4b). In samples derived from BT(+) patients, CL-2 expression was increased compared with BT(–) patients (Fig. 4e), whereas OC and ZO-1 expressions were decreased (Fig. 4d, c).
FIG. 4.

Localization of tight junction proteins in the colonic mucosa of BT(–) patients and BT(+) patients. Representative photomicrographs show the distribution of ZO-1, OC, and CL-2 proteins in the colonic mucosa of BT(+) patients and BT(–) patients (a). Expression of tight junction proteins in the colonic mucosa of BT(–) patients and BT(+) patients. Representative immunoblots (b) and densitometric analyses of ZO-1 (c), OC (d), and CL-2 (e) in colonic mucosa of BT(–) patients (n=10) and BT(+) patients (n=19). Values are expressed as mean±SD. CL-2, claudins-2; OC, occludin; ZO-1, Zonula occluden-1.
Translocated bacteria and endotoxin
Strong colonization of adherent bacteria on the surface of small intestinal mucosa in BT(+) patients was noted in 18 out of 19 BT(+) patients. Such obvious bacterial colonization was not noted in BT(–) patients (Data not shown). We were not able to detect translocated bacteria with FISH technology in the lamina propria in BT(+) patients or in BT(–) patients. Therefore, we localized the bacterial products by immunohistochemical means and found endotoxin accumulation in the whole cross-section of intestinal wall of BT(+) patients. Further, endotoxin accumulation was predominantly located on the mucosal border, and the concentration of endotoxin decreased from the mucosal side to the serosal side gradually. This phenomenon was observed in 12 out of the 19 BT(+) patients. In comparison, endotoxin remained virtually absent in BT(–) patients (Fig. 5).
FIG. 5.
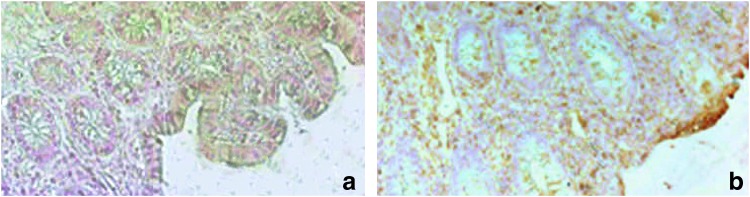
Immunohistochemical detection of endotoxin in intestinal tissue. Immunohistochemical staining of bacterial endotoxin in paraffin-embedded human intestinal tissue of BT(–) patients and BT(+) patients. No endotoxin was detected in BT(–) patients (a). In the intestinal mucus layer BT(+) patients, the endotoxin was obviously visible and the concentration of endotoxin was decreasing from the mucosa side to the serosa side gradually (b). Magnification 200×.
Discussion
In the present study, we found that cachectic patients had a significantly higher prevalence of BT than noncachectic patients. This is consistent with our previous study (Pirlich and others 2006), and the results of bacterial cultures from blood and MLNs supported this conclusion as well. In addition, the imbalance in intestinal microflora and intestinal mucosal barrier dysfunction, which are 2 of the major factors that contribute to BT, were analyzed to ensure the association between BT and cachexia. In this study, compared with noncachectic patients, a dramatically higher ratio of alteration of intestinal flora was found in cachectic patients. It should be noted that, among the total 20 patients who identified with the positive fecal smears, 15 were identified as bacterial DNA positive. That meant the ratio of alteration of intestinal flora in BT(+) patients reached 78.9%. This further illustrates intestinal flora imbalance as promoter of BT (Gatt and others 2007). As a further study, in BT-positive patients, we demonstrated different concentration levels between “systemic cytokines” and “local cytokines”; Moreover, we showed the alterations in TJs; The last but the most important finding in this research was that the endotoxin in the intestinal wall and its concentration gradually decreased from the mucosal side to the serosal side. Therefore, our present studies show that the primary step of BT in cancer cachexia patients is the lumen bacteria pass through the intestinal mucosal barrier via modified TJs.
We showed higher concentrations of IL-6, TNF-α, and IFN-γ in the middle colic vein than in the peripheral venous in BT(+) cachexia patients for the first time. Additionally, levels of IL-6, TNF-α, and IFN-γ were significantly higher in BT(+) cachectic patients than in BT(−) cachectic patients, BT(+) noncachectic patients. Some of the cytokines, such as IL-1, IL-6, IL-17, TNF-α, and IFN-γ, can participate in the pathogenesis of intestinal epithelial barrier dysfunction (Mckenzie and others 2007). Endogenous infection or BT may be the key for translocated bacteria and endotoxin because the patients enrolled in our study had no obvious exogenous infection, such as infection of the lung, urinary tract, central nervous system, or heart. In other words, as a natural repository of bacterium, the gut could be a potential source of BT. Considering our findings given above, we suggest a hypothesis that BT could contribute to cancer cachexia.First, malignancy may lead to intestinal mucosal barrier dysfunction and host immune impairment, then BT may be induced by these high-risk factors; the immune impairment can also lead to an imbalance in intestinal microflora. Bacterial overgrowth will appear under the situation of alteration of intestinal flora. Then, the translocated bacteria and endotoxin can adhere to the dysfunctional intestinal mucosa and will not be cleared up completely due to the low immunity of the patients, these antigens can activate the T cell subsets and NK cells in the intestinal epithelium and cytokine secretion increases (Norman and others 2008; Yajima and others 2009), the proinflammatory cytokines can stimulate these cells secrete more cytokines and disrupt intestinal epithelial barrier (Bruewer and others 2003), finally, result in the cascade effect of the cytokines and raise the rate of metabolism and suppress appetite. With the development of this vicious circle, cachexia and more obvious BT will occur. The proinflammatory cytokines play an important role in this process. This corresponded to the result of our experiment. The BT(+) cachectic patients have dramatic higher levels of IL-6, TNF-α, and IFN-γ. Compared with that in the peripheral venous, the higher concentrations of these cytokines in the middle colic vein can cause more damage to TJs. In other words, the local cytokines could play a more important role than systemic cytokines in the development of the vicious circle between cachexia and BT.
TJs are “gasket”-like seals that encircle each intestinal epithelial cell around its apical pole and that have a critical role in maintaining intestinal mucosal barrier function (Forster 2008). OC as the physical basis of TJ has been assumed to be the most reliable marker for TJ. And hydrolyzation of OC could increase the intestinal permeability (Wan and others 1999). The cytoplasmic scaffolding proteins ZO-1 and ZO-2 indirectly link claudins to the actin cytoskeleton, which stabilizes the TJ and is required to maintain their permeability (Umeda and others 2006). In this study, we found the OC and ZO-1 were both decreased suggesting the disruption of the TJs. On the other hand, CL-2, as another important protein we have known, expression was found to be upregulated in this experiment. There have been reports that the increased expression of CL-2 could lead to the damage of intestinal barrier function (Cereijido and others 2007). And, the alterations in TJs often result in increased paracellular leakage (Mullin and othres 2005). Defects in the TJs of the epithelium may lead to the influx of endotoxin into the intestinal wall.
In the experiment, we found that the intestinal mucosal layer of the 18 BT(+) patients was highly colonized with bacteria, whereas in the mucosal layer of all the BT(–) patients almost no adherent bacteria were detectable. However, we could not identify intraepithelial bacteria, but, endotoxin found in the outer membrane of bacteria was localized by immunohistochemical staining in 12 out of the 19 BT(+) patients, and the concentration of endotoxin gradually decreased from the mucosal side to the serosal side. This phenomenon showed, by visual means, translocation from the mucosa to serosa. Though the visualization of the translocated bacteria and/or endotoxin was not observed in all of the BT(+) patients, the dramatically high ratio of this phenomenon was a powerful evidence to our standpoint. The present study had limitations. The number of BT(+) patients does not correspond with the number of positive staining by immunohistochemistry. This suggests that there are other passways in the process of BT, and we are not able to seek out. Due to a lack of technical assistance, we could not visualize whether the translocated bacteria or endotoxin had been in the TJs. More effective methods need to be explored in the future. Besides, another question we need to think over is that why the local cytokines levels are higher than that in the peripheral blood. We just think the hepatic degradation may be an important reason. But there must be other reasons to be found. Moreover, such concentration difference between “local” and “system” may be a newview to some puzzles.
In summary, the altered TJs could be an important gateway of BT in gastric cancer cachexia and local cytokines could play a more important role than systemic cytokines in the process.
Acknowledgments
This research was supported, in part, by grants from Shandong Natural Foundation (ZR2010HM122) and National Natural Science Foundation of China (81270448).
Author Disclosure Statement
No competing financial interests exist.
References
- Bruewer M, Luegering A, Kucharzik T, et al. 2003. Proinlammatory cytokines disrupt epithelial barrier function by apoptosis-independent mechanisms. J Immunol 171(11):6164–6172 [DOI] [PubMed] [Google Scholar]
- Buhner S, Buning C, Genschel J, Kling K, Herrmann D, Dignass A, et al. 2006. Genetic basis for increased intestinal permeability in families with Crohn's disease: role of CARD15 3020insC mutation? Gut 55:342–347 [DOI] [PMC free article] [PubMed] [Google Scholar]
- Cereijido M, Contreras RG, Flores-Benitez D, Flores-Maldonado C, Larre I, Ruiz A, et al. 2007. New diseases derived or associated with the tight junction. Arch Med Res 38:465–478 [DOI] [PubMed] [Google Scholar]
- Donohoe CL, Ryan AM, Reynolds JV. 2011. Cancer cachexia: mechanisms and clinical implications. Gastroenterol Res Pract 2011:6014–6034 [DOI] [PMC free article] [PubMed] [Google Scholar]
- Findley MK, Koval M. 2009. Regulation and roles for claudin-family tight junction proteins. IUBMB Life 61(4):431–437 [DOI] [PMC free article] [PubMed] [Google Scholar]
- Forster C. 2008. Tight junctions and the modulation of barrier function in disease. Histochem Cell Biol 130:55–70 [DOI] [PMC free article] [PubMed] [Google Scholar]
- Gatt M, Reddy BS, MacFie J. 2007. Review article: bacterial translocation in the critically ill–evidence and methods of prevention. Aliment Pharmacol Ther 25:741–757 [DOI] [PubMed] [Google Scholar]
- Gencay C, Kilicoglu SS, Kismet K, Kilicoglu B, Erel S, Muratoglu S, et al. 2008. Effect of honey on bacterial translocation and intestinal morphology in obstructive jaundice. World J Gastroenterol 14(21):3410–3415 [DOI] [PMC free article] [PubMed] [Google Scholar]
- Hofmann C, Obermeier F, Artinger M, et al. 2007. Cell-cell contacts prevent anoikis in primary human colonic epithelial cells. Gastroenterology 132:587–600 [DOI] [PubMed] [Google Scholar]
- Hogardt M, Trebesius K, Geiger AM, Hornef M, Rosenecker J, Heesemann J, et al. 2000. Specific and rapid detection by fluorescent in situ hybridization of bacteria in clinical samples obtained from cystic fibrosis patients. J Clin Microbiol 38(2):818–825 [DOI] [PMC free article] [PubMed] [Google Scholar]
- Kinugasa T, Huo Q, Higashi D, Shibaguchi H, Kuroki M, Tanaka T, et al. 2007. Selective up-regulation of claudin-1 and claudin-2 in colorectal cancer. Anticancer Res 27(6A):3729–3734 [PubMed] [Google Scholar]
- Li J, Gu W, Hu MJ, Sun Y, Wang J, Zhang YL. 2009. Analysis of the immunololgical function in patients with gastric cancer. J Bengbu Med Coll 34:61–674 [Google Scholar]
- Ma Y, Semba S, Maemoto A, Takeuchi M, Kameshita I, Ishida A, et al. 2010. Oxazolone-induced over-expression of focal adhesion kinase in colonic epithelial cells of colitis mouse model. FEBS Lett 584(18):3949–3954 [DOI] [PubMed] [Google Scholar]
- MacFie J, Reddy BS, Gatt M, Jain PK, Sowdi R, Mitchell CJ. 2006. Bacterial translocation studied in 927 patients over 13 years. Br J Surg 93:87–93 [DOI] [PubMed] [Google Scholar]
- Mckenzie JA, Ridley AJ. 2007. Roles of Rho/ROCK and MLCK in TNF-α-induced changes in endothelial morphology and permeability. J Cell Physiol 213(1):221–228 [DOI] [PubMed] [Google Scholar]
- Menzel K, Hausmann M, Obermeier F, et al. 2006. Cathepsins B, L and D in inflammatory bowel disease macrophages and potential therapeutic effects of cathepsin inhibition in vivo. Clin Exp Immunol 146:169–180 [DOI] [PMC free article] [PubMed] [Google Scholar]
- Mi L, Zheng H, Xu x, Zhang J, Zhang D. 2012. Bacterial translocation contributes to cachexia from locally advanced gastric cancer. Hepatogastroenterology 59(119):2348–2351 [DOI] [PubMed] [Google Scholar]
- Mullin JM, Agostino N, Rendon-Huerta E, Thornton JJ. 2005. Keynote review: epithelial and endothelial barriers in human disease. Drug Discov Today 10:395–408 [DOI] [PubMed] [Google Scholar]
- Norman K, Pirlich M. 2008. Gastrointestinal tract in liver disease: which organ is sick? Curr Opin Clin Nutr Metab Care 11(5):613–619 [DOI] [PubMed] [Google Scholar]
- Pirlich M, Norman K, Loches H, et al. 2006. Role of intestinal function in cancer. Curr Opin Clin Nutr Metab Care 9:603–606 [DOI] [PubMed] [Google Scholar]
- Sanders DSA. 2005. Mucosal integrity and barrier function in the pathogenesis if early lesions in Crohn`s disease. J Clin Pathol 58(6):568–572 [DOI] [PMC free article] [PubMed] [Google Scholar]
- Secondulfo M, Riegler G, De Magistris L, Belletta M, et al. 2004. Intestinal permeability assessment before and after ileal pouch-anal anastomosis, Minerva Gastroenterol Dietol 50(2):155–163 [PubMed] [Google Scholar]
- Such J, Frances R, Munoz C, Zapater P, Casellas JA, Cifuentes A, et al. 2002. Detection and identification of bacterial DNA in patients with cirrhosis and culture-negative, nonneutrocytic ascites. Hepatology 36(1):135–141 [DOI] [PubMed] [Google Scholar]
- Tisdale MJ. 2000. Protein loss in cancer cachexia. Science 289:2293–2294 [DOI] [PubMed] [Google Scholar]
- Umeda K, Ikenouchi J, Katahira-Tayama S, Furuse K, et al. 2006. ZO-1 and ZO-2 independently determine where claudins are polymerized in tight-junction strand formation. Cell 126:741–754 [DOI] [PubMed] [Google Scholar]
- Wan H, Winton HL, Soeller C, Tovey ER, Gruenert DC, Thompson PJ, et al. 1999. Der p 1 facilitates transepithelial allergen delivery by disruption of tight jiunctions. J Clin Invest 104:123–133 [DOI] [PMC free article] [PubMed] [Google Scholar]
- Wang FJ, Graham WV, Wang YM, et al. 2005. Interferon-γ and tumor necrosis factor-α synergize to induce intestinal epithelial barrier dysfunction by up-regulating myosin light chain kinase expression. Am J Pathol 166(2):409–419 [DOI] [PMC free article] [PubMed] [Google Scholar]
- Wang X, Tully O, Ngo B, Zitin M, Mullin JM. 2011. Epithelial tight junctional changes in colorectal cancer tissues. ScientificWorldJournal 11:826–841 [DOI] [PMC free article] [PubMed] [Google Scholar]
- Wiest R, Rath HC. 2003. Gastrointestinal disorders of the critically ill. Bacterial translocation in the gut. Best Pract Res Clin Gastroenterol 17(3):397–425 [DOI] [PubMed] [Google Scholar]
- Xu XJ, Tang YM, Song H, Yang SL, Xu WQ, Shi SW, et al. 2013. A multiplex cytokine score for the prediction of disease severity in pediatric hematology/oncology patients with septic shock. Cytokine 64(2):590–596 [DOI] [PubMed] [Google Scholar]
- Yajima S, Morisaki H, Serita R. 2009. Tumor necrosis factor-alpha mediates hyperglycemia- augmented gut barrier dysfunction in endotoxemia. Crit Care Med 37(3):1024–1030 [DOI] [PubMed] [Google Scholar]