Abstract
Statistically based iterative image reconstruction has been widely used in positron emission tomography (PET) imaging. The quality of reconstructed images depends on the accuracy of the system matrix that defines the mapping from the image space to the data space. However, an accurate system matrix is often associated with high computation cost and huge storage requirement. In this paper, we present a method to address this problem using sparse matrix factorization and graphics processor unit (GPU) acceleration. We factor the accurate system matrix into three highly sparse matrices: a sinogram blurring matrix, a geometric projection matrix and an image blurring matrix. The geometrical projection matrix is precomputed based on a simple line integral model, while the sinogram and image blurring matrices are estimated from point-source measurements. The resulting factored system matrix has far less nonzero elements than the original system matrix, which substantially reduces the storage and computation cost. The smaller matrix size also allows an efficient implementation of the forward and backward projectors on a GPU, which often has a limited memory space. Our experimental studies show that the proposed method can dramatically reduce the computation cost of high-resolution iterative image reconstruction, while achieving better performance than existing factorization methods.
1. Introduction
Fast and efficient statistically based image reconstruction is in high demand for state-of-the-art high-resolution PET scanners. The system matrix that defines the mapping from the image space to the data space is the key to high-resolution image reconstruction. A variety of approaches have been proposed to calculate the system matrix based on numerical integrations (Schmitt et al 1988, Karuta and Lecomte 1992, Huesman et al 2000, Hu et al 2005, Moehrs et al 2008), Monte Carlo simulations (Mumcuoglu et al 1996, Qi et al 1998, Rafecas et al 2004), or experimental measurements (Panin et al 2006, Alessio et al 2006, Tohme and Qi 2009, Alessio et al 2010). However, an accurate system matrix is often associated with huge storage requirement and high computation cost in image reconstruction. This is especially true for fully 3D PET where a tremendous number of lines of response (LORs) are acquired, leading to very large datasets.
Many methods have been proposed to tackle these issues. They can be divided into two categories: on-the-fly calculation and matrix factorization. In the first category, the system matrix is calculated on-the-fly during each forward and backward projection. Although on-the-fly calculation eliminates the storage of a system matrix, the computation cost of image reconstruction can be expensive when an accurate system model is required in forward- and backward-projection operations. To keep the reconstruction time practical, approximations are introduced. For example, Kadrams proposed a rotate-and-slant projector (Kadrmas 2008), but the resulting forward and backward projectors may not be matched and their effects on the final reconstructed images need careful investigation (Zeng and Gullberg 2000). More recently, researchers have resorted to graphics processor units (GPUs) or other high-performance parallel computing platforms to speed up on-the-fly calculations. To maximize computation efficiency, on-the-fly forward projectors are often implemented in a ‘ray-driven’ manner and back projectors in a ‘voxel-driven’ manner (Bai and Smith 2006, Herraiz et al 2009). Similar to the rotational-based projector, the resulting forward and backward projectors are not matched. A different method was proposed for list-mode PET reconstruction (Pratx et al 2009), where the LORs were modeled as Gaussian tubes and calculated on the fly. This method avoids the ‘unmatched’ projector problem by implementing both forward and backward projectors in a ray-driven manner. However, a ray-driven backward projector with massive parallel threads can easily lead to the so-called ‘race condition’ where multiple threads attempt to modify the same memory location (image voxel) at the same time. To solve this problem, one has to use atomic operations, which can severely degrade GPU parallel performance if LORs are not well organized.
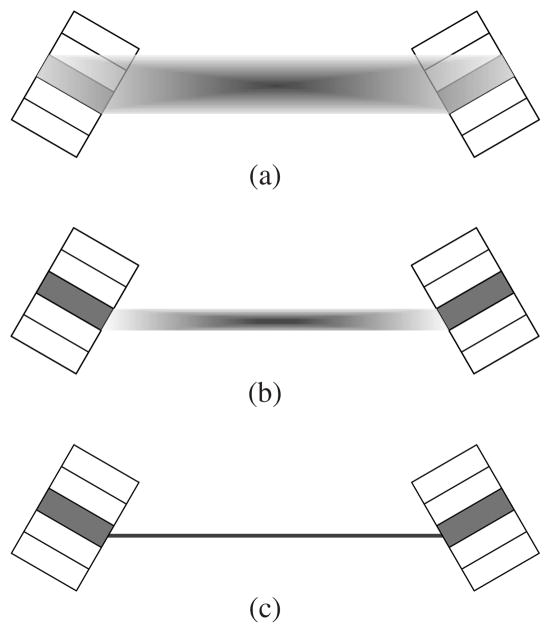
Alternative to on-the-fly calculations, researchers have used matrix factorization to reduce both storage and computation costs (Mumcuoglu et al 1996, Qi et al 1998, Sureau et al 2008, Rapisarda et al 2010, Cloquet et al 2010). Since matrix factorization can result in sparse matrices, system matrices can be precomputed and stored. The implementation of forward and backward projections only requires sparse-matrix and vector multiplication (SpMV) operation. The precomputed system matrix can also employ sophisticated models including experimental measurements, so it can achieve higher accuracy than on-the-fly calculations. For these reasons, here we focus on matrix factorization and propose a new method to obtain a sparse-factored system matrix that allows efficient implementation of fully 3D reconstruction with GPU acceleration. Similar to existing models, the proposed system model consists of three major components: a simplified geometric projection matrix, a sinogram blurring matrix and an image blurring matrix. Previously, the geometrical projection matrix was precomputed based on the solid angle subtended to the detector faces (figure 1(b)) and compressed with symmetries (Qi et al 1998). However, reconstructing high-resolution images often requires small-size image voxels, which can lead to a very large geometric projection matrix even with data compression. One example is the high-resolution zoom-in PET systems (Zhou and Qi 2009) where a high-resolution detector with much smaller crystals is incorporated into an existing PET scanner. Such a hybrid system requires images to be reconstructed using voxels that are much smaller than the PET detector crystals. In this paper, we propose a new strategy that uses a simpler geometrical projection matrix to further reduce the number of nonzero elements as well as the computational complexity associated with projection operations. As shown in figure 1(c), we only consider a single ray connecting the pair of crystals that forms an LOR. Obviously, it can be sparser than the solid-angle-based geometric projection matrix and can be precomputed and easily manipulated without high costs in storage and computation.
Figure 1.
A transaxial view of the LORs used by different system models. The boxes represent the detector modules in which the crystal pair that form the LOR are shaded in gray color; (a) shows the LOR of an accurate system matrix which involves the effect of photon penetration leading to a relatively large coverage in image space; (b) is the LOR of the geometric projection matrix based on the solid angle subtended to the two crystal faces, which results in smaller coverage in image space; (c) shows the LOR used in the proposed simple geometric projection matrix. The LOR in (c) is just a simple line connecting the centers of two crystal faces, which has far less nonzero elements than those of the LOR models shown in (a) and (b) and thus allows fast reconstruction. The accuracy of the system matrix is preserved with the help of the sinogram blurring matrix and image blurring matrix.
Using the simple geometric projection matrix alone is not sufficient for high-resolution image reconstruction, so we use the sinogram blurring matrix and the image blurring matrix to improve the model accuracy. The proposed sinogram blurring is analogous to that in existing factorization models, which models detector physical responses such as crystal attenuation, inter-crystal scattering and photon non-colinearity (Qi et al 1998, Mumcuoglu et al 1996, Panin et al 2006, Alessio et al 2006, Tohme and Qi 2009, Alessio et al 2010). The image blurring matrix plays a central role in compensating the degradation due to insufficient LOR sampling. The related blurring kernel can be estimated from point-source measurements and can also compensate for other resolution degradation effects. While the image blurring matrix has been used in previous works (Sureau et al 2008, Rapisarda et al 2010), the combination with a simple geometric projection matrix and sinogram blurring matrix makes the proposed model more accurate and efficient.
While we use voxels to represent images, the proposed factored system model can also adopt alternative basis functions, such as the blob function (Matej and Lewitt 1992), or the rotation-symmetric voxel assemblies recently proposed by Scheins et al (2011). With additional symmetries, the geometric projection matrix can be further compressed in size. However, it is worth noting that symmetry-based compression only reduces the storage size, but does not reduce the computational cost of image reconstruction. In comparison, the proposed sparse matrix factorization reduces both the storage size of the system matrix and computational cost of image reconstruction.
This paper is organized as follows. In section 2, we describe our sparse factorized system model and techniques to estimate the sinogram blurring matrix and the image blurring matrix. Section 3 describes the implementation of the forward and backward projectors on GPU. Section 4 compares the proposed method with the existing method using computer simulation and real animal data. Finally, discussions and conclusions are presented in section 5.
2. Theory
2.1. Sparse system matrix factorization
Let P be the system matrix of a fully 3D PET scanner. We propose to factor P into a set of sparse matrices as
| (1) |
where D is a diagonal matrix containing detector normalization factors and attenuation correction factors, B is a sinogram blurring matrix, G is a geometrical projection matrix and R is an image blurring matrix. The normalization factors are usually estimated from scans of uniform sources and attenuation factors from a transmission scan or CT image. Here we use the standard methods for normalization and attenuation correction, and focus our attention on B, G and R.
To reduce the number of nonzero elements, we propose to use a geometric projection matrix that is precomputed based on a simple line integral model (figure 1(c)). The sinogram blurring matrix B and the image blurring matrix R are estimated by minimizing the following objective function:
| (2) |
subject to that both B and R are non-negative matrices, where Φ is a distance measure, Ψ is a sparsity penalty with β and γ being parameters controlling the strength of the regularization. When P is given, the above problem is quite close to the non-negative matrix factorization which is well known in areas of data mining and machine learning (Lee and Seung 1999).
The above estimation can also be extended to the estimation of the blurring matrices from a set of point-source measurements. Let ej be a point source at voxel j, whose measurements are denoted by yj (which is equivalent to P ej). Then, we can estimate B and R by
| (3) |
where A ≥ 0 denotes that all the elements of A are non-negative. Using an alternating minimization algorithm leads to the following iterative procedure:
| (4) |
| (5) |
with k being the iteration number.
2.2. Sinogram-blurring matrix estimation
We focus our study on PET scanners with a cylindrical multi-ring geometry. There are two types of symmetries that can be exploited to simplify the sinogram blurring matrix estimation.
The first one is the axial parallel symmetry between sinograms with the same absolute ring difference. Let Nr be the total number of detector rings and define
| (6) |
as the set of ring pairs with the absolute ring difference equal to r. Clearly, we have 0 ≤ r ≤ Nr − 1. Let P
(m,n) ∈ ℝnp × nv denote the system matrix between ring pair (m, n), where np ≜ na × nb is the size of the sinogram with na projection angles and nb radial bins per angle and nv ≜ nx × ny × nz is the total number of image voxels with nx, ny and nz being the three dimensions along x, y and z axes, respectively. Let P (r) ∈ ℝ (|
 (r)|np)×nv be the collection of system matrices corresponding to the ring pairs in set
 (r), where |
 (r)| is the cardinality of
 (r). The axial parallel symmetry indicates that the sinogram blurring matrices are the same for all sub-matrices contained in P
 (r). Thus we can rewrite the sinogram blurring matrix for P
 (r) as
| (7) |
where I
|
 (r)| is the identity matrix of size |
 (r)| × |
 (r)|,
represents the two-dimensional sinogram blurring matrix and ‘⊗’ is the Kronecker product. As a result, the estimation of
requires only data from a single ring pair for each ring difference.
The second symmetry that we can use is the rotation symmetry within each sinogram. Let K be the number of crystals contained in each detector module transaxially; the rotational symmetry indicates that the blurring effect is the same for every K contiguous azimuthal angle. Such a property means that has a block Toeplitz structure
where and is the matrix whose ith diagonal elements are all ones and others are zeros. Here br, 0, ∈ ℝnbK ×nbK models the blurring effect taking place inside a group of azimuthal angles, while br, i, ∈ ℝnbK ×nb K (i ≠ 0) models the blurring effect between groups. Because the detector blurring effect is local, usually only blocks br,0, br,±1 and br,±(L−1) are nonzero and need to be estimated.
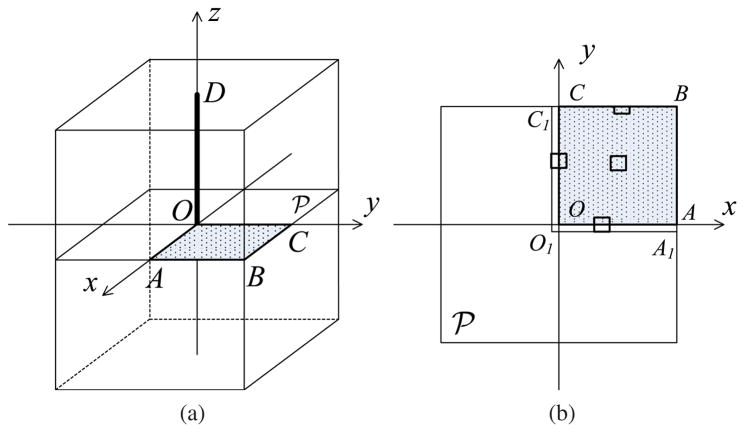
As described in Tohme and Qi (2009), one can use point-source scans located in the quadrant of the central transaxial plane (shown in figure 2(a)) to estimate the sinogram blurring matrix. In this case, it is natural to choose the negative Poisson log-likelihood function for Φ. We enforce the sparsity constraint explicitly by restricting the blurring effect to be within a small local region for each sinogram element. Then the maximum likelihood expectation-maximization (MLEM) algorithm can be employed to find the blurring matrix. Combination of the symmetries and local support constraint substantially reduces the computational cost of sinogram blurring matrix estimation. Details of the MLEM algorithm can be found in Tohme and Qi (2009).
Figure 2.
An illustration of the point-source distribution required by the blurring matrix estimation. In (a), the rectangular box represents the 3D image volume. The point sources are distributed in the quadrant OABC in the central transaxial image plane
 because of the geometric symmetries. The corresponding point-source measurements are used to estimate the sinogram blurring matrix and the transaxial image blurring matrix. The line segment OD indicates the point-source locations for the axial image blurring kernel estimation; (b) shows the transaxial view of the plane
 where each small rectangle represents a local support that constrains non-zero elements of a transaxial image blurring kernel. Because of the size of the local support, the actual region for estimating these kernels inside the quadrant is extended as shown by region O1A1BC1. For a kernel near the image boundary, we use a truncated local support to restrict the blurring operation inside the image (see the rectangle close to the edge BC for example).
2.3. Image-blurring matrix estimation
Let vj ≜ Rej ∈ ℝnv×1 be the image blurring kernel at the j th voxel, and denote . It is easy to show from (5) that each image blurring kernel can be estimated separately by
| (8) |
for j = 1, …, nv. The estimation of each kernel is similar to an image reconstruction whose computational complexity increases as the image size increases. Like the sinogram blurring kernel estimation, we allow vj to be nonzero only within a small local support near voxel j in the image space, so that the computation cost can be substantially reduced. Equation (8) shows that estimating the whole image blurring matrix requires point-source measurements from all voxels within the FOV, which can be cumbersome to acquire. To reduce the effort in point-source data acquisition, we model the image blurring matrix using the Kronecker product of an axial blurring matrix Ra ∈ ℝ nz ×nz and a transaxial blurring matrix Rtr ∈ ℝ (nxny )×(nxny):
| (9) |
Because the transaxial blurring kernel is independent of the axial position and the axial blurring kernel is independent of the transaxial position, estimating the above image blurring matrix only requires point-source measurements from voxels in the central transaxial plane and along the central axial axis (figure 2(a)). The axial and transaxial blurring matrices can be estimated jointly by
| (10) |
with γ1 and γ2 being the weighting parameters. Using alternating minimization and the property Ra ⊗ Rtr = (Ra ⊗ Inxny) (I nz ⊗ Rtr) = (Inz ⊗ Rtr) (Ra ⊗ Inxny) leads to
| (11) |
| (12) |
where
and
For the transaxial blurring kernels, we only need to estimate those in the quadrant of the central plane
 and obtain others by applying geometric symmetries (see figure 2(a)).
Once all matrices are estimated, one more step is necessary to normalize the plane efficiency of the factored system matrix. This is because we use plane-independent transaxial blurring matrices and cannot model the plane-dependent solid-angle effect. The plane efficiency factors can be obtained by first scanning a uniform cylinder filling the FOV and then taking the ratio between the average values of each acquired sinogram plane and the corresponding one predicted by the factored system matrix. The plane efficiency factors can be lumped into matrix D.
2.4. Algorithm summary
To sum up, the entire procedure for our proposed sparse system matrix factorization is as follows.
Acquire point-source scans based on the scheme shown in figure 2.
Calculate the simple geometric projection matrix G based on Siddon’s method (Siddon 1985).
-
For k = 1, 2, …
estimate using the method in Tohme and Qi (2009);
estimate the transaxial image blurring matrix by solving (11);
estimate the axial image blurring matrix by solving (12).
Calculate the plane efficiency factors for the factored system matrix.
We ran 100 iterations of the MLEM algorithm for each estimation step in (3.i)–(3.iii).
3. Parallel implementation
Our factored system matrix can be relatively small in size, which allows easy implementation of forward and backward projectors in GPUs. We also store the transposed matrices and implement the backward projector in a ‘voxel-driven’ manner so that each voxel can be processed independently without memory access conflict. For both forward and backward projectors, we only need the SpMV operation which is able to take full advantage of GPU’s parallel capability. Instead of using existing SpMV libraries (Bell and Garland 2008, NVIDIA 2009a), we designed specific GPU kernels to suit the factored system matrix.
Based on our factorized system model, each projector consists of three main steps: image domain blurring, geometric projection and sinogram domain blurring. The first and last steps are analogous to image filtering (with filters given by R and B) which can be efficiently implemented on GPU. Here we mainly discuss the second and most time-consuming step, the geometrical projection operation. Our development is guided by the basic CUDA parallel programming strategy (NVIDIA 2009b, 2009c). The projectors are able to handle the axial parallel symmetry, axial reflection symmetry and in-plane symmetry. The structure of projectors is shown in figure 3. Basically, each projector consists of three GPU kernels forming a pipeline. For the forward projector, they are an image buffer maker kernel, forward projection kernel and sinogram maker kernel, each of which is explained in detail below.
Figure 3.
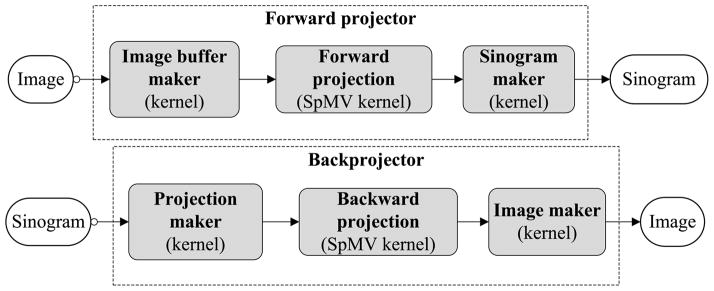
The pipeline of the proposed forward and backward projectors implemented on a GPU.
Image buffer maker
In this first GPU kernel, an image is re-organized into an image buffer. This is due to the in-plane symmetry which allows the entries Gij for one LOR to be repeatedly used for the other three symmetric LORs. Such an image buffer can be seen as a big image combining four (equal to the number of in-plane symmetries) images: the image itself and three symmetrical images according to the in-plane symmetry. We used the build-in vector type float4 to store this buffer, which has exactly four single-precision floating-point channels corresponding to the four images. The advantage is that such an array is automatically aligned in the GPU global memory, and hence a single instruction can read/write all four symmetric voxels at once to take the advantage of GPU’s ‘single instruction, multiple data’ (SIMD) capability. The operation only involves coordinate mapping, so it can be easily parallelized on GPU with one thread per voxel. As we will show in the simulation study, the cost of this GPU kernel is negligible.
SpMV-based projection
The second GPU kernel performs the geometric forward projection from the image space to the projection space. Here, one projection has type float4 also containing four data due to the use of the four-channel image buffer. Because of the axial reflection symmetry, the same LOR in the geometrical matrix can be used twice to produce two projections that can be stored together. At this stage, it is not necessary to arrange these projection data into sinograms because storing them in a sequential order provides us the coalesced global memory access pattern: continuous threads can access continuous locations of global memory, which is very efficient for data processing. Moreover, since the access pattern does not require many complex intermediate operations, it simplifies the kernel operations, lowers the risk of ‘warp divergence’ and maximizes the parallel efficiency (NVIDIA 2009b). Additionally, the created projection data buffer fulfills the ‘data locality’ condition, which has the extra benefit for acceleration of the projection speed by using the cached memory such as texture.
Sinogram maker
Once we have the projection data, the remaining step is to reorder them into sinograms. In this GPU kernel, we use lookup tables. For each thread we first read out a projection and then put it back properly to the sinogram according to the lookup tables. Similar to the first kernel, this kernel only requires a linear address mapping which is trivial with hundreds of GPU threads running simultaneously.
The three kernels in the backward projector are just the counterparts of those used by the forward projector. The first and last kernels are almost the same as those in the forward projector but doing the reverse operations. For the image-maker kernel, we merge all channels of an image buffer into a single channel to form an image. This is done with the componentwise summation. For the projection maker which transforms sinograms into our required projection format, it is just a reverse operation of the sinogram maker. The geometric backward projector is implemented in a similar way by using the transpose of the geometrical projection matrix. Its performance is close to the forward projector.
4. Experimental study
4.1. System setup
Our experimental studies were based on the microPET II scanner (Tai et al 2003). The scanner uses 90 detector modules arranged in three rings, with 30 detector modules in each ring. Each detector module consists of 14×14 lutetium oxyorthosilicate (LSO) crystals, each having size 1.0 mm×1.0 mm in cross section and 12.5 mm in length. The crystal pitch is 1.15 mm in both axial and transaxial directions. This leads to a total of 17 640 LSO crystals arranged in 42 rings with 420 crystals per ring. The ring diameter is 160 mm and the diameter of the transaxial FOV is about 80 mm. We considered to reconstruct the image of size 256×256×85 with voxel size 0.2 × 0.2 × 0.58 mm3. A total number of 42×42 sinograms are generated by the scanner, each containing 210 projection angles and 140 radial bins per angle.
4.2. System matrix calculation and storage
We calculated an accurate system matrix P using the numerical integral method proposed in Huesman et al (2000) and Hu et al (2005). Basically we divided each crystal into 10(transaxial)×10(axial)×25(radial) subcrystals. Each LOR is then calculated by tracing a total of (2500)2 lines connecting all the possible subcrystal pairs between the two crystals that forming the LOR, which models the solid-angle effect, crystal attenuation and photon penetration, but without inter-crystal scatter effect (as illustrated in figure 1(a)). The modeled effects are completely in 3D and are ring difference dependent. Consequently, the resulting matrix P does not satisfy the approximations used in section 2, so it provides a realistic test of the accuracy of the proposed factored system model. All point-source measurements were simulated by properly selecting columns from this matrix. The number of point sources we used was about 13 000. Our simple geometrical projection matrix, denoted by Gline.int, was computed using the simple ray-tracing method (as illustrated in figure 1(c)) where neither the crystal attenuation nor the photon penetration was taken into account. We assumed that all detectors have the same detection efficiency when performing sparse factorization. For the transaxial image blurring kernel estimation, we used a square window of 11×11 pixels. For the estimation of sinogram blurring matrix, we used the same window size, i.e. 11×11 bins coverage in radial and angular directions. Because each axial image blurring kernel only takes about 85 elements at most, we did not enforce any additional constraint on the support of nonzero elements. For each individual kernel estimation step, we ran 100 MLEM iterations and then set any value less than 0.0001% of the kernel maximum to zero. We manually stopped the alternating algorithm after five alternating updates between B and R (further iteration did not change kernels much). Once all matrices are obtained, we then calculate the plane efficiency of the factored matrix by simulating a uniform cylindrical source filling the FOV. We forward projected this source using both the accurate system matrix and the factored system matrix to obtain sinograms. Then we calculated a scaling factor for each sinogram as the ratio between the total counts of the accurate sinogram and the one based on the factored model. These scaling factors formed a diagonal matrix which was used to normalize the plane efficiency of the factorized system matrix.
We compared our model with the existing factored model available on micro-PET scanners. In the latter method, the geometrical projection matrix, denoted by Gsolid.ang, was calculated based on the solid-angle effect extended from each voxel to the faces of each detector pair (as illustrated in figure 1(b)). No depth interaction such as the photon penetration effect was included. Then a two-dimensional sinogram blurring matrix was estimated based on the method in Tohme and Qi (2009). The resulting factorized system matrix was also normalized using the same method described above. All sparse matrices used in our paper were stored in the compressed row storage (CRS) format (Saad 1994). Here we used two 4-byte integers to represent the column index and the row offset pointer, and a 32-bit single-precision floating-point number for the nonzero element value. All geometrical projection matrices (including the accurate system matrix P) were compressed based on in-plane and axial symmetries. Their sizes were also reduced by only considering those LORs intersecting the FOV.
A comparison of storage size is shown in table 1, where we denote and as the estimated sinogram blurring matrix, transaxial image blurring matrix and axial image blurring matrix based on the simple geometric projection matrix Gline.int. We see that the accurate system matrix with compression still requires about 18 Gbyte storage space. The geometrical projection matrix Gsolid.ang also occupies 6.1 Gbyte. This is because the voxel size is relatively small compared to the crystal size, leading to many voxels covered by one LOR between two crystals. The proposed matrix Gline.int only takes 410 Mbyte, about 45 times reduction compared to P, and 15 times reduction compared to Gsolid.ang. The transpose of Gline.int was also calculated and stored for the backward projector which requires 557 Mbyte. This is because the row of the transposed compressed geometric matrix is larger than its column size while the CRS format is less efficient to handle the storage of such a kind of sparse matrix. The transposes of , Rtr and Ra do not change storage size since they are square matrices. The total memory space for our proposed sparse factorized system model is about 1.0 Gbyte which is much less than that required by either P or Gsolid.ang.
Table 1.
System matrix size comparison.
| P |
|
|
|
||||
|---|---|---|---|---|---|---|---|
| Size (byte) | 18.2 G | 6.1 G + 6.3 M | 410.3 M + 5.7 M + 31.6 M + 4.0 K | 557 M |
4.3. Evaluation of computing performance
All programs were developed using C++ on a PC running a 64-bit Linux with a quad-core 2.4 GHz Intel Xeon 5530 processor. The GPU was the NVIDIA Tesla C1060 which has 240 streaming processor cores and a total of 4 Gbyte global memory space. For large system matrices such as P and Gsolid.ang, the forward and backward projectors were only implemented on the CPU with multi-threaded computing. For the proposed factorized system matrix, both CPU- and GPU-based projectors were implemented. The GPU-based programs were compiled with NVIDIA’s nvcc compiler and the aid of CUDA Toolkits 2.3 (NVIDIA 2009d), while the CPU-based programs used GNU C++ compiler with option −03 for performance optimization.
A comparison of the computational costs is shown in table 2. Clearly, the factorized system matrix has far less computational cost than the nonfactorized model P. The acceleration is proportional to the reduction of the number of nonzero elements in the system matrix. Moreover, using GPU can reduce the computational cost by another order of magnitude. As we can see, one forward projection and one backward projection take only about 5 s on the GPU, which is more than 200 times faster than that based on the accurate system matrix running on four CPUs. Such dramatic speedup comes from the combination of matrix factorization and well-designed GPU pipelines. Table 3 shows the computational cost of each kernel inside a forward projector and a backward projector. Clearly, most of the time is taken by the forward and backward SpMV operations while the image buffer maker and sinogram buffer maker occupy less than 1% of the computation time. In addition, with the aid of texture memory, the backward projector speed could be improved further by about 40%.
Table 2.
Computation costs of different system models. All CPU implementations have used four threads.
| P |
|
|
||||
|---|---|---|---|---|---|---|
| CPU | CPU | CPU | GPU | |||
| Forward projection (s) | 621 | 300 | 25 | 2.6 | ||
| Backward projection (s) | 658 | 323 | 29 | 2.4 | ||
| Total | 1279 | 623 | 54 | 5.0 | ||
Table 3.
Computation cost of each kernel in forward and backward projectors (unit in millisecond).
| Forward pipeline (ms) | Image maker | Forward projection (SpMV) | Sinogram maker |
|---|---|---|---|
| 2.2 | 1668.0/1897.7 (with/w.o texture memory) | 17.3 | |
| Backward pipeline (ms) | Sinogram maker | Backward projection (SpMV) | Image maker |
| 15.4 | 1431.2/2989.2 (with/w.o texture memory) | 5.7 |
4.4. Evaluation of image quality
4.4.1. Simulated phantom data
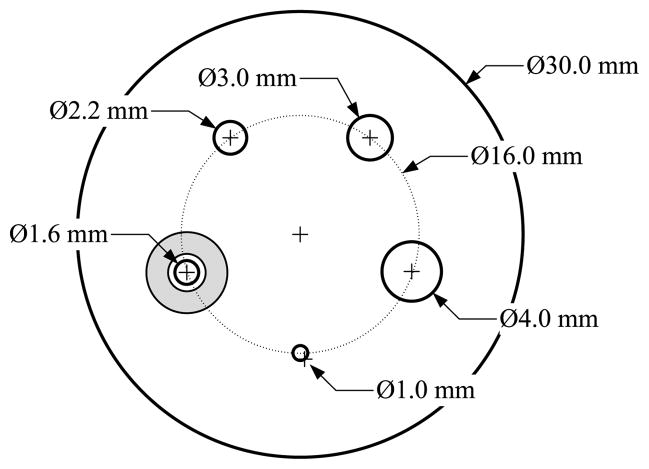
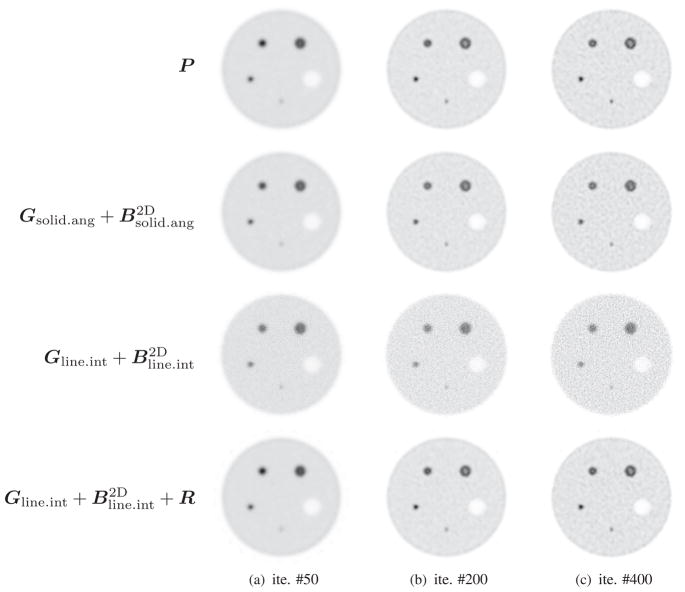
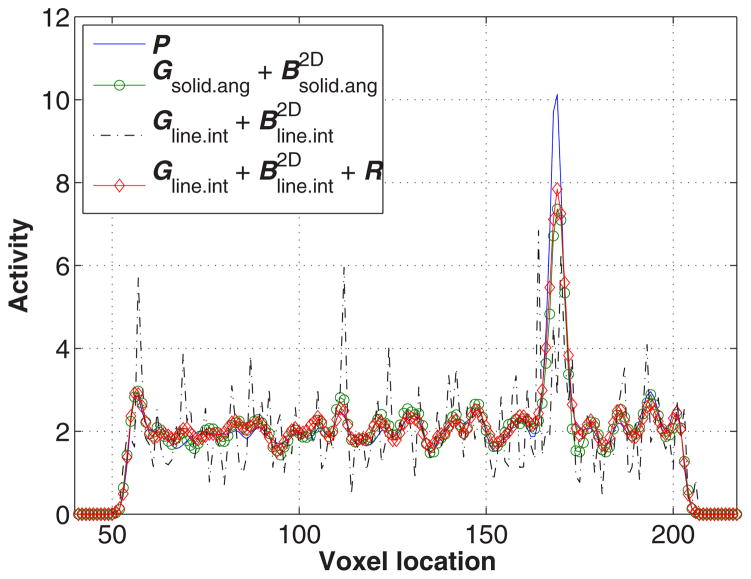
To evaluate image reconstruction quality, we simulated a NEMA-type phantom which consists of five spheres inside a cylinder 30 mm in diameter and 46 mm long. The center cross section of this phantom is shown in figure 4. The diameters of spheres are 1.0 mm, 1.6 mm, 2.2 mm, 3.0 mm and 4.0 mm, respectively. The largest sphere is a cold sphere whose activity ratio to the warm background is 1:10, and the other four spheres are hot spheres with an activity ratio of 5:1. A total of 460 million counts were generated including 10% background randoms and scatters. All images were reconstructed by running 400 MLEM iterations starting from a uniform image. Figures 5 and 6 compare transaxial and sagittal slices of reconstructed images at different iteration numbers. The importance of the image blurring matrix is clear. The simple system model without this blurring matrix results in severe artifacts (see the third row of figures 5 and 6 or the line profile comparison in figure 7), while such a problem can be well alleviated by the image blurring matrix. Visually the results based on our proposed sparse factorization model are close to those yielded by either the accurate system model or the existing factored model. This can also be confirmed by the line profile comparison shown in figure 7. Note that the reconstructed image with the proposed method also produces ‘cold’ centers for the hot spots as the accurate model. This edge artifact is caused by the Gibbs ringing effect and is a known behavior of PET image reconstruction with resolution recovery (Alessio et al 2010). To eliminate such an artifact, one could consider post-smoothing or penalized image reconstruction.
Figure 4.
The cross section of the computer-simulated phantom. The shaded region shows an example of a cross section of a selected background region which is used to calculate the mean background activity surrounding the enclosed sphere. Other background regions are selected in a similar fashion. The largest sphere is a cold sphere whose activity ratio to the warm background is 1:10, and the other four spheres are hot spheres with an activity ratio of 5:1.
Figure 5.
A comparison of central transaxial slices of reconstructed images using different system models. The first row shows the results based on the accurate system matrix, the second row shows the results based on the factorization model and the third and the fourth rows correspond to the proposed factorization model without and with the image blurring matrix R, respectively.
Figure 6.
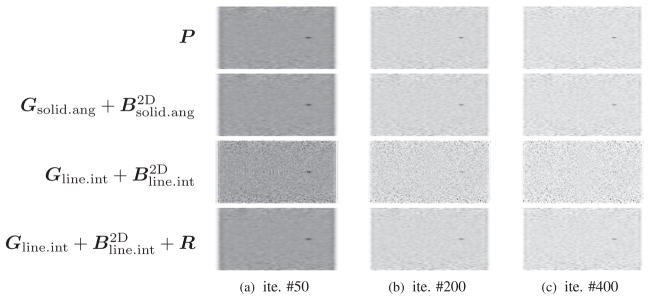
A comparison of central sagittal slices of reconstructed images. Note that the voxel size is anisotropic.
Figure 7.
A comparison of vertical line profiles drawn through the images shown in figure 5(c).
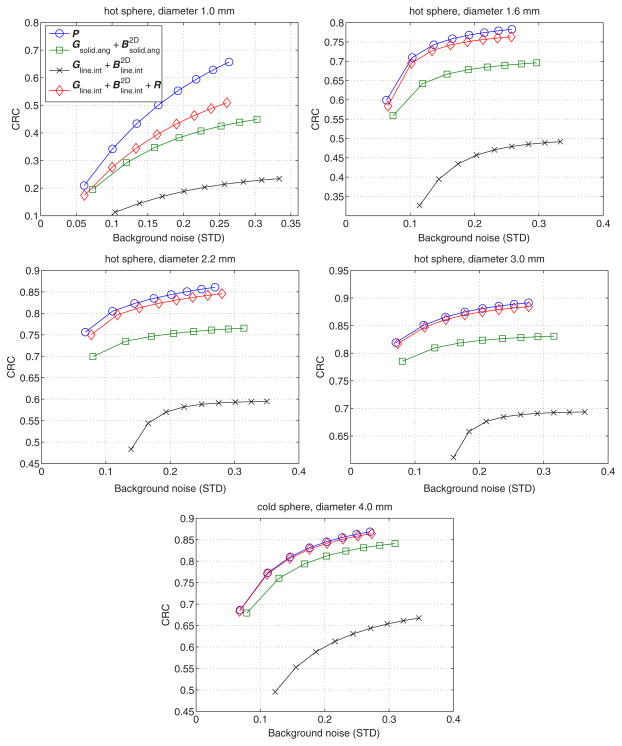
For a quantitative comparison, we calculated the sphere contrast recovery coefficient (CRC) using
| (13) |
where t indicates the iteration number, is the true activity ratio between the j th sphere and the warm background, is the mean activity value in sphere j at the tth iteration and μb(t) is the mean of the background image at the tth iteration. Different spheres used different background regions for calculating the mean value and the noise standard deviation. The background region we selected is a hollow spherical region that surrounds each sphere. The thickness of each region is 2 mm with the inner radius 1 mm larger than the radius of the sphere inside.
Figure 8 shows the CRC of the five spheres versus background standard deviation tradeoff curves obtained by varying the number of iterations. Except for the smallest sphere (1.0 mm), the CRC curves produced by our proposed model are very close to the curves of the accurate system model. However, this comparison is not fair because the data were generated using the accurate system matrix and hence the results of the accurate model do not suffer from any model mismatch. A more meaningful comparison is between the proposed model and the solid-angle-based model. The results show that the CRC curves produced by our proposed model are always above those by the solid-angle-based method, even though the proposed model is more than 10 times faster. This is because our sparse system model uses both the sinogram blurring matrix and image blurring matrix, which results in better accuracy in system modeling and leads to improvements in both image quality and reconstruction speed.
Figure 8.
A comparison of the CRC versus background noise curves for different spheres. The points in each curve, from left to right, corresponds to iteration 50, 100, 150, 200, 250, 300, 350, and 400, respectively.
4.4.2. Real mouse data
A 27 g mouse was injected with 0.22 mCi of [18F]FDG and scanned by the microPET II scanner at UC Davis. The scan started 30 min post-injection and lasted 30 min. In total 149 million counts were acquired. The detector efficiency coefficients were obtained from a 3.3 h scan of a uniform cylindrical source. Images were reconstructed with 256×256×83 voxels each having size 0.2×0.2×0.58 mm3. For image reconstruction, we used the same system matrix that we derived in the simulation study. We reconstructed images using 200 MLEM iterations. No correction was done for attenuation, scatters or randoms.
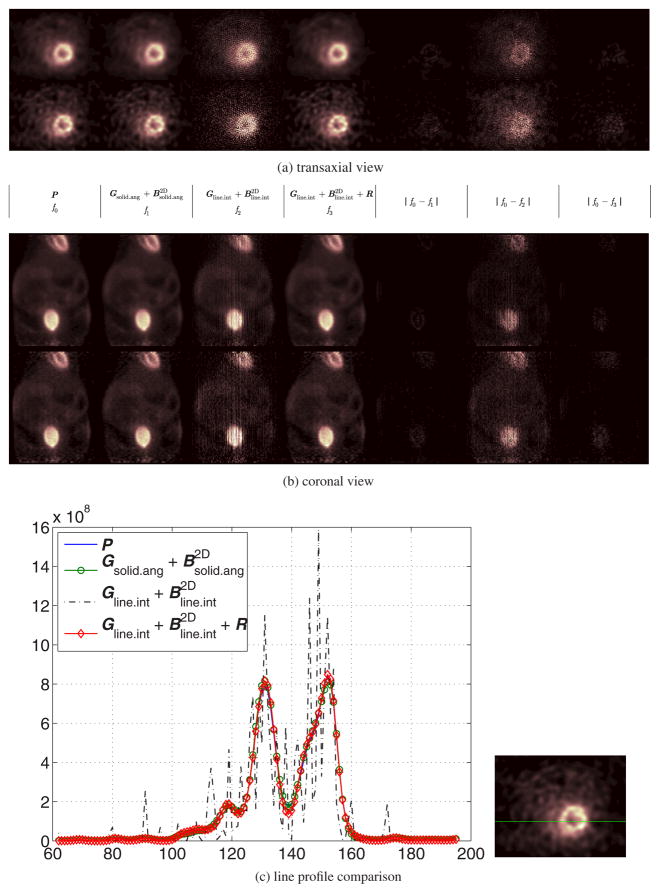
Figure 9 compares the reconstructed images produced by different system models. Similar to the simulation study, we see that our sparse factorization model yields good results that are visually close to those obtained by the accurate model and the existing factored model. If the image blurring matrix is not used, the sparse system model produces an image with severe artifacts as shown in the third column in figure 9 or the difference image shown in the fifth column in figure 9. To quantify the difference between the images obtained by the accurate model and the factored models, we calculated the normalized root of mean square (NRMS) error which is defined by ||x̂ acc − x̂ ||/||x̂acc|| × 100%, where ||·|| denotes the standard Euclidean norm, x̂ is the reconstruction using one of the factored models and x̂acc is the reconstruction using the accurate system model. The results are shown in table 4. It shows that both approximate models are close to the accurate model with the maximum NRMS less than 5%. The accuracy of the proposed model is similar to that of the existing factored model using a solid-angle-based geometric projection matrix, but the reconstruction speed is about two orders of magnitude faster.
Figure 9.
Comparison of reconstructed images of the real mouse data. In both (a) and (b), there are two rows corresponding to reconstructed images at the 50th (top) and 200th (bottom) iterations, respectively. The first column shows the reconstructed images using the accurate system matrix P; The second shows reconstructed images using ; The third and fourth columns are results of without and with the image blurring matrix , respectively. The fifth column is the absolute difference image between the result of the accurate system matrix and the result of ; The sixth and the last column are the absolute difference images between the results of the accurate model and the results based on the sparse factorization model without and with the image domain blurring matrix, respectively. Here the image size has been truncated for better visualization. (c) Line profiles through the reconstructed myocardium at the 200th iteration using different system models. The location of these profiles is indicated by the horizontal line in the right image. (a) Transaxial view, (b) coronal view and (c) line profile comparison.
Table 4.
A comparison of the NRMS versus iteration for different factored models.
| Iteration number | 50 | 150 | 200 | |
|---|---|---|---|---|
|
|
1.5% | 2.6% | 4.4% | |
|
|
1.4% | 3.1% | 4.1% |
5. Discussion and conclusion
We have presented a sparse system matrix factorization method for fast and efficient fully 3D PET image reconstruction. Our model uses three sparse matrices: a simplified geometric projection matrix, a sinogram blurring matrix and an image blurring matrix. We precomputed the geometric projection matrix using the simple line integral method, while estimated the two blurring matrices by minimizing the difference between the factored system matrix and the accurate system matrix. We have developed methods to efficiently estimate these two blurring matrices using limited number of point-source scans. In our simulation studies, we found that the storage size of the factored model is about 2.5% of the accurate system model. Because of its relatively small size, the factored matrix can be loaded directly into memory of a CPU or a GPU. Our experimental results show that our proposed matrix factorization reduces the storage size of the system matrix and image reconstruction time by more than a factor of 10 compared to the previous factored model on a CPU. Implementing the forward and backward projectors on a GPU leads to another order of magnitude speedup. In addition, since it uses both the sinogram blurring and image blurring matrices to improve the model accuracy, the proposed factorization method offers better performance than existing factorization methods that only use one blurring matrix.
Currently, only a single GPU has been used for computation but the extension to multiple GPU computing is straightforward; hence, further speedup can be expected. One limitation of our GPU implementation is that both the geometric projection matrix and its transpose need to be saved before reconstruction. This may cause troubles when the GPU global memory is very limited. One way to solve this problem is to consider more efficient sparse matrix format such as the compressed sparse blocks (CSB) format described in (Buluç et al 2009) with which both GPU-based forward projector and backward projector can use the same matrix without introducing the race conditions in read/modify/write operations. Alternatively, the storage cost can be reduced by using highly symmetric image basis functions proposed in Scheins et al (2011).
In this paper, we focused on small-animal imaging and ignored the attenuation effect of the subject being imaged. However, the method is applicable to clinical whole-body scanners and the attenuation factors can be incorporated in the system matrix. We also note that the simulated point-source measurements are far less realistic. Real point-source scans are inevitably contaminated by noise which would in turn affect the accuracy of kernel estimation. One possible improvement is to consider parameterization of the sinogram and image blurring kernels to reduce the effect of noise (Panin et al 2006, Kotasidis et al 2011). In addition, if the parameters change smoothly, one may also reduce the number of point-source measurements. We will address these issues in future work.
Acknowledgments
The authors would like to thank Hongjie Liang and CMGI at UC Davis for the real mouse data. This work was supported by the Department of Energy under award no DE-FG02-08ER64677 and National Institutes of Health under grant nos R01EB005322 and R01EB000194.
Contributor Information
Jian Zhou, Email: jnzhou@ucdavis.edu.
Jinyi Qi, Email: qi@ucdavis.edu.
References
- Alessio A, Kinahan P, Lewellen T. Modeling and incorporation of system response functions in 3-D whole body PET. IEEE Trans Med Imaging. 2006;25:828–37. doi: 10.1109/tmi.2006.873222. [DOI] [PubMed] [Google Scholar]
- Alessio AM, Stearns CW, Tong S, Ross SG, Kohlmyer S, Ganin A, Kinahan PE. Application and evaluation of a measured spatially variant system model for PET image reconstruction. IEEE Trans Med Imaging. 2010;29:938–49. doi: 10.1109/TMI.2010.2040188. [DOI] [PMC free article] [PubMed] [Google Scholar]
- Bai B, Smith A. Fast 3D iterative reconstruction of PET images using PC graphics hardware. IEEE Nucl Sci Symp Conf Rec. 2006;5:2787–90. [Google Scholar]
- Bell N, Garland M. NVIDIA Technical Report NVR-2008-004. NVIDIA Corporation; 2008. Efficient sparse matrix-vector multiplication on CUDA. [Google Scholar]
- Buluç A, Fineman JT, Frigo M, Gilbert JR, Leiserson CE. Parallel sparse matrix-vector and matrix-transpose-vector multiplication using compressed sparse blocks. SPAA’09: Proc. of the 21st Annu. Symp. on Parallelism in Algorithms and Architectures; NY, USA: ACM; 2009. pp. 233–44. [Google Scholar]
- Cloquet C, Sureau FC, Defrise M, Simaeys GV, Trotta N, Goldman S. Non-Gaussian space-variant resolution modelling for list-mode reconstruction. Phys Med Biol. 2010;55:5045. doi: 10.1088/0031-9155/55/17/011. [DOI] [PubMed] [Google Scholar]
- Herraiz J, Espaa S, Garcia S, Cabido R, Montemayor A, Desco M, Vaquero J, Udias J. GPU acceleration of a fully 3D iterative reconstruction software for PET using CUDA. IEEE Nucl Sci Symp Conf Rec. 2009:4064–7. [Google Scholar]
- Hu J, Qi J, Huber J, Moses W, Huesman R. MAP image reconstruction for arbitrary geometry PET systems with application to a prostate-specific scanner. Int. Meeting on Fully Three-Dimensional Image Reconstruction in Radiology and Nuclear Medicine; Salt Lake City, UT. 2005. pp. 416–20. [Google Scholar]
- Huesman R, Klein G, Moses W, Qi J, Reutter B, Virador P. List-mode maximum-likelihood reconstruction applied to positron emission mammography (PEM) with irregular sampling. IEEE Trans Med Imaging. 2000;19:532–7. doi: 10.1109/42.870263. [DOI] [PubMed] [Google Scholar]
- Kadrmas D. Rotate-and-slant projector for fast LOR-based fully-3-D iterative PET reconstruction. IEEE Trans Med Imaging. 2008;27:1071–83. doi: 10.1109/TMI.2008.918328. [DOI] [PMC free article] [PubMed] [Google Scholar]
- Karuta B, Lecomte R. Effect of detector weighting functions on the point spread function of high-resolution PET tomographs: a simulation study. IEEE Trans Med Imaging. 1992;11:379–85. doi: 10.1109/42.158942. [DOI] [PubMed] [Google Scholar]
- Kotasidis F, Matthews J, Angelis G, Noonan P, Jackson A, Price P, Lionheart W, Reader A. Single scan parameterization of space-variant point spread functions in image space via a printed array: the impact for two PET/CT scanners. Phys Med Biol. 2011;56:2917–42. doi: 10.1088/0031-9155/56/10/003. [DOI] [PubMed] [Google Scholar]
- Lee DD, Seung HS. Learning the parts of objects by non-negative matrix factorization. Nature. 1999;401:788–91. doi: 10.1038/44565. [DOI] [PubMed] [Google Scholar]
- Matej S, Lewitt R. Image representation and tomographic reconstruction using spherically-symmetric volume elements. IEEE Nucl Sci Symp Conf Rec. 1992;2:1191–3. [Google Scholar]
- Moehrs S, Defrise M, Belcari N, Guerra AD, Bartoli A, Fabbri S, Zanetti G. Multi-ray-based system matrix generation for 3D PET reconstruction. Phys Med Biol. 2008;53:6925. doi: 10.1088/0031-9155/53/23/018. [DOI] [PubMed] [Google Scholar]
- Mumcuoglu E, Leahy R, Cherry S, Hoffman E. Accurate geometric and physical response modelling for statistical image reconstruction in high resolution PET. IEEE Nucl Sci Symp Conf Rec. 1996;3:1569–73. [Google Scholar]
- NVIDIA. CUDA Data Parallel Primitives Library. 2009a http://gpgpu.org/developer/cudpp.
- NVIDIA. CUDA Programming Guide 3.0. 2009b http://developer.download.nvidia.com/compute/cuda/3_0/toolkit/docs/NVIDIA_CUDA_ProgrammingGuide.pdf.
- NVIDIA. CUDA sdk 2.3. 2009c http://developer.nvidia.com/object/cuda_2_3_downloads.html.
- NVIDIA. CUDA toolkit 2.3. 2009d http://developer.nvidia.com/object/cuda_2_3_downloads.html.
- Panin V, Kehren F, Michel C, Casey M. Fully 3-D PET reconstruction with system matrix derived from point source measurements. IEEE Trans Med Imaging. 2006;25:907–21. doi: 10.1109/tmi.2006.876171. [DOI] [PubMed] [Google Scholar]
- Pratx G, Chinn G, Olcott P, Levin C. Fast, accurate and shift-varying line projections for iterative reconstruction using the GPU. IEEE Trans Med Imaging. 2009;28:435–45. doi: 10.1109/TMI.2008.2006518. [DOI] [PMC free article] [PubMed] [Google Scholar]
- Qi J, Leahy R, Cherry S, Chatziioannou A, Farquhar T. High-resolution 3D Bayesian image reconstruction using the microPET small-animal scanner. Phys Med Biol. 1998;43:1001–13. doi: 10.1088/0031-9155/43/4/027. [DOI] [PubMed] [Google Scholar]
- Rafecas M, Mosler B, Dietz M, Pogl M, Stamatakis A, McElroy D, Ziegler S. Use of a Monte Carlo-based probability matrix for 3-D iterative reconstruction of MADPET II data. IEEE Trans Nucl Sci. 2004;51:2597–605. [Google Scholar]
- Rapisarda E, Bettinardi V, Thielemans K, Gilardi MC. Image-based point spread function implementation in a fully 3D OSEM reconstruction algorithm for PET. Phys Med Biol. 2010;55:4131. doi: 10.1088/0031-9155/55/14/012. [DOI] [PubMed] [Google Scholar]
- Saad Y. Sparskit: a basic tool kit for sparse matrix computations. 1994 http://www-users.cs.umn.edu/saad/software/SPARSKIT/sparskit.html.
- Scheins J, Herzog H, Shah N. Fully-3D PET image reconstruction using scanner-independent, adaptive projection data and highly rotation-symmetric voxel assemblies. IEEE Trans Med Imaging. 2011;30:879–92. doi: 10.1109/TMI.2011.2109732. [DOI] [PubMed] [Google Scholar]
- Schmitt D, Karuta B, Carrier C, Lecomte R. Fast point spread function computation from aperture functions in high-resolution positron emission tomography. IEEE Trans Med Imaging. 1988;7:2–12. doi: 10.1109/42.3923. [DOI] [PubMed] [Google Scholar]
- Siddon R. Fast calculation of the exact radiological path for a three-dimensional CT array. Medi Phys. 1985;12:252–5. doi: 10.1118/1.595715. [DOI] [PubMed] [Google Scholar]
- Sureau FC, Reader AJ, Comtat C, Leroy C, Ribeiro M-J, Buvat I, Trebossen R. Impact of image-space resolution modeling for studies with the high-resolution research tomograph. J Nucl Med. 2008;49:1000–8. doi: 10.2967/jnumed.107.045351. [DOI] [PubMed] [Google Scholar]
- Tai Y, Chatziioannou A, Yang Y, Silverman R, Meadors K, Siegel S, Newport D, Stickel J, Cherry S. MicroPET II: design, development and initial performance of an improved microPET scanner for small-animal imaging. Phys Med Biol. 2003;48:1519–37. doi: 10.1088/0031-9155/48/11/303. [DOI] [PubMed] [Google Scholar]
- Tohme M, Qi J. Iterative image reconstruction for positron emission tomography based on a detector response function estimated from point source measurements. Phys Med Biol. 2009;54:3709–25. doi: 10.1088/0031-9155/54/12/007. [DOI] [PMC free article] [PubMed] [Google Scholar]
- Zeng G, Gullberg G. Unmatched projector/backprojector pairs in an iterative reconstruction algorithm. IEEE Trans Med Imaging. 2000;19:548–55. doi: 10.1109/42.870265. [DOI] [PMC free article] [PubMed] [Google Scholar]
- Zhou J, Qi J. Theoretical analysis and simulation study of a high-resolution zoom-in PET system. Phys Med Biol. 2009;54:5193. doi: 10.1088/0031-9155/54/17/008. [DOI] [PubMed] [Google Scholar]


