Abstract
The epigenetic regulation of transcription factor genes is critical for T-cell lineage specification. A specific methylation pattern within a conserved region of the lineage specifying transcription factor gene FOXP3, the Treg-specific demethylated region (TSDR), is restricted to regulatory T (Treg) cells and is required for stable expression of FOXP3 and suppressive function. We analysed the impact of hypomethylating agents 5-aza-2′-deoxycytidine and epigallocatechin-3-gallate on human CD4+ CD25− T cells for generating demethylation within FOXP3-TSDR and inducing functional Treg cells. Gene expression, including lineage-specifying transcription factors of the major T-cell lineages and their leading cytokines, functional properties and global transcriptome changes were analysed. The FOXP3-TSDR methylation pattern was determined by using deep amplicon bisulphite sequencing. 5-aza-2′-deoxycytidine induced FOXP3-TSDR hypomethylation and expression of the Treg-cell-specific genes FOXP3 and LRRC32. Proliferation of 5-aza-2′-deoxycytidine-treated cells was reduced, but the cells did not show suppressive function. Hypomethylation was not restricted to FOXP3-TSDR and expression of master transcription factors and leading cytokines of T helper type 1 and type 17 cells were induced. Epigallocatechin-3-gallate induced global DNA hypomethylation to a lesser extent than 5-aza-2′-deoxycitidine, but no relevant hypomethylation within FOXP3-TSDR or expression of Treg-cell-specific genes. Neither of the DNA methyltransferase inhibitors induced fully functional human Treg cells. 5-aza-2′-deoxycitidine-treated cells resembled Treg cells, but they did not suppress proliferation of responder cells, which is an essential capability to be used for Treg cell transfer therapy. Using a recently developed targeted demethylation technology might be a more promising approach for the generation of functional Treg cells.
Keywords: 5-Aza-dC, decitabine, epigallocatechin-3-gallate, methylation, regulatory T cell
Introduction
Regulatory T (Treg) cells play an important role in establishing peripheral immune tolerance. Functional defects of Treg cells or their low percentage in all T cells may cause or worsen inflammatory or autoimmune diseases including inflammatory bowel disease, rheumatoid arthritis, type I diabetes, multiple sclerosis or graft-versus-host disease.1,2 Adaptive Treg-cell-based immune therapies are therefore considered for treatment of these diseases.3,4 Due to the need for high numbers of Treg cells and their limited availability, the in vitro induction of Treg cells from CD4+ CD25− T cells could be used to overcome these limitations.
A reliable and sufficient in vitro or in vivo induction of human Treg cells with stable suppressive function is lacking. Stability of immunosuppressive phenotype is a critical parameter for Treg cells and is required for safe therapeutic application5 to exclude harmful effects developing through conversion into pro-inflammatory T cells in vivo. The most specific feature of Treg cells, ensuring stable Treg cell phenotype with stable FOXP3 expression and suppressive function, is the existence of an unmethylated FOXP3 Treg-specific demethylated region (TSDR),6,7 which does not occur in other major blood cells, including other T cells.7
Transforming growth factor-β (TGF-β) treatment has been a promising approach for in vitro induction of human Treg cells. The TGF-β-induced cells express Treg cell marker molecules but do not show a Treg cell phenotype and suppressive function in vivo.8 In addition, TGF-β-induced human Treg cells lose FOXP3 expression and suppressive activity and do not exhibit hypomethylated FOXP3-TSDR.9 Another approach has been the over-expression of Treg-cell-specific master transcription factor FOXP3 in CD4+ CD25− T cells. These cells show a partial unstable Treg cell phenotype10,11 and also do not exhibit Treg-cell-specific hypomethylation within FOXP3-TSDR.12
In this study we analyse the potency of the two hypomethylating agents – 5-aza-2′-deoxycytidine (5-Aza-dC) and epigallocatechin-3-gallate (EGCG) – for in vitro induction of functional Treg cells through generation of a hypomethylated FOXP3-TSDR. We analysed the expression of Treg-cell-specific genes and the functional properties of treated CD4+ CD25− T cells. 5-Aza-dC is a derivative of 5-azacytidine. Both substances are inhibitors of DNA methyltransferases and are used for therapy of patients with myelodysplastic syndrome and acute myeloid leukaemia.13 In these patients, 5-azacytidine has been reported to augment Treg cell expansion in blood.14–16 EGCG is the most abundant catechin of green tea and has been reported to have cardioprotective, anti-cancer, anti-infective properties17 and protective effects in autoimmune diseases.18 EGCG has also been described to be a potent inhibitor of DNA methyltransferases19,20 and to induce FOXP3 in the Jurkat T-cell line.21
Materials and methods
Ethics statement and study group
The study was approved by the Ethics Committee at the University Hospital Essen (Northrine Westfalia, Germany, no.: 13-5546-BO). Buffy coats were provided by the Institute of Transfusion Medicine of the University Hospital Essen. Blood was taken from healthy male blood donors, who gave their written informed consent.
Antibody staining
For immune staining, FITC-, allophycocyanin-, Pacific Blue and phycoerythrin-conjugated monoclonal antibodies against CD4 (clone RPA-T4), CD25 (clone BC96, 4E3), CD127 (clone eBioRDR5) and FOXP3 (clone PCH101) were used (all from eBioscience, San Diego, CA). For measurement of proliferation activity, cell staining was performed with eFluor670 proliferation dye (eBioscience).
Isolation and cultivation of CD4+ CD25− T cells, CD4+ CD25high CD127low T cells and dendritic cells
Peripheral blood mononuclear cells were isolated from human buffy coat using Biocoll (Biochrom, Berlin, Germany) separating solution. First, 100 ml of buffy coat was diluted with 100 ml PBS and 20 ml of the suspension was carefully layered over 20 ml Biocoll separating solution and centrifuged for 25 min at 700 g. The lymphocyte layer was transferred into a new tube and washed with PBS once. For long-term storage 1·2 × 108 cells were suspended in 2 ml medium [Iscove's modified Dulbecco's medium (IMDM), 10% fetal calf serum, 25 μm β-mercaptoethanol, penicillin/streptomycin and 10% DMSO] and stored in liquid nitrogen. CD4+ T cells were enriched by autoMACS using the CD4+ T-cell isolation Kit (Miltenyi Biotech, Bergisch-Gladbach, Germany). Cells were stained with CD4−, CD25− and CD127 antibodies for 15 min at 4° and washed with FACS buffer. Cell sorting of CD4+ CD25− and CD4+ CD25high CD127low T cells was performed using a FACS Aria II (BD, Franklin Lakes, NJ). Purity was > 95% as controlled by FACS. FACS-sorted lymphocytes were cultivated in RPMI-1640 (Life Technologies, Carlsbad, CA) medium with 1 μg/ml anti-CD3, 1 μg/ml anti-CD28 (both Miltenyi Biotec, Bergisch Gladbach, Germany), 100 U/ml interleukin-2 (IL-2; eBioscience) and penicillin/streptomycin at 37°, 5% CO2 in an incubator (Thermo Scientific Heracell 150i, Waltham, MA). Cells (2.5 × 10⁶) were cultured with two different concentrations of 5-Aza-dC (5 μm and 1 μm) or EGCG (50 μm and 5 μm), which were added every other day (both Sigma-Aldrich, St Louis, MO). Both substances were diluted in 1% DMSO/99% IMDM. Control cells were stimulated with 1% DMSO diluent. After 4 days of incubation, medium was replaced by fresh medium including hypomethylating agents, as required. One part of the cells was used for RNA extraction, DNA extraction and FACS analysis. Three days later, residual cells were subjected to RNA and DNA extraction or FACS analysis. All experiments were performed at least in triplicate with cells from different blood donors.
CD11c+ dendritic cells were isolated from peripheral blood mononuclear cells of the same blood donor, using biotin CD11c antibodies (BioLegend, San Diego, CA) at 4°. After incubation and washing with FACS buffer, anti-Biotin beads (Miltenyi Biotech) were added for 15 min at 4°. Labelled cells were washed, suspended in 500 μl FACS buffer and used for magnetic separation by autoMACS.
mRNA expression
Isolation of RNA was performed using the QIAamp RNA-easy Kit (Qiagen, Hilden, Germany) according to the manufacturer′s guidelines. RNA concentration was measured by NanoDrop ND-1000 spectrophotometer (peqLAB, Erlangen, Germany) and samples were stored at −80°. For cDNA synthesis, up to 8 μg RNA was mixed with oligo dT primers/random hexamers and incubated for 10 min at 70°. The synthesis was performed for 60 min at 42° with Moloney murine leukaemia virus reverse transcriptase (Promega, Madison, WI). Afterwards, the enzyme was heat inactivated at 95° for 5 min. Quantitative real-time PCRs were performed using SYBR Green (ThermoFisher Scientific, Waltham, MA). Each reaction contained 2.5 μl of each primer, 5 μl cDNA template and 10 μl 2× SYBR Green MasterMix. RNA expression was measured using the following primers:
FOXP3_fw: 5-GAACGCCATCCGCCACAACCTGA-3
FOXP3_rev: 5-CCCTGCCCCCACCACCTCTGC-3
glycoprotein A repetitions predominant (GARP)_fw: 5-TTCCAGGGCCCCAGCTAACTAATG-3
GARP_rev: 5-GGGGCCACTTCCTGTCCACTT-3
interleukin-10 (IL-10)_fw: 5-CCCTAACCTCATTCCCCAA CCAC-3
IL-10_rev: 5-CCGCCTCAGCCTCCCAAAGT-3
TGF-β_fw: 5-TGGCTGTATGAGCACCGTTA-3
TGF-β_rev: 5-TGGATCTTTGCCATCCTTTC-3
TBX21_fw: 5-ACGCTTCCAACACGCATATC-3
TBX21_rev: 5-ATCTCCCCCAAGGAATTGAC-3
interferon-γ (IFN-γ)_fw: 5-TGACCAGAGCATCCAAAAGA-3
IFN-γ_rev: 5-CTCTTCGACCTCGAAACAGC-3
GATA3_fw: 5-GTCCTGTGCGAACTGTCAGA-3
GATA3_rev: 5-GGGGAAGTCCTCCAGTGAGT-3
IL-4_fw: 5-GCCACCATGAGAAGGACACT-3
IL-4_rev: 5-ACTCTGGTTGGCTTCCTTCA-3
retinoic acid receptor-related orphan receptor γT (RORγT)_fw: 5- AGGGCTCCAAGAGAAAAGGA-3
RORγT_rev: 5-CTTTCCACATGCTGGCTACA-3
IL-17_fw: 5-ACCAATCCCAAAAGGTCCTC-3
IL-17_rev: 5-GGGGACAGAGTTCATGTGGT-3
ribosomal protein S9 (RPS9)_fw: 5-CGCAGGCGCAGACGGTGGAAGC-3
RPS9_rev: 5-CGAAGGGTCTCCGCGGGGTCACAT-3
Primers specific for the ribosomal protein S9 (RPS9) gene were used for normalization of real-time quantitative PCR data. Real-time-PCR was carried out using a 7500 Fast Real Time PCR system (Applied Biosystems, Carlsbad, CA) using the following parameters: denaturation at 95° for 10 min, followed by 40 cycles at 95° for 15 seconds, 56° (IL-10: 58°) for 60 seconds and 72° for 60 seconds.
DNA microarray hybridization and analysis
Quality and integrity of the total RNA was controlled on an Agilent Technologies 2100 Bioanalyzer (Agilent Technologies, Waldbronn, Germany). A 500-ng sample of total RNA was applied for the Cy3-labelling reaction using the one-colour Quick Amp Labeling protocol (Agilent Technologies). Labelled cRNA was hybridized to Agilent′s human 4 × 44k microarrays for 16 hr at 68° and scanned using the Agilent DNA Microarray Scanner. Expression values were calculated using the software package Feature Extraction 10.5.1.1 (Agilent Technologies). Statistical analysis of the expression data was performed using the Gene Spring Software package (Agilent Technologies). The array data discussed in this publication have been deposited in NCBI's Gene Expression Omnibus and are accessible through GEO Series accession number GSE53448 (http://www.ncbi.nlm.nih.gov/geo/query/acc.cgi?acc=GSE53448).
DNA extraction and DNA methylation analysis
DNA was isolated using a QIAamp DNA Mini Kit (Qiagen) according to the manufacturer's guidelines. Global methylation analysis was performed using a MethylFlash Methylated DNA Quantification Kit (Epigentek, Farmingdale, NY) with 100 ng of extracted DNA. CD4+ CD25− T lymphocytes from healthy subjects were cultured with 5-Aza-dC or EGCG for 4 days. Global DNA methylation was compared with that of CD4+ CD25− T lymphocytes cultured without 5-Aza-dC or EGCG. DNA methylation of cultured CD4+ CD25− control cells was set at 100%. Fluorescence was measured using a GENios Microplate Reader (Tecan, Männedorf, Switzerland).
For quantification of FOXP3-TSDR methylation, bisulphite DNA was prepared using a BisulFlash DNA Modification Kit (Epigentek) according to the manufacturer's guidelines. Analysis was performed with FOXP3-TSDR quantitative analysis of methylated alleles (QAMA) assay, described elsewhere.22
For deep amplicon analysis of FOXP3-TSDR using next-generation sequencing (NGS), bisulphite-treated DNA was amplified with tagged primers (shown below, FOXP3_AMP5-fw and FOXP3_AMP5-rev) using AmpliTaq Polymerase (Life Technologies) and following settings: 5 min denaturation at 95°, first 14 cycles touchdown from 63° to 56° following 40 cycles with 95° for 20 seconds, 56° for 1 min, 72° for 1 min and a final elongation for 5 min at 72°.
FOXP3_AMP5_fw: 5-CTTGCTTCCTGGCACGAGTGTTTGGGGGTAGAGGATTT-3
FOXP3_AMP5_rev: 5-CAGGAAACAGCTATGACTATCACCCCACCTAAACCAA-3
The PCR products were purified using a QIAEX II Gel Extraction Kit (Qiagen) and the standard protocol. Afterwards, sample-specific sequences (multiplex identifiers) and universal linker tags (454 adaptor sequences, A- or B-primer) were added in a second PCR, with the same setting as described above.
The PCR products were purified using QIAEX II Gel Extraction Kit and DNA concentration was measured with the NanoDrop ND-1000 Spectrophotometer (ThermoScientific, Wilmington, DE). Amplicons were purified using the Agencourt AMPure XP Beads (Beckman Coulter, Krefeld, Germany) system according to the protocol recommended by the manufacturer (Roche Amplicon Library Preparation Method Manual) and quantified by NanoDrop ND-1000 Spectrophotometer. The bisulphite amplicons were diluted, pooled, clonally amplified in an emulsion PCR (emPCR) and sequenced on the Roche/454 GS junior system according to the manufacturer's protocol (Roche emPCR Amplification Method Manual – Lib-A and Roche Sequencing Method Manual). Methylation analysis with NGS was not performed on cells treated with 50 μm EGCG due to strong toxic effects after 7 days of incubation.
Cell viability
Cultured cells were centrifuged for 5 min at 310 g, resuspended in 200 μl FACS buffer and supplemented with 2.5 μl 7-aminoactinomycin D (7-AAD) viability staining solution. Measurement of 7-AAD was performed after 5 min of incubation in the dark by FACS.
Proliferation and suppression assay
For assaying proliferation, CD4+ CD25− T cells (2 × 10⁵) treated with 5-Aza-dC and EGCG for 4 days were stained with eFluor670 and cultured for 3 more days in the presence of 1 μg/ml soluble anti-CD3 and 5 × 10⁴ CD11c+ dendritic cells of the same blood donor. Analysis of cell proliferation was performed in 96-well flat-bottom plates filled up to a final volume of 200 μl with IMDM (Life Technologies) containing 10% fetal calf serum using FACS.
For analysis of suppressive function, 2 × 10⁵ 5-Aza-dC-treated and EGCG-treated cells were co-cultured with eFluor670-stained freshly sorted CD4+ CD25− responder T cells at a ratio of 1 : 1 and CD11c+ dendritic cells in the presence of anti-CD3 antibody (1 μg/ml). Analysis was performed after 72 hr of cultivation.
Statistical analysis
Statistical analysis was performed with GraphPadPrism 5.0 software (GraphPad Software, La Jolla, CA). P < 0·05 was constituted as significant (*P < 0·05, **P < 0·01, ***P < 0·001).
Results
Analysis of global DNA methylation
Treatment with 5-Aza-dC significantly reduced global DNA methylation to about 60% of that in the untreated cells at both concentrations, (P < 0·001 for 5 μm 5-Aza-dC and P < 0·01 for 1 μm 5-Aza-dC). Treatment with 50 μm EGCG reduced global DNA methylation to 80% of that in untreated cells (P < 0·05). No global hypomethylation was detected for the lower EGCG concentration of 5 μm (Fig. 1).
Figure 1.
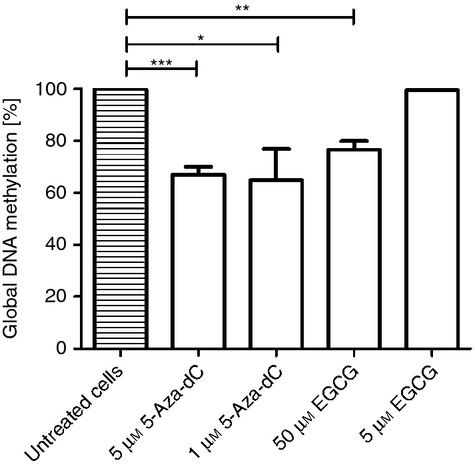
Analysis of global DNA methylation in 5-aza-2′-deoxycytidine (5-Aza-dC) and epigallocatechin-3-gallate (EGCG) cultured CD4+ CD25− T cells. Cells were cultured with two different concentrations of 5-Aza-dC and EGCG and stimulated with anti-CD3 and anti-CD28 monoclonal antibody before cultivation. DNA methylation was normalized to anti-CD3 and anti-CD28 stimulated CD4+ CD25− T cells, not treated with hypomethylating agents. The DNA methylation of these cells was set 100%. *P < 0·05, **P < 0·01, ***P < 0·001.
Methylation status of FOXP3-TSDR
Regulatory T cells with stable suppressive function are characterized by an unmethylated FOXP3-TSDR and stable expression of FOXP3.9 Therefore, we analysed the potency of these hypomethylating agents for induction of a Treg-cell-specific methylation pattern within this crucial gene region. Freshly isolated or untreated cultured human CD4+ CD25− T cells are completely methylated within FOXP3-TSDR as quantified by methylation-sensitive FOXP3-TSDR QAMA assay, whereas Treg cells are almost completely unmethylated (Fig. 2a). Four days of culture with 1 μm and 5 μm 5-Aza-dC significantly reduced DNA methylation within FOXP3-TSDR by 8–9% with P < 0·01 for both concentrations, as quantified by QAMA. Incubation of cells for 7 days led to further reduction of FOXP3-TSDR DNA methylation of 15–20% depending on the 5-Aza-dC concentration, with P < 0·001 for both concentrations. In contrast to 5-Aza-dC, the 5 μm and 50 μm EGCG was not sufficient to induce relevant hypomethylation within FOXP3-TSDR.
Figure 2.
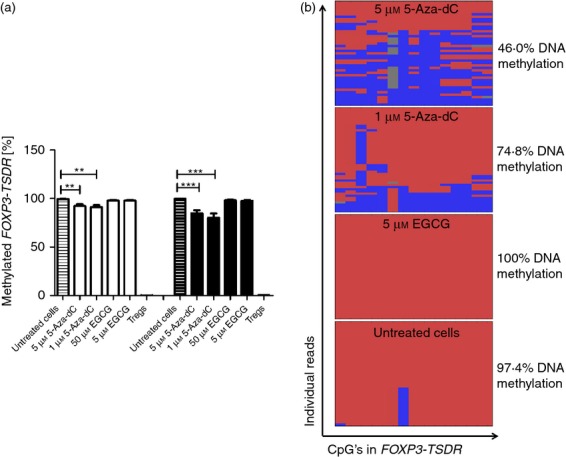
(a) FOXP3-TSDR methylation analysis by methylation sensitive quantitative RT-PCR. Quantification of methylated and unmethylated DNA using specific Taqman probes in quantitative analysis of methylated alleles and quantitative RT-PCR. CD4+ CD25− T cells stimulated with DNA methyltransferases inhibitors for 4 days (white bars) and 7 days (black bars). (b) FOXP3-TSDR methylation by Next Generation Sequencing (NGS). Quantification of methylated and unmethylated DNA using NGS, blue colour indicates unmethylated CpG, red colour indicates methylated CpG. Mean methylation of all CpGs and sequence reads is shown besides. **P < 0·01, ***P < 0·001.
We used deep amplicon NGS to determine the methylation pattern of FOXP3-TSDR induced by 5-Aza-dC. NGS showed a scattered methylation profile of the CpGs within FOXP3-TSDR within individual sequence reads, demonstrating that 5-Aza-dC does not induce demethylation of the entire region in most cells (Fig. 2b). The average demethylation of 5-Aza-dC-treated cells was 25–50% within this region as determined by NGS. The discrepant results obtained by both methods can be explained by the presence of the scattered methylation pattern. The QAMA assay was originally designed for the quantification of physiologically existing cells that are either completely unmethylated (Treg cells) or fully methylated (other human CD4+ T cells) within this region and does not adequately capture scattered methylation patterns.22 NGS also confirmed the failure of the low EGCG concentration to induce hypomethylation within FOXP3-TSDR.
Cell viability
Hypomethylating agents may have toxic effects, so we analysed the viability of cultured cells using 7-AAD staining. Both concentrations of 5-Aza-dC and 5 μm EGCG showed fewer toxic effects compared with 50 μm EGCG, which showed strong toxic effects with about 97% of 7-AAD-positive cells after 7 days of culture. The 5 μm concentration of EGCG showed about 66% 7-AAD-positive cells compared with about 20% AAD-positive cells of untreated CD4+ CD25− T cells after 4 and 7 days of culture (Fig. 3).
Figure 3.
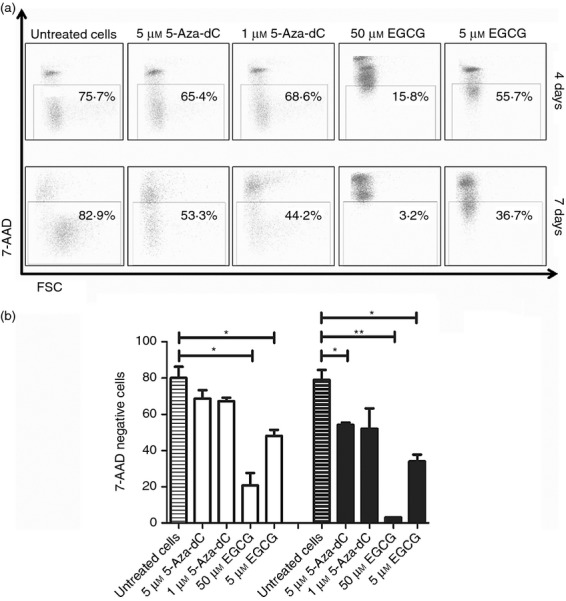
Cell viability. CD4+ CD25− T cells were cultured with 5-aza-2′-deoxycytidine (5-Aza-dC) and epigallocatechin-3-gallate (EGCG) and were analysed for viability after 7-AAD staining.(a) Gate setting is shown from one representative experiment. (b) Cell viability after 4 days (white bars) and 7 days (black bars). *P < 0·05, **P < 0·01.
Analysis of Treg-cell-specific gene expression
Unmethylated FOXP3-TSDR has been described as being required for stable expression of FOXP3.23 We analysed 5-Aza-dC- and EGCG-treated CD4+ CD25− T lymphocytes for mRNA expression of FOXP3. Additionally, we analysed gene expression of the Treg-cell-specific molecule GARP (LRRC32), which has been described as specific for activated human Treg cells24 and important Treg cytokines IL-10 and TGF-β. Expression of FOXP3 mRNA was significantly higher in 5-Aza-dC-cultured cells, which was threefold to fourfold higher after 4 days of culture and seven- to tenfold higher after 7 days of culture (Fig. 4). The EGCG-cultured cells did not show a substantial increase in FOXP3 expression.
Figure 4.
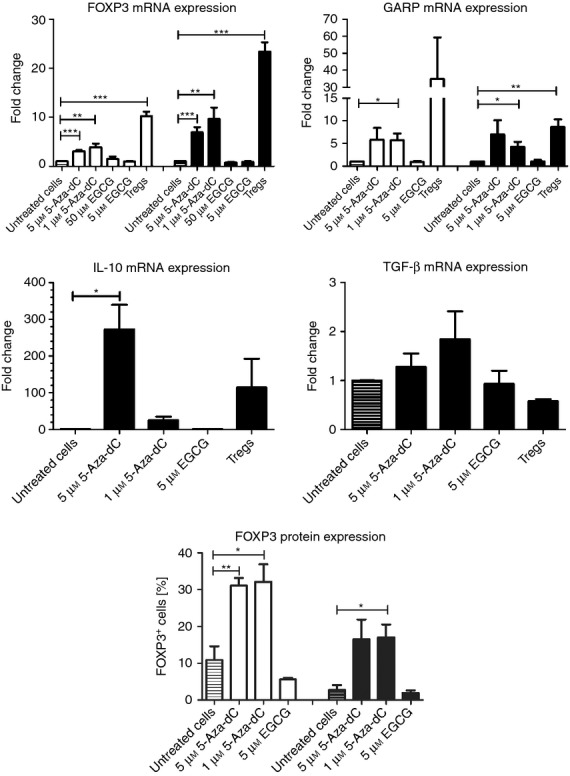
Expression analysis of regulatory T (Treg) -cell specific genes and FOXP3 protein expression. Expression of Treg-cell-specific genes and FOXP3 protein expression was analysed after four (white bars) and seven (black bars) days of stimulation with hypomethylating agents 5-aza-2′-deoxycytidine (5-Aza-dC) and epigallocatechin-3-gallate (EGCG.) *P < 0·05, **P < 0·01, ***P < 0·001.
5-Aza-dC treatment increased GARP mRNA expression sixfold to sevenfold (1 μm 5-Aza-dC P < 0·05), whereas EGCG did not have relevant effects on GARP expression. The IL-10 mRNA was strongly up-regulated by 5-Aza-dC (20-fold for 1 μm and 270-fold for 5 μm). Protein expression of FOXP3 was clearly up-regulated in 5-Aza-dC-treated cells after 4 and 7 days compared with EGCG and untreated T cells.
Besides hypomethylation of CD4+ CD25− T cells, incubation with 5-Aza-dC induces a Treg cell phenotype in these cells by strong expression of FOXP3 and GARP as well as of IL-10 and TGF-β. EGCG does not induce a Treg cell phenotype from CD4+ CD25− T cells.
Functional characterization
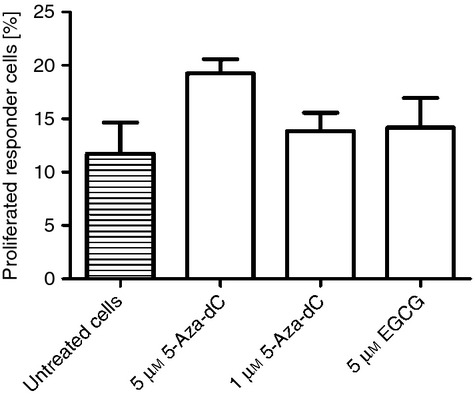
Reduced proliferative capacity and suppression of the function of CD4+ CD25− T effector cells represent characteristic features of Treg cells. Gaining a Treg-cell-specific phenotype with expression of Treg-cell-specific genes, we asked if 5-Aza-dC-induced cells show Treg-cell-specific function. Proliferative capacity and suppressive effect on responder cells was analysed after 4 days of cultivation with hypomethylating agents. Proliferation was lower in 5-Aza-dC-treated cells but not in 5 μm EGCG-treated cells measured after 3 days (Fig. 5). There was no suppressive effect by inhibiting T-cell proliferation of CD4+ CD25− responder T cells for both substances after 3 days of cultivation (Fig. 6).
Figure 5.
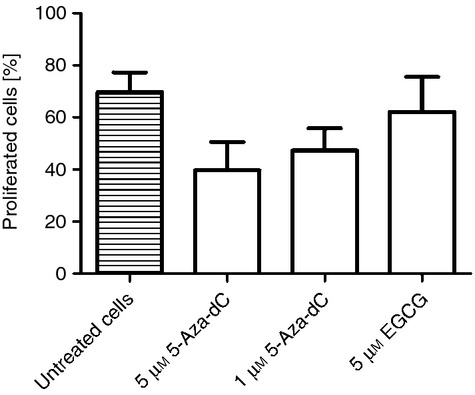
Proliferation of CD4+ CD25− T cells. 5-aza-2′-deoxycytidine (5-Aza-dC) and epigallocatechin-3-gallate (EGCG) treated CD4+ CD25− T cells were stained with eFluor670 proliferation dye, stimulated with anti-CD3 and dendritic cells, incubated for 72 hr and analysed by FACS.
Figure 6.
Suppression assay. 5-aza-2′-deoxycytidine (5-Aza-dC) and epigallocatechin-3-gallate (EGCG) stimulated CD4+ CD25− T cells were co-cultured with responder T cells (stained with eFluor670 proliferation dye) and dendritic cells in the presence of CD3 monoclonal antibody for 3 days and analysed by flow cytometry. Unstimulated CD4+ CD25− T cells co-cultured with responder T cells were used as control population. Degree of inhibition was determined by measuring proliferative capacity of cultured cells compared with the control population.
Gene expression of lineage specifying transcription factors of T helper cells types 1, 2 and 17 and Treg cells and their leading cytokines
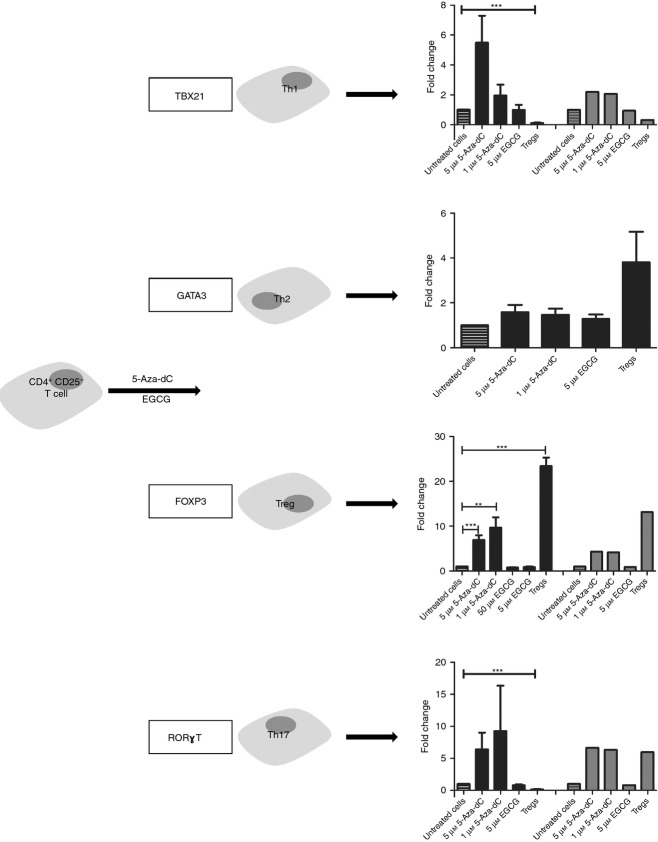
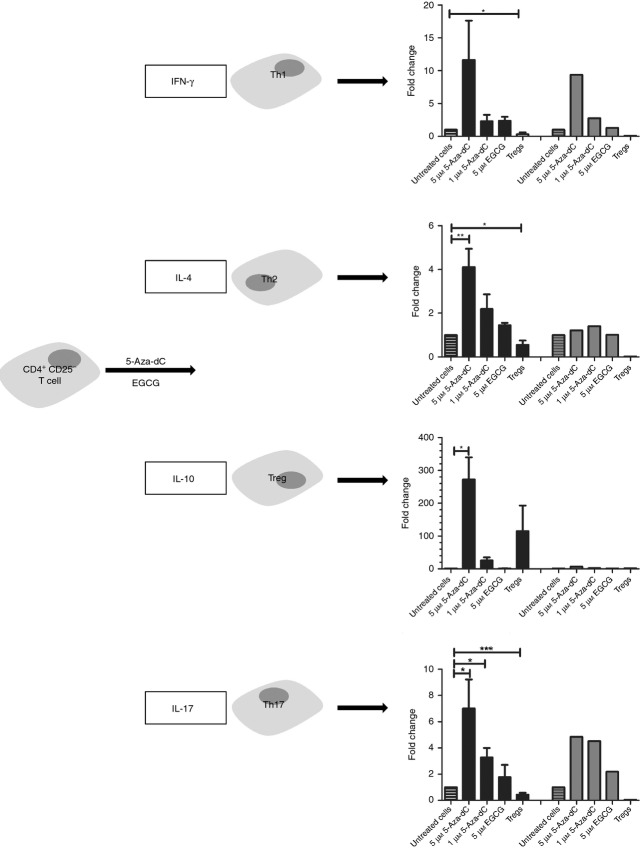
Apart from studying specific Treg cell molecules induced by 5-Aza-dC and EGCG, we analysed gene expression of lineage-specifying transcription factors of T helper type 1 (Th1), Th2 and Th17 cells in 5-Aza-dC-treated cells. None of the master transcription factors of these cell types was significantly differently expressed compared with untreated control cells, although mean expression of TBX21 and RORγT was higher after 5-Aza-dC treatment compared with untreated cells (Fig. 7). The leading cytokines of the different CD4+ T-cell subtypes are IFN-γ for Th1, IL-4 for Th2 and IL-17a for Th17 cells. The gene expression of the analysed cytokines is shown in Fig. 8. Interleukin-10, which is produced by Treg cells as well as by Th1 and Th2 cells, IL-4, produced by Th2 cells, and IL-17, expressed by Th17 cells, were significantly up-regulated. Interferon-γ was also more strongly expressed.
Figure 7.
Effects of demethylating agents on T cell lineage-specifying transcription factor gene expression. mRNA expression was quantified by real-time PCR (black bars) and gene-array analysis (grey bars) after stimulation with 5-aza-2′-deoxycytidine (5-Aza-dC) and epigallocatechin-3-gallate (EGCG) for 7 days. Array data did not include GATA3. **P < 0·01, ***P < 0·001.
Figure 8.
Effects of demethylating agents on leading cytokine expression. Expression was quantified by real-time PCR (black bars) and by mRNA expression by array analysis (grey bars) after stimulation of CD4+ CD25− T cells with 5-aza-2′-deoxycytidine (5-Aza-dC) and epigallocatechin-3-gallate (EGCG) for 7 days. *P < 0·05, **P < 0·01, ***P < 0·001.
Analysis of global Treg-cell-specific gene expression by microarray analysis
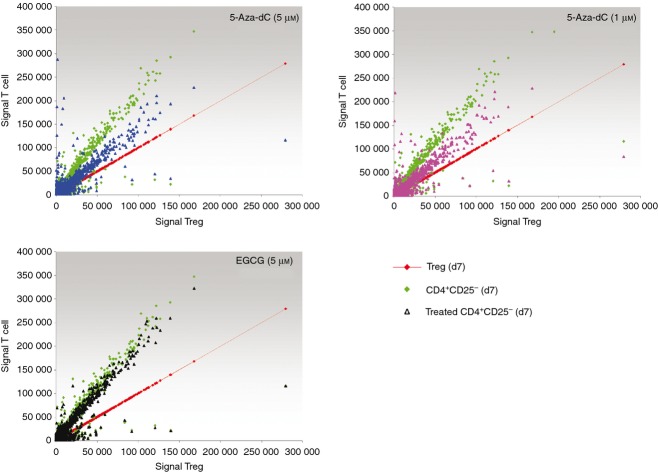
To obtain deeper insights into relevant gene expression changes induced by 5-Aza-dC and EGCG, we performed global transcriptome microarray analysis. We used freshly isolated CD4+ CD25− T and Treg cells, activated CD4+ CD25− T and Treg cells, and activated CD4+ CD25− T cells treated with either 5-Aza-dC at 1 μm or 5 μm and EGCG. Genes were excluded from further analysis if expression level was judged as ‘not detected’ by the software in all T-cell subsets analysed. Relevant regulated Treg-specific genes were defined by an at least twofold signal change between freshly isolated Treg and CD4+ CD25− T cells and/or activated Treg and CD4+ CD25− T cells. Analysis showed 10 745 differentially expressed genes. Compared with activated Treg cells as reference, global gene expression of Treg-cell-regulated genes of activated CD4+ CD25− T cells is clearly separated from that of Treg cells (Fig. 9). Expression of Treg-regulated genes in CD4+ CD25− T cells treated with 5-Aza-dC is between activated Treg and CD4+ CD25− T cells, indicating a partial switch from Th towards Treg cells. Gene expression of EGCG-treated CD4+ CD25− T cells overlaps for most genes compared with untreated activated CD4+ CD25− T cells.
Figure 9.
Effects of demethylating agents on expression profiling of regulatory T (Treg) -regulated genes. Gene expression microarray analysis of CD4+ CD25− T cells treated with either 5-aza-2′-deoxycytidine (5-Aza-dC) at a final concentration of 5 μm (5-Aza-DC (5 μm), blue triangle) or 1 μm [5-Aza-DC (1 μm), pink triangle] and epigallocatechin-3-gallate (EGCG) (5 μm), black triangle). Genes with at least twofold change of expression intensity between regulatory T cells and CD4+ CD25− T cells are considered. Gene expression intensity for Treg cell genes is shown on the x-axis, gene expression intensity of the comparative cell on y-axis. This results in a bisecting red line for Treg cells as comparative population. Green diamonds show the CD4+ CD25− T cells (CD4+ CD25−; d7), compared with Treg cells.
Discussion
The epigenetic status of FOXP3-TSDR is crucial for the stable expression of FOXP3, the lineage-specifying transcription factor of Treg cells.6,23 The FOXP3-TSDR is completely unmethylated in Treg cells with stable FOXP3 expression and suppressive function, whereas it is methylated in all other major blood cells, including non-regulatory T cells.7
We performed an in vitro study to evaluate the capability of demethylating agents to hypomethylate FOXP3-TSDR and transform CD4+ CD25− T cells into Treg cells. We used two different DNA methyltransferase inhibitors, 5-Aza-dC and EGCG. 5-Aza-dC is a derivative of 5-azacytidine. Although 5-Aza-dC is incorporated only into DNA, 5-azacytidine is also incorporated into tRNA,25 additionally inhibits tRNA methyltransferases and interferes with tRNA methylation and processing.26
In 5-Aza-dC-treated cells we found both FOXP3-TSDR hypomethylation and strong FOXP3 expression. Furthermore, LRRC32, encoding GARP, was strongly up-regulated upon treatment. GARP is a receptor for latent TGF-β and is specifically expressed in activated human Treg cells.24 In contrast to FOXP3, which is transiently also expressed by activated non-regulatory T cells, GARP has been described as a genuine marker of activated human Treg cells.27 Two further characteristic features of Treg cells, expression of the cytokine IL-10 and reduced proliferation, were also found in 5-Aza-dC-treated cells. However, we cannot exclude, that reduced proliferation is at least in part a consequence of the toxic effects of 5-Aza-dC. In summary, 5-Aza-dC-treated cells show FOXP3-TSDR hypomethylation, expression of Treg-cell-specific marker molecules and reduced proliferation rates, so resembling typical features of Treg cells.
On the other hand, 5-Aza-dC-treated cells did not suppress responder T cells, which is a crucial functional characteristic of Treg cells. This is in line with a report of Costantini et al.,16 who did not find a suppressive effect of 5-azacytidine-treated T cells on T effector cells.
The incomplete transformation into Treg cells is also indicated by increased expression of the Th1 and Th17 master transcription factor genes TBX21 and RORγt and their leading cytokines IFNγ and IL-17. TBX21 and IFNγ have been shown to exhibit DNA hypomethylation in Th1 cells, RORγt and IL17A in Th17 cells.28 As we showed that 5-Aza-dC induces global DNA hypomethylation within the genome, it is reasonable to assume, that the increased expression of these genes might be a result of 5-Aza-dC treatment. The incomplete transformation into Treg cells is also corroborated by only a partial switch from the Th-like global gene expression profile of Treg regulated genes towards the Treg-specific expression pattern, as determined by microarray analysis. In summary, 5-Aza-dC-treated human CD4+ CD25− T cells resemble Treg cells, but the incomplete Treg cell phenotype with increased expression of TBX21 and RORγt and lack of suppressive function do not justify classifying them as Treg cells.
EGCG, the second hypomethylating agent used for in vitro induction of Treg cells in this study, has been reported to up-regulate FOXP3 expression in CD4+ Jurkat T cells.21 We confirmed increased FOXP3 expression in Jurkat cells upon treatment (data not shown), but did not detect considerable expression of FOXP3 in EGCG-treated human CD4+ CD25− T cells. In our study, EGCG did not reduce FOXP3-TSDR methylation and failed to induce a Treg cell phenotype in human sorted CD4+ CD25− T cells as relevant expression of FOXP3, LRRC32 and IL-10 was not displayed and treated cells did not show suppressive function. In line with these results, EGCG obviously did not change Th-like global gene expression of Treg-regulated genes, as analysed by microarray. Although neither of the concentrations of EGCG used generated hypomethylation within FOXP3-TSDR, the toxic effect was much more pronounced compared with 5-Aza-dC. This suggests that EGCG does not qualify for induction of human Treg cells.
Neither 5-Aza-dC-treated nor EGCG-treated cells suppressed proliferation of responder cells, which also hinders consideration of 5-Aza-dC in vitro-generated cells for Treg cell therapy. There is concern that T cells that mimic Treg cells phenotypically, but that do not have stable suppressive functions, may dampen the protective effect of transferred cells or may have harmful effects with respect to graft-versus-host disease. Which cells to transfer and how many cells are needed for sufficient prevention of graft-versus-host disease, is unclear,29 but there is consensus, that Treg cells with stable suppressive function are needed. As FOXP3 is also expressed by non-regulatory T cells following T-cell activation, its sole expression does not assure suppressive function. An unmethylated FOXP3-TSDR is an even more specific feature of Treg cells with suppressive function.7 But as shown in this work, the in vitro hypomethylation of FOXP3-TSDR, as induced by 5-Aza-dC in CD4+ CD25− T cells, does not mediate suppressive function. However, most 5-Aza-dC-treated cells did not show completely unmethylated FOXP3-TSDR, as found in natural Treg cells. It is worth investigating if the Treg cells that expand in 5-azacytidine-treated patients with acute myeloid leukaemia are fully functional Treg cells or if they just mimic these cells without having suppressive function.
Although not all genes epigenetically regulated by DNA methylation are known so far, the differences of the DNA methylation status within lineage-specifying transcription factors and leading cytokines of different T-cell lineages implies that hypomethylating agents, inducing non-specific hypomethylation within the genome may affect the transcriptional activity of these genes. Recently, a targeted DNA demethylation of specific CpGs in human cells using fusions of engineered transcription activator-like effector repeat arrays and the TET1 hydroxylase catalytic domain has been reported.30 This method, applied to crucial genomic regions of Treg cells might be a more specific and promising approach for the in vitro generation of Treg cells.
Acknowledgments
RT, JK, RG and MZ performed the experiments, JK, JB and JS designed the study, JK, RT and MPK analysed the data, and JK and MZ wrote the paper.
We thank Peter Horn from the Institute of Transfusion Medicine of the University Hospital Essen for providing buffy coats. This work was supported in parts by grants from the Mercator-Stiftung.
Disclosures
None of the authors has any potential financial conflict of interest related to this manuscript.
References
- 1.Buckner JH. Mechanisms of impaired regulation by CD4+CD25+FOXP3+ regulatory T cells in human autoimmune diseases. Nat Rev Immunol. 2010;10:849–59. doi: 10.1038/nri2889. [DOI] [PMC free article] [PubMed] [Google Scholar]
- 2.Mielke S, Rezvani K, Savani BN, et al. Reconstitution of FOXP3+ regulatory T cells (Tregs) after CD25-depleted allotransplantation in elderly patients and association with acute graft-versus-host disease. Blood. 2007;110:1689–97. doi: 10.1182/blood-2007-03-079160. [DOI] [PMC free article] [PubMed] [Google Scholar]
- 3.Brunstein CG, Miller JS, Cao Q, et al. Infusion of ex vivo expanded T regulatory cells in adults transplanted with umbilical cord blood: safety profile and detection kinetics. Blood. 2011;117:1061–70. doi: 10.1182/blood-2010-07-293795. [DOI] [PMC free article] [PubMed] [Google Scholar]
- 4.Di Ianni M, Falzetti F, Carotti A, et al. Tregs prevent GVHD and promote immune reconstitution in HLA-haploidentical transplantation. Blood. 2011;117:3921–8. doi: 10.1182/blood-2010-10-311894. [DOI] [PubMed] [Google Scholar]
- 5.Prinz I, Koenecke C. Therapeutic potential of induced and natural FoxP3+ regulatory T cells for the treatment of Graft-versus-host disease. Arch Immunol Ther Exp (Warsz) 2012;60:183–90. doi: 10.1007/s00005-012-0172-3. [DOI] [PubMed] [Google Scholar]
- 6.Huehn J, Polansky JK, Hamann A. Epigenetic control of FOXP3 expression: the key to a stable regulatory T-cell lineage? Nat Rev Immunol. 2009;9:83–9. doi: 10.1038/nri2474. [DOI] [PubMed] [Google Scholar]
- 7.Baron U, Floess S, Wieczorek G, et al. DNA demethylation in the human FOXP3 locus discriminates regulatory T cells from activated FOXP3+ conventional T cells. Eur J Immunol. 2007;37:2378–89. doi: 10.1002/eji.200737594. [DOI] [PubMed] [Google Scholar]
- 8.Tran DQ, Ramsey H, Shevach EM. Induction of FOXP3 expression in naive human CD4+ FOXP3 T cells by T-cell receptor stimulation is transforming growth factor-β dependent but does not confer a regulatory phenotype. Blood. 2007;110:2983–90. doi: 10.1182/blood-2007-06-094656. [DOI] [PMC free article] [PubMed] [Google Scholar]
- 9.Floess S, Freyer J, Siewert C, et al. Epigenetic control of the foxp3 locus in regulatory T cells. PLoS Biol. 2007;5:e38. doi: 10.1371/journal.pbio.0050038. [DOI] [PMC free article] [PubMed] [Google Scholar]
- 10.Probst-Kepper M, Geffers R, Kroger A, et al. GARP: a key receptor controlling FOXP3 in human regulatory T cells. J Cell Mol Med. 2009;13:3343–57. doi: 10.1111/j.1582-4934.2009.00782.x. [DOI] [PMC free article] [PubMed] [Google Scholar]
- 11.Allan SE, Passerini L, Bacchetta R, et al. The role of 2 FOXP3 isoforms in the generation of human CD4+ Tregs. J Clin Invest. 2005;115:3276–84. doi: 10.1172/JCI24685. [DOI] [PMC free article] [PubMed] [Google Scholar]
- 12.Kehrmann J, Zeschnigk M, Buer J, Probst-Kepper M. FOXP3 expression in GARP-transduced helper T cells is not associated with FOXP3 TSDR demethylation. Transfus Med Hemother. 2011;38:287–91. doi: 10.1159/000331499. [DOI] [PMC free article] [PubMed] [Google Scholar]
- 13.Estey EH. Epigenetics in clinical practice: the examples of azacitidine and decitabine in myelodysplasia (MDS) and acute myeloid (AML) Leukemia. 2013;27:1803–12. doi: 10.1038/leu.2013.173. [DOI] [PubMed] [Google Scholar]
- 14.Goodyear OC, Dennis M, Jilani NY, et al. Azacitidine augments expansion of regulatory T cells after allogeneic stem cell transplantation in patients with acute myeloid leukemia (AML) Blood. 2012;119:3361–9. doi: 10.1182/blood-2011-09-377044. [DOI] [PubMed] [Google Scholar]
- 15.Schroeder T, Frobel J, Cadeddu RP, et al. Salvage therapy with azacitidine increases regulatory T cells in peripheral blood of patients with AML or MDS and early relapse after allogeneic blood stem cell transplantation. Leukemia. 2013;27:1910–3. doi: 10.1038/leu.2013.64. [DOI] [PubMed] [Google Scholar]
- 16.Costantini B, Kordasti SY, Kulasekararaj AG, et al. The effects of 5-azacytidine on the function and number of regulatory T cells and T-effectors in myelodysplastic syndrome. Haematologica. 2013;98:1196–205. doi: 10.3324/haematol.2012.074823. [DOI] [PMC free article] [PubMed] [Google Scholar]
- 17.Steinmann J, Buer J, Pietschmann T, Steinmann E. Anti-infective properties of epigallocatechin-3-gallate (EGCG), a component of green tea. Br J Pharmacol. 2013;168:1059–73. doi: 10.1111/bph.12009. [DOI] [PMC free article] [PubMed] [Google Scholar]
- 18.Wu D, Wang J, Pae M, Meydani SN. Green tea EGCG, T cells, and T cell-mediated autoimmune diseases. Mol Aspects Med. 2012;33:107–18. doi: 10.1016/j.mam.2011.10.001. [DOI] [PubMed] [Google Scholar]
- 19.Fang MZ, Wang Y, Ai N, Hou Z, Sun Y, Lu H, Welsh W, Yang CS. Tea polyphenol (-)-epigallocatechin-3-gallate inhibits DNA methyltransferase and reactivates methylation-silenced genes in cancer cell lines. Cancer Res. 2003;63:7563–70. [PubMed] [Google Scholar]
- 20.Lee WJ, Shim JY, Zhu BT. Mechanisms for the inhibition of DNA methyltransferases by tea catechins and bioflavonoids. Mol Pharmacol. 2005;68:1018–30. doi: 10.1124/mol.104.008367. [DOI] [PubMed] [Google Scholar]
- 21.Wong CP, Nguyen LP, Noh SK, Bray TM, Bruno RS, Ho E. Induction of regulatory T cells by green tea polyphenol EGCG. Immunol Lett. 2011;139:7–13. doi: 10.1016/j.imlet.2011.04.009. [DOI] [PMC free article] [PubMed] [Google Scholar]
- 22.Tatura R, Zeschnigk M, Adamzik M, Probst-Kepper M, Buer J, Kehrmann J. Quantification of regulatory T cells in septic patients by real-time PCR-based methylation assay and flow cytometry. PLoS One. 2012;7:e49962. doi: 10.1371/journal.pone.0049962. [DOI] [PMC free article] [PubMed] [Google Scholar]
- 23.Josefowicz SZ, Lu LF, Rudensky AY. Regulatory T cells: mechanisms of differentiation and function. Annu Rev Immunol. 2012;30:531–64. doi: 10.1146/annurev.immunol.25.022106.141623. [DOI] [PMC free article] [PubMed] [Google Scholar]
- 24.Stockis J, Colau D, Coulie PG, Lucas S. Membrane protein GARP is a receptor for latent TGF-β on the surface of activated human Treg. Eur J Immunol. 2009;39:3315–22. doi: 10.1002/eji.200939684. [DOI] [PubMed] [Google Scholar]
- 25.Christman JK. 5-Azacytidine 5-aza-2′-deoxycytidine as inhibitors of DNA methylation: mechanistic studies their implications for cancer therapy. Oncogene. 2002;21:5483–95. doi: 10.1038/sj.onc.1205699. [DOI] [PubMed] [Google Scholar]
- 26.Lee TT, Karon MR. Inhibition of protein synthesis in 5-azacytidine-treated HeLa cells. Biochem Pharmacol. 1976;25:1737–42. doi: 10.1016/0006-2952(76)90407-x. [DOI] [PubMed] [Google Scholar]
- 27.Battaglia M, Roncarolo MG. The Tregs' world according to GARP. Eur J Immunol. 2009;39:3296–300. doi: 10.1002/eji.200940117. [DOI] [PubMed] [Google Scholar]
- 28.Cohen CJ, Crome SQ, MacDonald KG, Dai EL, Mager DL, Levings MK. Human Th1 and Th17 cells exhibit epigenetic stability at signature cytokine and transcription factor loci. J Immunol. 2011;187:5615–26. doi: 10.4049/jimmunol.1101058. [DOI] [PubMed] [Google Scholar]
- 29.Tang Q, Lee K. Regulatory T-cell therapy for transplantation: how many cells do we need? Curr Opin Organ Transplant. 2012;17:349–54. doi: 10.1097/MOT.0b013e328355a992. [DOI] [PubMed] [Google Scholar]
- 30.Maeder ML, Angstman JF, Richardson ME, et al. Targeted DNA demethylation and activation of endogenous genes using programmable TALE-TET1 fusion proteins. Nat Biotechnol. 2013;31:1137–42. doi: 10.1038/nbt.2726. [DOI] [PMC free article] [PubMed] [Google Scholar]


