

Abstract
BACKGROUND AND PURPOSE
The testing of anticancer compounds in vitro is usually performed in hyperglycaemic cell cultures, although many tumours and their in vivo microenvironments are hypoglycaemic. Here, we have assessed, in cultures of tumour cells, the effects of reduced glucose levels on resistance to anticancer drugs and investigated the underlying cellular mechanisms.
EXPERIMENTAL APPROACH
PIK3CA mutant (AGS, HGC27), and wild-type (MKN45, NUGC4) gastric cancer cells were cultured in high-glucose (HG, 25 mM) or low-glucose (LG, 5 mM) media and tested for sensitivity to two cytotoxic compounds, 5-fluorouracil (5-FU) and carboplatin, the PI3K/mTOR inhibitor, PI103 and the mTOR inhibitor, Ku-0063794.
KEY RESULTS
All cells had increased resistance to 5-FU and carboplatin when cultured in LG compared with HG conditions despite having similar growth and cell cycle characteristics. On treatment with PI103 or Ku-0063794, only the PIK3CA mutant cells displayed increased resistance in LG conditions. The PIK3CA mutant LG cells had selectively increased p-mTOR, p-S6, p-4EBP1, GLUT1 and lactate production, and reduced reactive oxygen species, consistent with increased glycolysis. Combination analysis indicated PI103 and Ku-0063794 were synergistic in PIK3CA mutant LG cells only. Synergism was accompanied by reduced mTOR signalling and increased autophagy.
CONCLUSIONS AND IMPLICATIONS
Hypoglycaemia increased resistance to cytotoxic agents, especially in tumour cells with a high dependence on glycolysis. Dual inhibition of the PI3K/mTOR pathway may be able to attenuate such hypoglycaemia-associated resistance.
Keywords: chemoresistance, hypoglycaemia, metabolism, PI3K, glycolysis
Introduction
Chemoresistance can be manifested through many mechanisms, including the activation of survival, DNA repair and detoxification pathways, and increased drug efflux and reduced influx (Gottesman et al., 2002). Recently, a role for hypoglycaemia in promoting resistance to therapy has been suggested (Mentis and Kararizou, 2010; Griguer and Oliva, 2011; Suh et al., 2011), although the mechanisms of this effect remain to be clarified.
Under glucose deprivation, cells are believed to undergo numerous changes in order to conserve energy and ensure survival (Nakano and Takashima, 2012). The tumour suppressor kinase LKB1 is thought to be crucial to this process, as it activates AMP-activated PK (AMPK) in the presence of low ATP levels (Alexander and Walker, 2011). The activation of AMPK in turn inhibits mTOR signalling and protein translation for energy conservation (Jeon et al., 2012). Prolonged glucose deprivation also induces cellular stress, which triggers activation of survival pathways. Hypoglycaemia is also known to activate the glucose-regulated protein 78 (GRP78), a molecular chaperone in the endoplasmic reticulum, which confers cytoprotective effects from apoptosis (Fu and Lee, 2006). Stress also activates the unfolded protein response system that ultimately activates survival proteins such as the heat shock protein Hsp90 (Saito et al., 2009). Additionally, prolonged hypoglycaemic stress has been known to contribute to oncogenic mutation (Yun et al., 2009) and activate survival pathways, including the PI3K/AKT pathway (Roberts et al., 2011). Given these survival phenotypes, it is reasonable to hypothesize that low extracellular glucose levels could increase drug resistance.
Nonetheless, testing of drugs in vitro is usually carried out using cell cultures in media containing supraphysiological levels of glucose (commonly 25 mM), which would representing an extreme diabetic state (Li et al., 2005). Given the potential role of glucose metabolism in chemoresistance, the disparity in glucose levels between culture and tumour microenvironment could be a basis for observed differences in drug efficacy in vitro and in the clinic.
Gastric cancer (GC) is today one of the leading causes of cancer-related mortality worldwide (Fuchs and Mayer, 1995). Current treatment includes surgical resection of localized disease, and cytotoxic chemotherapy with 5-fluorouracil (5-FU) and platinum-based agents are often employed as first-line therapy (Berardi et al., 2004; Rivera et al., 2007). However, chemoresistance is a problem with GC as it is with other tumours. Recently, high throughput molecular analysis of gastric tumours has identified several molecular aberrations, for example, ErbB2 overexpression (5%) (Grabsch et al., 2010), KRAS amplification and mutation (9–15%) (Liu et al., 2009), and mutations in PIK3CA (gene encoding p110α catalytic subunit of PI3K) (10–15%) (Velho et al., 2005; Holbrook et al., 2011). This has led to the introduction of targeted agents such as trastuzumab for treatment of GC (Okines and Cunningham, 2010). Furthermore, as PIK3CA mutations lead to increased activation of the PI3K pathway and also have been associated with conferring dependence on PI3K signalling (Karakas et al., 2006), several PI3K/mTOR pathway inhibitors are also currently undergoing clinical evaluation (Courtney et al., 2010). In addition to genetic aberrations, metabolic aberrations have also been identified in GC. A seminal study by Hirayama et al. (2009) reported gastric tumours to be hypoglycaemic along with enhanced glycolysis and increased lactate production.
Given the hypoglycaemic nature of gastric tumours, the prevalence of PIK3CA mutations and the potential influence of glucose on drug efficacy, we undertook this study to test whether glucose levels can affect drug sensitivity of GC cells with an emphasis on PIK3CA mutations and PI3K/mTOR inhibitors, and to investigate the underlying mechanisms.
Methods
Cell lines and culture conditions
GC cells were obtained from American Type Culture Collection (Manassas, VA, USA) or Japanese Collection of Research Bioresources (Osaka, Japan). Cells were continuously cultured in DMEM with relevant glucose levels (25, 5 mM) and supplemented with 10% FBS (Invitrogen, Carlsbad, CA, USA), 50 000 U of penicillin and 50 mg of streptomycin (Sigma, St. Louis, MO, USA) at 37°C in a humidified atmosphere containing 5% CO2.
Drug sensitivity analysis
The dual inhibitor of PI3K and mTOR, PI103, and the mTOR inhibitor, Ku-0063794, were obtained from Cayman Chemicals (Ann Arbor, MI, USA) and BioVision (Milpitas, CA, USA) respectively. Carboplatin and 5-FU were obtained from Sigma. All stock solutions were prepared in DMSO (MP Biomedicals, Solon, OH, USA) at a final concentration in culture media of 0.25% (v/v). Cells in 90 μL medium were seeded (3000 cells per well) onto 96-well microtitre plates (Nunc, Rochester, NY, USA). After 24 h, 10 μL of medium containing compounds in graded concentrations ranging from 0.1 to 1000 μM was added to the wells. Control wells contained 20 μL of relevant solvent to achieve a final concentration of 0.25% of each solvent. The effect on cell numbers was assessed using the CellTiter 96® AQueous Non-Radioactive Cell Proliferation Assay (Promega, Madison, WI, USA) (MTS Assay) at 72 h post-treatment. The IC50 was calculated as the drug concentration that inhibited cell proliferation by 50% compared with vehicle controls as previously described (Bhattacharya et al., 2012). The drug and molecular target nomenclature used in this study follows Alexander et al. (2013a,b).
Drug combination analysis
The effect of combining compounds was evaluated using the median–effect equation and combination index (CI) method of Chou and Talalay (1984). The concentration–response curve of PI103 or Ku-0063794 was determined in the presence of a fixed low concentration of Ku-0063794 or PI103 (at a concentration that yielded fraction unaffected (fu) ≥ 0.9) respectively. For each level of fu, a CI was calculated as follows: CI = (D)1/(Df)1 + (D)2/(Df)2 + [(D)1(Df)2/(Df)1(Df)2], where (D)1 and (D)2 are the concentrations of the combination required to produce fu, and (Df)1 and (Df)2 are the concentrations of the individual drugs required to produce fu. Data giving linear regression coefficients (r2) of median–effect plots <0.95 were excluded. CI values of <1, 1 and >1 were considered to indicate synergy, additivity and antagonism respectively. CI values with the non-exclusive assumption have been reported.
Western immunoblotting
Cells were harvested and lysed in 1× denaturing lysis buffer (10 mM Tris-HCl (pH 7.5), 150 mM NaCl, 1 mM Na2 EDTA, 1 mM EGTA, 1% Triton, 2.5 mM sodium pyrophosphate, 1 mM β-glycerophosphate, 1 mM Na3VO4, 1 μg·mL−1 leupeptin) (Cell Signaling Technology, Beverly, MA, USA). Samples were then centrifuged at 1500× g for 10 min at 4°C and assayed for protein concentration using the BCA protein estimation kit (Pierce Biotechnology, Rockford, IL, USA). Equal amounts of protein (50 μg) were separated by electrophoresis through a 4–12% Tris-glycine gel (Invitrogen). Proteins were then transferred onto 0.45 μm nitrocellulose pore membranes and probed with antibodies. The antibodies used and their sources (in parentheses) are as follows: glucose transporter 1 (GLUT1) (Abcam, Cambridge, UK); monocarboxylate co-transporter 4 (MCT4; Millipore, Billerica, MA, USA); GAPDH (Millipore); p-AMPK (Thr172), AMPK, LCII, LC3B (Cell Signaling Technology); and HRP-conjugated secondary antibodies (GE Healthcare, Uppsala, Sweden).
elisa analysis
Levels of p-AKT (Ser473), p-mTOR (Ser2448), p-S6 (Ser235/236), p-4EBP1 (Thr37/46) and their respective total proteins were measured using PathScan® Sandwich elisa kits (Cell Signaling Technology) according to the manufacturer's instructions.
Lactate and reactive oxygen species (ROS) analysis
The levels of lactic acid in the culture medium were measured using the L-Lactate Colorimetric Assay Kit (Abcam) according to manufacturer's instructions. Levels of ROS in cells were detected fluorometrically using 2′,7′-dihydrodichlorofluorescein (H2-DCFDA; Life Technologies, Carlsbad, CA, USA). H2-DCFDA is a chemically reduced form of fluorescein which, upon cleavage by intracellular esterases and oxidation, is converted to the highly fluorescent 2′-7′-dichlorofluorescein. The fluorescence was measured at excitation and emission wavelengths of 488 and 525 nm respectively.
Apoptosis measurement
Apoptosis was measured using the Cell Death elisa® (Roche, Mannheim, Germany) kit. Cells were plated in 96-well plates (3000 cells per well) and on the following day treated with drug or solvent in a volume adjusted to 200 μL with 10% FCS/DMEM. After 24 h, nucleosomes were quantified according to the manufacturer's instructions.
siRNA treatment
Two independent Atg5 and control siRNA were obtained from both Cell Signaling Technology and OriGene (Rockville, MD, USA) respectively. Cells were transfected with siRNA at concentrations of 100 nM and exposed to a range of concentrations of PI103 or Ku0063794 24 h post-transfection. The effect on cell numbers was measured at 72 h post-transfection by the CellTiter 96® AQueous Non-Radioactive Cell Proliferation Assay (Promega).
Autophagy assessment
Autophagic cell morphology, indicated by the presence of vacuoles, was detected using phase contrast microscopy (Nikon, Melville, NY, USA) at 20× magnification with the cells attached to the culture flasks. Briefly, cells were either exposed to IC50 concentrations of PI103, Ku-0063794 or combination of PI103 at IC50 and Ku-0063794 at one-fifth IC50 or Ku-0063794 at IC50 and PI103 at one-fifth IC50 for 24 h. For detection of autophagy by LC3B protein assessment, cells were exposed to the above-mentioned conditions for 24 h. Following SDS-PAGE, membranes were probed with LCII and LC3B antibodies (Cell Signaling Technology).
Data analysis
Differences in IC50 values and elisa, lactate and ROS levels were assessed using a two-tailed, paired sample t-test. For apoptosis assays, one-way anova followed by Dunn's multiple comparison test was performed to compare for differences between control and treatment arms. A two-tailed, one-sample t-test was used to compare experimental CI at fu 0.5 values, with the predicted value for additivity of 1. All statistical analyses were performed using GraphPad Prism 4.00 software (GraphPad Software, Inc., San Diego, CA, USA). Statistical significance was considered when P < 0.05.
Results
Influence of glucose concentration on chemoresistance
Two PIK3CA mutant (AGS, PIK3CA E453K and HGC27, PIK3CA E452K) and two PIK3CA wild-type (MKN45 and NUGC4) GC cell lines (cancer.sanger.ac.uk/cell lines) were cultured in the presence of 25, 5 or 1 mM, or no glucose. Cell counting and MTS assay analysis up to 72 h was performed on all cell lines, and a similar growth pattern was observed between cells grown in 25 mM (designated high glucose, HG) and 5 mM (low glucose, LG) (Supporting Information Figure S1). Cells grown in 1 mM and 0 mM glucose had slower growth rates compared with those grown in 25 mM glucose and, hence, were not considered in further analysis. Cell cycle analysis revealed comparable cell cycle phase distributions between HG and LG cells (Supporting Information Figure S1).
HG and LG cells were compared for their sensitivity to 5-FU and carboplatin, the dual PI3K/mTOR inhibitor, PI103 and the mTOR inhibitor, Ku-0063794. For both cytotoxic agents, all LG cells displayed significant (P < 0.01) resistance (∼4–14-fold) to the drugs compared with HG cells (Figure 1). Increased resistance to PI103 (∼5–30-fold) and Ku-0063794 (∼11–21-fold) in LG was also observed, but only in the PIK3CA mutant AGS and HGC27 cells, indicating a class-specific effect for LG-associated chemoresistance.
Figure 1.
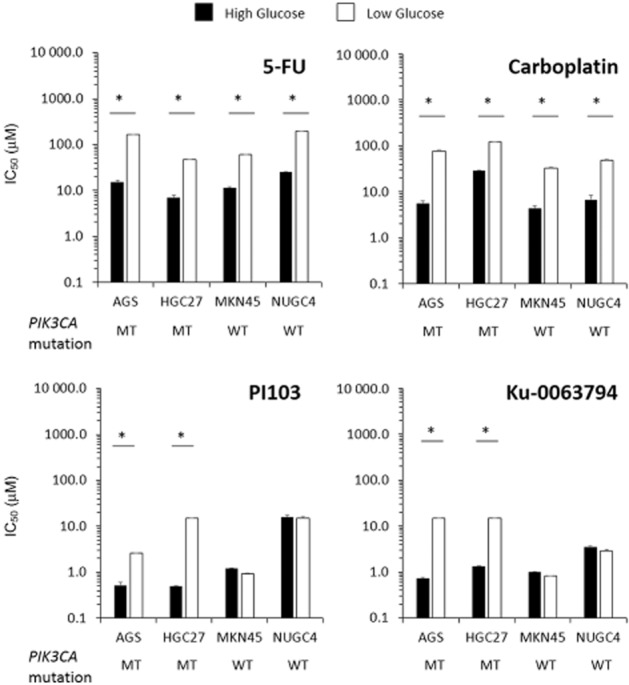
Effect of extracellular glucose concentrations on drug sensitivity. The IC50 values of treatment with 5-FU, carboplatin, PI103 and Ku-0063794 for 72 h on PIK3CA mutant (MT; AGS, HGC27) and wild-type (WT; MKN45, NUGC4) GC cells cultured in HG or LG are displayed. Data shown are the mean log IC50 values ± SD from five independent experiments. *P < 0.05.
Involvement of AMPK, mTOR and autophagy in chemoresistance
AMPK is a central metabolic sensor and is activated in response to energy perturbations (Chen et al., 2010; Jeon et al., 2012). Activation of AMPK inhibits high energy-consuming pathways such as mTOR, which in turn leads to induction of autophagy (Chen et al., 2010). In Western blot analysis, none of the LG cells demonstrated an increase in AMPK or LC3B2 (for autophagy) (Mizushima and Yoshimori, 2007) compared with HG cells (Figure 2A; densitometry analysis in Supporting Information Figure S2). Comparison of PI3K/mTOR pathway activation in LG and HG cells by elisa revealed no significant differences in Akt (Ser473) levels in all cell lines, or the phosphorylation levels of mTOR, S6 and 4EBP1 in PIK3CA wild-type MKN45 and NUGC4 cells (Figure 2B). In contrast, the phosphorylation levels of mTOR, S6 and 4EBP1 were significantly increased (P < 0.01) in PIK3CA mutant AGS and HGC27 cells.
Figure 2.
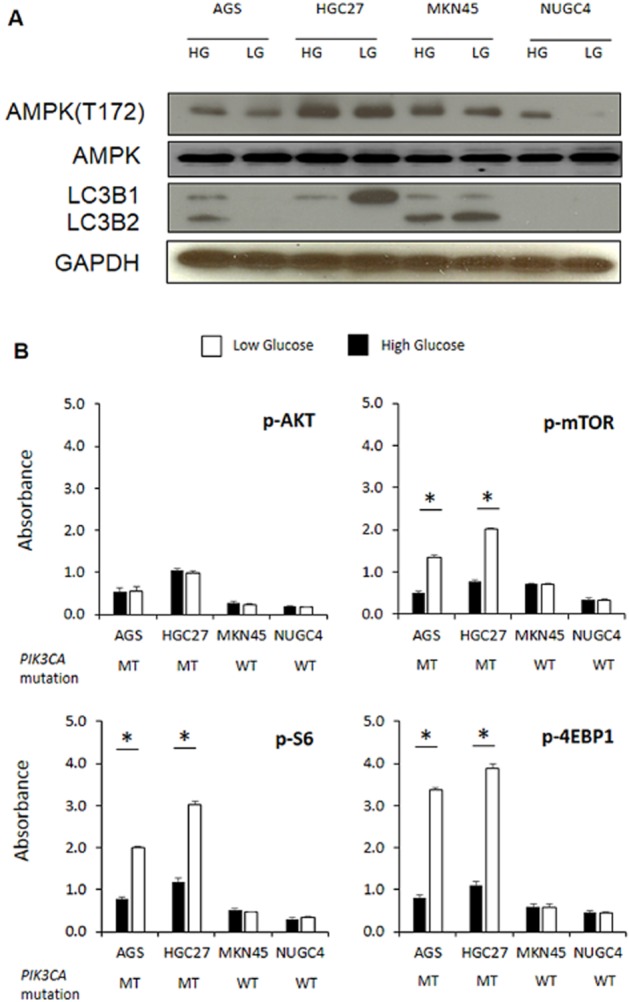
Effect of extracellular glucose concentrations on AMPK, autophagy and mTOR signalling. (A) Western blot analysis of phosphorylated AMPK, total AMPK, LC3B1 and LCB2 levels in PIK3CA mutant (MT; AGS, HGC27) and wild-type (WT; MKN45, NUGC4) GC cells cultured in HG or LG conditions for 24 h. Data shown are representative of three independent experiments. GAPDH was used as loading control. (B) Levels of p-AKT, p-mTOR, p-S6 and p-4EBP1 in PIK3CA mutant (MT; AGS, HGC27) and wild-type (WT; MKN45, NUGC4) GC cells cultured in HG or LG conditions at 24 h determined by elisa. Data shown are the mean (±SD) absorbance values of phosphorylated protein normalized to total protein from three independent experiments. *P < 0.05.
Involvement of glucose transport and glycolysis in chemoresistance
To compensate for lower extracellular glucose levels, many cells will enhance glucose uptake through the GLUT family of transporters (Evans et al., 2008). To investigate the involvement of glucose uptake in the observed LG-associated drug resistance, Western blot analysis was performed for GLUT1, a major isoform of GLUT reported to be overexpressed in cancer (Macheda et al., 2005; Airley and Mobasheri, 2007; Evans et al., 2008). GLUT1 was elevated in LG conditions, but only in the PIK3CA mutant AGS and HGC27 cell lines (Figure 3A).
Figure 3.
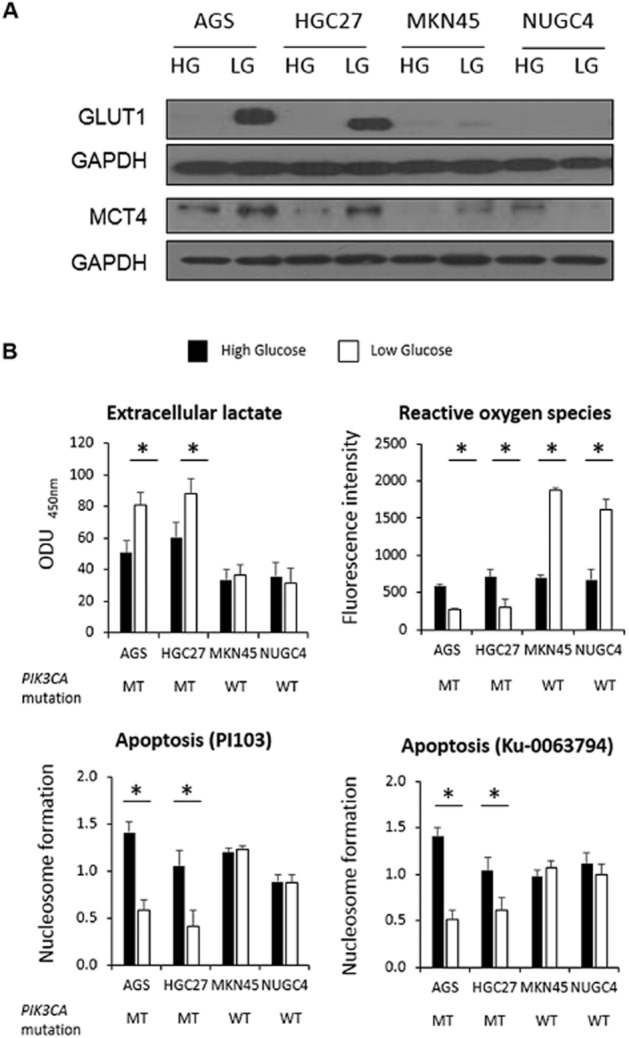
Effect of glucose concentrations on glucose transport, lactate production and apoptosis. (A) Western blot analysis of GLUT1 and MCT4 in PIK3CA mutant (MT; AGS, HGC27) and wild-type (WT; MKN45, NUGC4) GC cells cultured in HG or LG at 24 h. Data shown are representative of three independent experiments. GAPDH was used as loading control. (B) Levels of extracellular lactate (ODU, optical density units; cells without DMEM were used as a control), ROS and apoptosis after PI103 and Ku-0063794 treatment in PIK3CA mutant (MT; AGS, HGC27) and wild-type (WT; MKN45, NUGC4) GC cells cultured in HG or LG conditions for 24 h are displayed. Data shown are the mean (±SD) values from three independent experiments. *P < 0.05.
The selective increase of GLUT1 in LG conditions highlighted that the PIK3CA mutant cell lines may be more dependent on glucose, possibly due to a greater reliance on glycolysis for their energy requirements. The end product of glycolysis is lactate (Hirschhaeuser et al., 2011) and we therefore measured lactic acid in the culture medium of LG and HG cells to assess levels of glycolysis. In HG cells alone, PIK3CA mutant cells had increased lactate levels (P < 0.05) in their culture media compared with PIK3CA wild-type cells (Figure 3B), suggesting PIK3CA mutant cells were inherently more glycolytic in routine culture conditions. In comparing HG and LG cells, lactate levels were significantly higher in LG than HG cells for PIK3CA mutant but not wild-type cells. These results suggest that LG compared with HG conditions can further increase glycolysis in PIK3CA mutant cells beyond those seen in PIK3CA mutant compared with wild-type cells grown in HG conditions.
For confirmation, the levels of the transporter MCT4 were assessed. The MCT family of solute transporters facilitates efflux of monocarboxylates, for example, lactate, pyruvate and ketone bodies from within the cell (Halestrap and Meredith, 2004; Ganapathy et al., 2009). Efflux of lactate from cells is essential for maintaining optimal intracellular pH and therefore cellular survival and homeostasis. Western blotting analysis revealed higher levels of MCT4 in the PIK3CA mutant cells cultured in LG compared with HG conditions (Figure 3A). A reduction in MCT4 levels was observed in NUGC4 PIK3CA wild-type cells in LG conditions whereas, in MKN45 cells, no marked changes in MCT4 levels were observed.
Involvement of ROS and apoptosis in chemoresistance
With glycolysis and oxidative phosphorylation being alternative pathways to energy generation (Mentis and Kararizou, 2010), increased glycolysis may be expected to be accompanied by reduced oxidative phosphorylation. Oxidative phosphorylation generates ROS, which are also important intermediaries in apoptosis (Weinberg et al., 2010). Consistent with the increased glycolysis in the PIK3CA mutant cells in LG concentrations, intracellular ROS levels were also found to be significantly lower (P = 0.02) in these cells (Figure 3B). In contrast, the PIK3CA wild-type cells exhibited significantly higher levels (P = 0.03) of ROS when cultured in LG compared with HG conditions.
To evaluate the influence of glucose levels on drug-induced apoptosis, cells cultured in HG and LG were exposed to IC50 concentrations of PI103 or Ku-0063794 for 24 h and nucleosome formation was measured. Apoptosis was significantly lower (P < 0.05) in the PIK3CA mutant cells grown in LG compared with HG cells following exposure to the compounds (Figure 3B). In contrast, there were no significant differences in the levels of nucleosome formation in the PIK3CA wild-type cells.
Attenuation of chemoresistance by synergistic combination
The association of mTOR pathway activation with LG-associated drug resistance to PI103 and Ku-0063794 in PIK3CA mutant cells prompted us to test whether the resistance could be reduced by the combination of the drugs. The presence of a fixed non-growth inhibitory concentration (approximately one-fifth IC50) of either PI103 (AGS = 0.5 μM; HGC27 = 5 μM) or Ku-0063794 (5 μM for both cells) significantly reduced (P < 0.001) the IC50 of Ku-0063794 or PI103, respectively, in the PIK3CA mutant cells cultured in LG concentrations (Table 1). In contrast, no significant changes were observed with combination treatment in the same cells cultured in HG conditions, or the PIK3CA wild-type cells grown in LG or HG concentrations. CI analysis confirmed the synergy in the PIK3CA mutant cells cultured in LG conditions and additivity in all other cells.
Table 1.
CI of PI103 and Ku-0063794 in GC cells grown in LG and HG conditions
| Cell line | Glucose | Single-agent IC50 (μM) | IC50 (μM) in combination | CI at fu 0.5 | ||
|---|---|---|---|---|---|---|
| PI103 | Ku-0063794 | PI103 | Ku-0063794 | |||
| AGS | High | 0.52 ± 0.08 | 0.72 ± 0.05 | 0.68 ± 0.031 | 0.87 ± 0.031 | 1.1 ± 0.020 |
| Low | 2.57 ± 0.04 | 15.0 ± 2.91 | 0.05 ± 0.001* | 0.03 ± 0.003* | 0.03 ± 0.001** | |
| HGC27 | High | 0.49 ± 0.01 | 1.33 ± 0.03 | 0.38 ± 0.022 | 0.93 ± 0.022 | 0.97 ± 0.012 |
| Low | 15.0 ± 0.50 | 15.0 ± 4.82 | 0.02 ± 0.004* | 0.05 ± 0.004* | 0.01 ± 0.003** | |
| MKN45 | High | 1.21 ± 0.03 | 1.01 ± 0.02 | 1.01 ± 0.051 | 0.86 ± 0.067 | 0.93 ± 0.340 |
| Low | 0.92 ± 0.06 | 0.82 ± 0.01 | 0.87 ± 0.030 | 1.2 ± 0.052 | 1.0 ± 0.223 | |
| NUGC4 | High | 16.0 ± 1.30 | 3.51 ± 0.19 | 14.0 ± 3.913 | 13.0 ± 1.627 | 0.89 ± 0.320 |
| Low | 15.0 ± 2.12 | 2.93 ± 0.31 | 14.0 ± 5.321 | 16.0 ± 4.963 | 0.85 ± 0.671 | |
The IC50 values of PI103 and Ku-0063794 as single agents and in combination (in the presence of the other drug at fixed, non-growth inhibitory concentrations of one-fifth IC50) are indicated. CI values for fu at 0.5 (IC50) are also given. Additivity = 1, antagonism > 1, synergy < 1.
P < 0.05 for differences in IC50 values between LG and HG values.
P < 0.05 for differences from unity for CI values.
Mechanisms of synergy
No changes in the phosphorylation of AKT was observed in PIK3CA mutant cells cultured in LG conditions compared with HG after treatment with PI103 or Ku-0063794 either as single agent or in combination (Figure 4). However, PIK3CA mutant cells cultured in LG concentrations had a marked decrease in the phosphorylation levels of mTOR, S6 and particularly 4EBP1 (P < 0.05) following treatment with the combination of PI103 and Ku-0063794. In contrast, there were no significant differences observed post-treatment in the PIK3CA wild-type cells. Consistent with block of mTOR signalling in synergy and thereby reduced glycolysis, there was also a significant decrease in extracellular lactate production in the PIK3CA mutant cells cultured in LG concentrations. No significant changes in lactate production were observed in the PIK3CA wild-type cell lines.
Figure 4.
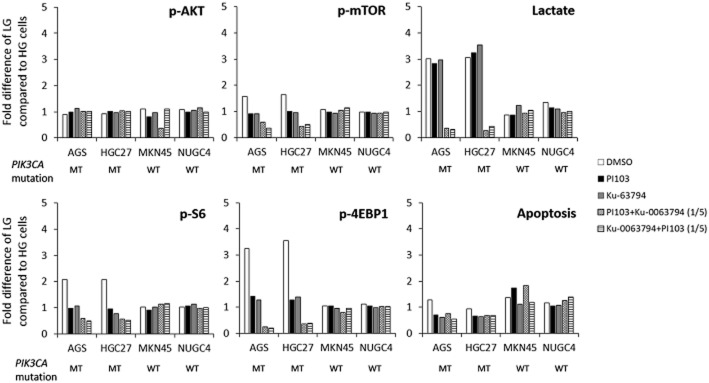
Effect of 24 h treatment with IC50 concentrations of DMSO, PI103, Ku-0063794, PI103 with one-fifth IC50 Ku-0063794 and Ku-0063794 with one-fifth IC50 PI103 on mTOR signalling (p-AKT, p-mTOR, p-S6, p-4EBP1; measured by elisa), extracellular lactate (measured by colorimetric assay) and apoptosis (measured by elisa) in PIK3CA mutant (MT; AGS, HGC27) and wild-type (WT; MKN45, NUGC4) GC cells. For analysis of protein expression, the mean (±SD) absorbance value of phosphorylated protein normalized to total protein was calculated. Data shown are the average fold difference (±SD) of values from cells cultured in LG compared with HG conditions, from three independent experiments.
Intriguingly, treatment with the combination compared with single agents did not increase apoptosis in the PIK3CA mutant cells. As inhibition of mTOR can also lead to activation of the autophagic pathway (Wong et al., 2013), we investigated the effect of the drug combination on this pathway. The combination led to an increase in autophagic vesicle formation in PIK3CA mutant cells cultured in LG concentrations (Figure 5), but not in cells co-exposed to 5 mM of 3-methyladenine, an inhibitor of autophagic vesicle formation (Supporting Information Figure S3). No morphological evidence of autophagy was visible in the same cells cultured in HG concentrations, or PIK3CA wild-type cells cultured in either LG or HG conditions. The synergistic increase in autophagy was further confirmed by a corresponding increase in LC3B2 levels (Supporting Information Figure S4).
Figure 5.

Phase contrast images of PIK3CA mutant (MT; AGS, HGC27) and wild-type (WT; MKN45, NUGC4) GC cells at 24 h post-exposure to the combination of PI103 at IC50 and Ku-0063794 at one-fifth IC50, and the combination of Ku-0063794 at IC50 and PI103 at one-fifth IC50. Images were captured at 20× magnification and are representative of two independent experiments.
Autophagosome formation involves the interaction of two key proteins, Atg12 and Atg5, forming an ubiquitin-like conjugation system (Mizushima et al., 1998). Repression of Atg5 has been demonstrated to lead to inhibition of autophagy (Yang et al., 2013). To confirm the involvement of autophagy in mediating combination synergy, the effect of silencing Atg5 using two independent siRNA was tested. The siRNA inhibited Atg5 protein and mRNA expression in all cell lines tested (Supporting Information Figure S5). In support of a role of autophagy in mediating combination synergy, silencing of Atg5 by siRNA in PIK3CA mutant cells grown in LG conditions not only abolished synergy but also led to strong antagonism (Table 2). In addition, silencing of Atg5 in the PIK3CA mutant cells in HG media led to combination synergy. The additive interaction between PI103 and Ku-0063794 in PIK3CA wild-type cells in HG or LG conditions remained unchanged following Atg5 siRNA treatment.
Table 2.
Effect of Atg5 siRNA on the CI of PI103 and Ku-0063794 in GC cells grown in LG and HG conditions
| Cell line | Glucose | CI at fu 0.5 | |
|---|---|---|---|
| Control siRNA | Atg5 siRNA | ||
| AGS | High | 0.98 ± 0.09 | 0.32 ± 0.01* |
| Low | 0.08 ± 0.003 | 3.8 ± 0.9* | |
| HGC27 | High | 1.1 ± 0.06 | 0.14 ± 0.06* |
| Low | 0.04 ± 0.002 | 4.6 ± 0.18* | |
| MKN45 | High | 0.98 ± 0.02 | 1.1 ± 0.05 |
| Low | 0.89 ± 0.04 | 0.93 ± 0.02 | |
| NUGC4 | High | 1.1 ± 0.28 | 0.99 ± 0.08 |
| Low | 1.4 ± 0.82 | 1.3 ± 0.11 | |
The CI values of PI103 and Ku-0063794 (in the presence of the other drug at fixed, non-growth inhibitory concentrations of one-fifth IC50) at fu 0.5 in the presence or absence of Atg5 siRNA are displayed. Additivity = 1, antagonism > 1, synergy < 1.
P < 0.05 for differences from unity for CI values.
Discussion and conclusions
In this study, we tested the hypothesis that extracellular glucose levels can influence drug sensitivity in cancer cells because of the activation of survival pathways in glucose-deprived conditions. An emphasis on the PI3K pathway was made because of the role of mTOR and other pathway components in glucose homeostasis (Elstrom et al., 2004; Sun et al., 2011). It has also been reported that PIK3CA mutant tumours have a high rate of glucose uptake and dependence on glycolysis (Cantley, 2012; Foster et al., 2012). GC cells were used because of the commonly hypoglycaemic state of gastric tumours (Hirayama et al., 2009). In support of the hypothesis, all four cell lines were more resistant to 5-FU and carboplatin when grown in LG compared with HG concentrations (Figure 1). Increased resistance in LG concentrations was also observed for the PI3K pathway inhibitors, but interestingly only in the PIK3CA mutant cells. This class specificity in drug sensitivity highlighted that the PI3K pathway may have a specific role in mediating LG-associated drug resistance.
In the investigation of mechanisms, no clear trends in AMPK and LCB3 levels between LG and HG cells were observed (Figure 2) suggesting that ATP abundance and autophagy may not be involved in the observed LG-associated chemoresistance. One explanation for this unexpected result is that the glucose levels under investigation in this study did not reach threshold levels for triggering AMPK activation and autophagy. Indeed, LG concentrations were represented in this study by the physiological concentration of 5 mM glucose instead of the pathologically hypoglycaemic 1 mM glucose or no glucose, as cells grown in the latter conditions exhibited retarded growth rates (Supporting Information Figure S1). Nonetheless, relative to the 25 mM glucose routinely used in culture medium, 5 mM glucose does still represent a hypoglycaemic environment. In this context, the results of this study therefore still supply evidence that modulating glucose levels can affect drug sensitivity and provide useful first insights into possible mechanisms.
Further investigation revealed GLUT1, p-mTOR, p-S6 and p-4EBP1 were all significantly elevated in PIK3CA mutant but not in wild-type cells grown in LG compared with HG concentrations. This pattern of elevated expression was consistent with the selective resistance of PIK3CA mutant LG cells to PI3K pathway inhibitors, suggesting increased glucose uptake and mTOR pathway signalling could be important mediators of LG-associated chemoresistance. GLUT1 has been shown to enhance mTOR activity independent of AMPK (Buller et al., 2011), and mTOR signalling can also increase translation of proteins including GLUT1 (Taha et al., 1999). Hence, the combined elevated expression of both GLUT1 and mTOR signalling in the presence of lower glucose levels is plausible.
The selective increase of GLUT1 in PIK3CA mutant LG cells led to the hypothesis that these cells selectively increased glucose uptake because they were more reliant on glycolysis for energy than the other cells. mTOR is a central regulator of glycolysis (Sun et al., 2011) and the elevated activity in PIK3CA mutant LG cells concurs with this hypothesis. Further support was provided by the increased lactate observed in PIK3CA mutant compared with wild-type HG cells, and the selective increase of lactate, increase of MCT4 and decrease in ROS in PIK3CA mutant LG compared with HG cells (Figure 3). Taken together, these results suggest that increased glycolysis could be a feature of cells likely to have increased drug resistance in LG conditions, at least to PI3K pathway inhibitors.
The selectivity of LG-associated PI3K pathway inhibitor resistance to PIK3CA mutation and mTOR pathway activation led to the hypothesis that combination treatment of PI103 and Ku-0063794 could be used to attenuate resistance. In support of the hypothesis, the combination was synergistic in PIK3CA mutant cells grown in LG conditions, but not in PIK3CA mutant cells grown in HG conditions, or wild-type cells grown in LG or HG conditions (Table 1). Moreover, consistent with the events observed in LG-associated resistance, the synergy was associated with reduced mTOR signalling, especially 4EBP1, and glycolysis (indicated by reduced lactate).
Interestingly, autophagy emerged as the more likely mode of cell death associated with the synergy (Figure 5), instead of apoptosis (Figure 4). The findings concur with the major role of mTOR in suppressing autophagy (Jung et al., 2010). They also are consistent with accumulating evidence of a common role for autophagy in mediating cell sensitivity to PI3K/mTOR inhibitors. Fujiwara et al. (2007) reported PI3K/Akt inhibition increased radiosensitivity by inducing autophagic cell death. The combination of BEZ235, the dual PI3K/mTOR inhibitor, with temsirolimus resulted in cell death due to autophagy (Yang et al., 2011). Inhibition of autophagy has also enhanced the effect of PI3K/mTOR inhibition in neurological tumours (Ghadimi et al., 2012) and lung cancer (Xu et al., 2011).
Taken together, the selective drug resistance, signalling events and combination synergy observed in this study could fit a model of ‘synthetic lethal addiction’ (Nijman, 2011) to PI3K/mTOR/4EBP1 pathway activation and glycolysis (Figure 6). It can be contended that PIK3CA wild-type cells do not depend significantly on PI3K/mTOR signalling for survival, hence are unaffected by single or dual inhibition of the PI3K/mTOR pathway. PIK3CA mutant cells in HG conditions may be more reliant on PI3K/mTOR pathway signalling and glycolysis, but lack the additional dependence on mTOR signalling generated by LG conditions. PIK3CA mutant cells in LG conditions, however, are evidently sufficiently dependent on mTOR signalling that synergy is achieved through dual inhibition of PI3K/mTOR signalling. Single PI3K/mTOR inhibition does not appear sufficient to reduce the hyper-activated mTOR signalling in this scenario. Finally, the loss of mTOR inhibition of autophagy following combination treatment could explain the reduced number of cells observed in synergy.
Figure 6.
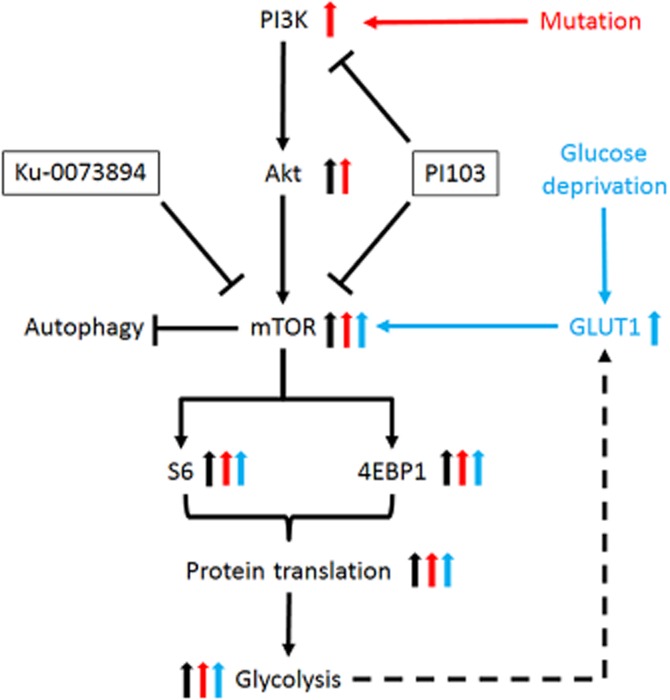
Model of ‘synthetic lethal addiction’ to rationalize selective synergy of PI103 and Ku-0063794 in PIK3CA mutant cells cultured in LG conditions. In PIK3CA wild-type cells, PI3K activates AKT, mTOR, S6, 4EBP1, protein translation and glycolysis (black arrows). In PIK3CA mutant cells, additional activation of AKT, mTOR, S6, 4EBP1, protein translation and glycolysis occurs (red arrows). Under glucose deprivation and in cells with enhanced glycolysis, GLUT1 levels are increased, leading to activation of mTOR signalling, protein translation and glycolysis (blue arrows). Synergy between PI103 and Ku-0063794 is observed only in PIK3CA mutant cells grown in LG conditions as these cells are dependent on hyperactivation of the PI3K/mTOR pathway. PIK3CA mutant cells cultured in HG conditions or PIK3CA wild-type cells in LG or HG conditions are less dependent on PI3K/mTOR activation, and hence the dual blockade of the PI3K/mTOR pathway is less detrimental. Autophagy occurs in cells with synergy due to the inhibition of mTOR.
The effect of hypoxia, another integral part of the microenvironment, on drug efficacy has not been addressed by this study. Recently, a symbiotic relationship between hypoxic cells and oxygenated tumour cells utilizing lactate transport has been shown to promote tumour growth and progression (Dhup et al., 2012). This could potentially influence drug activity. Furthermore, hypoxia also leads to the activation of glycolytic intermediates and survival pathways (Rohwer and Cramer, 2011), thus facilitating drug resistance. The study of the combined effect of hypoxia and hypoglycaemia on drug resistance would hence be an interesting topic for future investigation.
In summary, the results of this study have provided evidence that extracellular glucose levels can influence drug sensitivity. This influence can be class specific in the case of some drugs such as PI3K pathway inhibitors and could be linked to cellular dependence on glycolysis. This understanding could lead to new strategies to potentiate current drugs by manipulation of the metabolic microenvironment. It also raises questions about what can be learned from the results of current drug testing with routinely supraphysiological levels of glucose. In this study, investigations were directed towards the distinct feature of class-mediated LG-associated resistance; however, the increased resistance to cytotoxic agents observed in all cell lines grown in LG conditions remains of high interest. Class-specific effects in the levels of apoptosis and ROS generation were observed among the cell lines (Figure 3), suggesting other mechanisms may underlie the LG-associated resistance to cytotoxic compounds, such as 5-FU and platinum agents. In this context, it would be of interest to investigate whether common mechanisms of resistance to cytotoxic agents such as modulation of DNA repair, drug efflux, activation of survival pathways or other aspects of cellular bioenergetics are involved. Future investigation of glucose-dependent phenotypes in expanded panels of cell lines may help to further a better understanding of the complex interplay between microenvironment and pharmacology.
Acknowledgments
The authors thank Dr Alan Richardson (University of Keele, UK) and Professor Sue Eccles (The Institute of Cancer Research, UK) for helpful discussions.
Glossary
- 5-FU
5-fluorouracil
- CI
combination index
- fu
fraction unaffected
- GC
gastric cancer
- HG
high glucose
- LG
low glucose
- ROS
reactive oxygen species
Authors contributions
B. B. and R. S. conceived and coordinated the study and wrote the manuscript. B. B., S. H. H. L., C. S., N. K. M., K. X. K. and J. L. planned and executed the experimental work. M. B.-B. reviewed and provided scientific input to the manuscript.
Conflict of interest
Richie Soong is a recipient of research funding from Bayer Healthcare. No products from Bayer Healthcare were used or endorsed in this article.
Supporting information
Additional Supporting Information may be found in the online version of this article at the publisher's web-site:
http://dx.doi.org/10.1111/bph.12668
Figure S1 (A) Cell numbers and growth characteristics of PIK3CA mutant (MT; AGS, HGC27) and wild-type (WT; MKN45, NUGC4) GC cells cultured in 25 mM glucose (▪), 5 mM glucose (▴), 1 mM glucose (□) or no glucose (○) at the different time points indicated. (B) Baseline cell cycle phase distribution of GC cells cultured in HG, LG or no (NG) glucose at 24 h. Data shown are means of three independent experiments (±SD).
Figure S2 Expression of (A) pAMPK (white columns) and LC32B (black columns) and (B) GLUT1 (white columns) and MCT4 (black columns) in PIK3CA mutant (MT; AGS, HGC27) and wild-type (WT; MKN45, NUGC4) GC cells cultured in LG relative to HG conditions. All values are normalized to GAPDH using ImageJ software (National Institutes of Health, Bethesda, MD, USA).
Figure S3 Phase contrast pictures of AGS (top panels) and HGC27 (bottom panels) cells 24 h after treatment with DMSO (left panels), 5 mM 3-methyl adenine (middle panels) and the combination of Ku-0063794 at IC50 and PI103 at one-fifth IC50 (right panel). Images were captured at 20× magnification and are representative of two independent experiments.
Figure S4 Western blot analysis of LC3B in PIK3CA mutant (MT; AGS, HGC27) and wild-type (WT; MKN45, NUGC4) GC cells cultured in HG and LG conditions at 24 h post exposure to DMSO, PI103 (P), Ku-0063794 (K) and the combinations of PI103 at one-fifth IC50 and Ku-0063794 at IC50 (P/2+K) or Ku-0063794 at one-fifth IC50 and PI103 at IC50 (K/2+P). Data shown are representative of three independent experiments. GAPDH was used as loading control.
Figure S5 (A) Gene expression of PIK3CA mutant (MT; AGS, HGC27) and wild-type (WT; MKN45, NUGC4) GC cells treated with siRNA of Atg5 at 48 h determined by real-time PCR. Relative quantities were calculated using the ΔΔCt method with GAPDH as the reference gene and non-targeting siRNA controls as calibrators. (B) Western blot of Atg5 in PIK3CA mutant (AGS, HGC27) and wild-type (MKN45, NUGC4) GC cells cultured in HG and LG conditions at 48 h post-transfection to Atg5 siRNA or non-targeting control (NTC). GAPDH was used as a loading control.
References
- Airley RE, Mobasheri A. Hypoxic regulation of glucose transport, anaerobic metabolism and angiogenesis in cancer: novel pathways and targets for anticancer therapeutics. Chemotherapy. 2007;53:233–256. doi: 10.1159/000104457. [DOI] [PubMed] [Google Scholar]
- Alexander A, Walker CL. The role of LKB1 and AMPK in cellular responses to stress and damage. FEBS Lett. 2011;585:952–957. doi: 10.1016/j.febslet.2011.03.010. [DOI] [PubMed] [Google Scholar]
- Alexander SPH, Benson HE, Faccenda E, Pawson AJ, Sharman JL, Spedding M, et al. The Concise Guide to PHARMACOLOGY 2013/14: Transporters. British Journal of Pharmacology. 2013a;170:1706–1796. doi: 10.1111/bph.12450. [DOI] [PMC free article] [PubMed] [Google Scholar]
- Alexander SPH, Benson HE, Faccenda E, Pawson AJ, Sharman JL, Spedding M, et al. The Concise Guide to PHARMACOLOGY 2013/14: Enzymes. British Journal of Pharmacology. 2013b;170:1797–1867. doi: 10.1111/bph.12451. [DOI] [PMC free article] [PubMed] [Google Scholar]
- Berardi R, Scartozzi M, Romagnoli E, Antognoli S, Cascinu S. Gastric cancer treatment: a systematic review. Oncol Rep. 2004;11:911–916. [PubMed] [Google Scholar]
- Bhattacharya B, Akram M, Balasubramanian I, Tam KK, Koh KX, Yee MQ, et al. Pharmacologic synergy between dual phosphoinositide-3-kinase and mammalian target of rapamycin inhibition and 5-fluorouracil in PIK3CA mutant gastric cancer cells. Cancer Biol Ther. 2012;13:34–42. doi: 10.4161/cbt.13.1.18437. [DOI] [PubMed] [Google Scholar]
- Buller CL, Heilig CW, Brosius FC., 3rd GLUT1 enhances mTOR activity independently of TSC2 and AMPK. Am J Physiol Renal Physiol. 2011;301:F588–F596. doi: 10.1152/ajprenal.00472.2010. [DOI] [PMC free article] [PubMed] [Google Scholar]
- Cantley LC. PI 3-kinase and disease. BMC Proc. 2012;6(Suppl. 3):O2. [Google Scholar]
- Chen S, Rehman SK, Zhang W, Wen A, Yao L, Zhang J. Autophagy is a therapeutic target in anticancer drug resistance. Biochim Biophys Acta. 2010;1806:220–229. doi: 10.1016/j.bbcan.2010.07.003. [DOI] [PubMed] [Google Scholar]
- Chou TC, Talalay P. Quantitative analysis of dose–effect relationships: the combined effects of multiple drugs or enzyme inhibitors. Adv Enzyme Regul. 1984;22:27–55. doi: 10.1016/0065-2571(84)90007-4. [DOI] [PubMed] [Google Scholar]
- Courtney KD, Corcoran RB, Engelman JA. The PI3K pathway as drug target in human cancer. J Clin Oncol. 2010;28:1075–1083. doi: 10.1200/JCO.2009.25.3641. [DOI] [PMC free article] [PubMed] [Google Scholar]
- Dhup S, Dadhich RK, Porporato PE, Sonveaux P. Multiple biological activities of lactic acid in cancer: influences on tumor growth, angiogenesis and metastasis. Curr Pharm Des. 2012;18:1319–1330. doi: 10.2174/138161212799504902. [DOI] [PubMed] [Google Scholar]
- Elstrom RL, Bauer DE, Buzzai M, Karnauskas R, Harris MH, Plas DR, et al. Akt stimulates aerobic glycolysis in cancer cells. Cancer Res. 2004;64:3892–3899. doi: 10.1158/0008-5472.CAN-03-2904. [DOI] [PubMed] [Google Scholar]
- Evans A, Bates V, Troy H, Hewitt S, Holbeck S, Chung YL, et al. Glut-1 as a therapeutic target: increased chemoresistance and HIF-1-independent link with cell turnover is revealed through COMPARE analysis and metabolomic studies. Cancer Chemother Pharmacol. 2008;61:377–393. doi: 10.1007/s00280-007-0480-1. [DOI] [PubMed] [Google Scholar]
- Foster R, Griffin S, Grooby S, Feltell R, Christopherson C, Chang M, et al. Multiple metabolic alterations exist in mutant PI3K cancers, but only glucose is essential as a nutrient source. PLoS ONE. 2012;7:e45061. doi: 10.1371/journal.pone.0045061. [DOI] [PMC free article] [PubMed] [Google Scholar]
- Fu Y, Lee AS. Glucose regulated proteins in cancer progression, drug resistance and immunotherapy. Cancer Biol Ther. 2006;5:741–744. doi: 10.4161/cbt.5.7.2970. [DOI] [PubMed] [Google Scholar]
- Fuchs CS, Mayer RJ. Gastric carcinoma. N Engl J Med. 1995;333:32–41. doi: 10.1056/NEJM199507063330107. [DOI] [PubMed] [Google Scholar]
- Fujiwara K, Iwado E, Mills GB, Sawaya R, Kondo S, Kondo Y. Akt inhibitor shows anticancer and radiosensitizing effects in malignant glioma cells by inducing autophagy. Int J Oncol. 2007;31:753–760. [PubMed] [Google Scholar]
- Ganapathy V, Thangaraju M, Prasad PD. Nutrient transporters in cancer: relevance to Warburg hypothesis and beyond. Pharmacol Ther. 2009;121:29–40. doi: 10.1016/j.pharmthera.2008.09.005. [DOI] [PubMed] [Google Scholar]
- Ghadimi MP, Lopez G, Torres KE, Belousov R, Young ED, Liu J, et al. Targeting the PI3K/mTOR axis, alone and in combination with autophagy blockade, for the treatment of malignant peripheral nerve sheath tumors. Mol Cancer Ther. 2012;11:1758–1769. doi: 10.1158/1535-7163.MCT-12-0015. [DOI] [PMC free article] [PubMed] [Google Scholar]
- Gottesman MM, Fojo T, Bates SE. Multidrug resistance in cancer: role of ATP-dependent transporters. Nat Rev Cancer. 2002;2:48–58. doi: 10.1038/nrc706. [DOI] [PubMed] [Google Scholar]
- Grabsch H, Sivakumar S, Gray S, Gabbert HE, Muller W. HER2 expression in gastric cancer: rare, heterogeneous and of no prognostic value – conclusions from 924 cases of two independent series. Cell Oncol. 2010;32:57–65. doi: 10.3233/CLO-2009-0497. [DOI] [PMC free article] [PubMed] [Google Scholar]
- Griguer CE, Oliva CR. Bioenergetics pathways and therapeutic resistance in gliomas: emerging role of mitochondria. Curr Pharm Des. 2011;17:2421–2427. doi: 10.2174/138161211797249251. [DOI] [PubMed] [Google Scholar]
- Halestrap AP, Meredith D. The SLC16 gene family-from monocarboxylate transporters (MCTs) to aromatic amino acid transporters and beyond. Pflugers Arch. 2004;447:619–628. doi: 10.1007/s00424-003-1067-2. [DOI] [PubMed] [Google Scholar]
- Hirayama A, Kami K, Sugimoto M, Sugawara M, Toki N, Onozuka H, et al. Quantitative metabolome profiling of colon and stomach cancer microenvironment by capillary electrophoresis time-of-flight mass spectrometry. Cancer Res. 2009;69:4918–4925. doi: 10.1158/0008-5472.CAN-08-4806. [DOI] [PubMed] [Google Scholar]
- Hirschhaeuser F, Sattler UG, Mueller-Klieser W. Lactate: a metabolic key player in cancer. Cancer Res. 2011;71:6921–6925. doi: 10.1158/0008-5472.CAN-11-1457. [DOI] [PubMed] [Google Scholar]
- Holbrook JD, Parker JS, Gallagher KT, Halsey WS, Hughes AM, Weigman VJ, et al. Deep sequencing of gastric carcinoma reveals somatic mutations relevant to personalized medicine. J Transl Med. 2011;9:119. doi: 10.1186/1479-5876-9-119. [DOI] [PMC free article] [PubMed] [Google Scholar]
- Jeon SM, Chandel NS, Hay N. AMPK regulates NADPH homeostasis to promote tumour cell survival during energy stress. Nature. 2012;485:661–665. doi: 10.1038/nature11066. [DOI] [PMC free article] [PubMed] [Google Scholar]
- Jung CH, Ro SH, Cao J, Otto NM, Kim DH. mTOR regulation of autophagy. FEBS Lett. 2010;584:1287–1295. doi: 10.1016/j.febslet.2010.01.017. [DOI] [PMC free article] [PubMed] [Google Scholar]
- Karakas B, Bachman KE, Park BH. Mutation of the PIK3CA oncogene in human cancers. Br J Cancer. 2006;94:455–459. doi: 10.1038/sj.bjc.6602970. [DOI] [PMC free article] [PubMed] [Google Scholar]
- Li H, Telemaque S, Miller RE, Marsh JD. High glucose inhibits apoptosis induced by serum deprivation in vascular smooth muscle cells via upregulation of Bcl-2 and Bcl-xl. Diabetes. 2005;54:540–545. doi: 10.2337/diabetes.54.2.540. [DOI] [PubMed] [Google Scholar]
- Liu ZM, Liu LN, Li M, Zhang QP, Cheng SH, Lu S. Mutation detection of KRAS by high-resolution melting analysis in Chinese with gastric cancer. Oncol Rep. 2009;22:515–520. doi: 10.3892/or_00000465. [DOI] [PubMed] [Google Scholar]
- Macheda ML, Rogers S, Best JD. Molecular and cellular regulation of glucose transporter (GLUT) proteins in cancer. J Cell Physiol. 2005;202:654–662. doi: 10.1002/jcp.20166. [DOI] [PubMed] [Google Scholar]
- Mentis AF, Kararizou E. Metabolism and cancer: an up-to-date review of a mutual connection. Asian Pac J Cancer Prev. 2010;11:1437–1444. [PubMed] [Google Scholar]
- Mizushima N, Yoshimori T. How to interpret LC3 immunoblotting. Autophagy. 2007;3:542–545. doi: 10.4161/auto.4600. [DOI] [PubMed] [Google Scholar]
- Mizushima N, Noda T, Yoshimori T, Tanaka Y, Ishii T, George MD, et al. A protein conjugation system essential for autophagy. Nature. 1998;395:395–398. doi: 10.1038/26506. [DOI] [PubMed] [Google Scholar]
- Nakano A, Takashima S. LKB1 and AMP-activated protein kinase: regulators of cell polarity. Genes Cells. 2012;17:737–747. doi: 10.1111/j.1365-2443.2012.01629.x. [DOI] [PMC free article] [PubMed] [Google Scholar]
- Nijman SM. Synthetic lethality: general principles, utility and detection using genetic screens in human cells. FEBS Lett. 2011;585:1–6. doi: 10.1016/j.febslet.2010.11.024. [DOI] [PMC free article] [PubMed] [Google Scholar]
- Okines AF, Cunningham D. Trastuzumab in gastric cancer. Eur J Cancer. 2010;46:1949–1959. doi: 10.1016/j.ejca.2010.05.003. [DOI] [PubMed] [Google Scholar]
- Rivera F, Vega-Villegas ME, Lopez-Brea MF. Chemotherapy of advanced gastric cancer. Cancer Treat Rev. 2007;33:315–324. doi: 10.1016/j.ctrv.2007.01.004. [DOI] [PubMed] [Google Scholar]
- Roberts HR, Smartt HJ, Greenhough A, Moore AE, Williams AC, Paraskeva C. Colon tumour cells increase PGE(2) by regulating COX-2 and 15-PGDH to promote survival during the microenvironmental stress of glucose deprivation. Carcinogenesis. 2011;32:1741–1747. doi: 10.1093/carcin/bgr210. [DOI] [PubMed] [Google Scholar]
- Rohwer N, Cramer T. Hypoxia-mediated drug resistance: novel insights on the functional interaction of HIFs and cell death pathways. Drug Resist Updat. 2011;14:191–201. doi: 10.1016/j.drup.2011.03.001. [DOI] [PubMed] [Google Scholar]
- Saito S, Furuno A, Sakurai J, Sakamoto A, Park HR, Shin-Ya K, et al. Chemical genomics identifies the unfolded protein response as a target for selective cancer cell killing during glucose deprivation. Cancer Res. 2009;69:4225–4234. doi: 10.1158/0008-5472.CAN-08-2689. [DOI] [PubMed] [Google Scholar]
- Suh DH, Kim MK, No JH, Chung HH, Song YS. Metabolic approaches to overcoming chemoresistance in ovarian cancer. Ann N Y Acad Sci. 2011;1229:53–60. doi: 10.1111/j.1749-6632.2011.06095.x. [DOI] [PubMed] [Google Scholar]
- Sun Q, Chen X, Ma J, Peng H, Wang F, Zha X, et al. Mammalian target of rapamycin up-regulation of pyruvate kinase isoenzyme type M2 is critical for aerobic glycolysis and tumor growth. Proc Natl Acad Sci U S A. 2011;108:4129–4134. doi: 10.1073/pnas.1014769108. [DOI] [PMC free article] [PubMed] [Google Scholar]
- Taha C, Liu Z, Jin J, Al-Hasani H, Sonenberg N, Klip A. Opposite translational control of GLUT1 and GLUT4 glucose transporter mRNAs in response to insulin. Role of mammalian target of rapamycin, protein kinase b, and phosphatidylinositol 3-kinase in GLUT1 mRNA translation. J Biol Chem. 1999;274:33085–33091. doi: 10.1074/jbc.274.46.33085. [DOI] [PubMed] [Google Scholar]
- Velho S, Oliveira C, Ferreira A, Ferreira AC, Suriano G, Schwartz S, Jr, et al. The prevalence of PIK3CA mutations in gastric and colon cancer. Eur J Cancer. 2005;41:1649–1654. doi: 10.1016/j.ejca.2005.04.022. [DOI] [PubMed] [Google Scholar]
- Weinberg F, Hamanaka R, Wheaton WW, Weinberg S, Joseph J, Lopez M, et al. Mitochondrial metabolism and ROS generation are essential for Kras-mediated tumorigenicity. Proc Natl Acad Sci U S A. 2010;107:8788–8793. doi: 10.1073/pnas.1003428107. [DOI] [PMC free article] [PubMed] [Google Scholar]
- Wong PM, Puente C, Ganley IG, Jiang X. The ULK1 complex: sensing nutrient signals for autophagy activation. Autophagy. 2013;9:124–137. doi: 10.4161/auto.23323. [DOI] [PMC free article] [PubMed] [Google Scholar]
- Xu CX, Zhao L, Yue P, Fang G, Tao H, Owonikoko TK, et al. Augmentation of NVP-BEZ235's anticancer activity against human lung cancer cells by blockage of autophagy. Cancer Biol Ther. 2011;12:549–555. doi: 10.4161/cbt.12.6.16397. [DOI] [PMC free article] [PubMed] [Google Scholar]
- Yang S, Xiao X, Meng X, Leslie KK. A mechanism for synergy with combined mTOR and PI3 kinase inhibitors. PLoS ONE. 2011;6:e26343. doi: 10.1371/journal.pone.0026343. [DOI] [PMC free article] [PubMed] [Google Scholar]
- Yang YP, Hu LF, Zheng HF, Mao CJ, Hu WD, Xiong KP, et al. Application and interpretation of current autophagy inhibitors and activators. Acta Pharmacol Sin. 2013;34:625–635. doi: 10.1038/aps.2013.5. [DOI] [PMC free article] [PubMed] [Google Scholar]
- Yun J, Rago C, Cheong I, Pagliarini R, Angenendt P, Rajagopalan H, et al. Glucose deprivation contributes to the development of KRAS pathway mutations in tumor cells. Science. 2009;325:1555–1559. doi: 10.1126/science.1174229. [DOI] [PMC free article] [PubMed] [Google Scholar]
Associated Data
This section collects any data citations, data availability statements, or supplementary materials included in this article.
Supplementary Materials
Figure S1 (A) Cell numbers and growth characteristics of PIK3CA mutant (MT; AGS, HGC27) and wild-type (WT; MKN45, NUGC4) GC cells cultured in 25 mM glucose (▪), 5 mM glucose (▴), 1 mM glucose (□) or no glucose (○) at the different time points indicated. (B) Baseline cell cycle phase distribution of GC cells cultured in HG, LG or no (NG) glucose at 24 h. Data shown are means of three independent experiments (±SD).
Figure S2 Expression of (A) pAMPK (white columns) and LC32B (black columns) and (B) GLUT1 (white columns) and MCT4 (black columns) in PIK3CA mutant (MT; AGS, HGC27) and wild-type (WT; MKN45, NUGC4) GC cells cultured in LG relative to HG conditions. All values are normalized to GAPDH using ImageJ software (National Institutes of Health, Bethesda, MD, USA).
Figure S3 Phase contrast pictures of AGS (top panels) and HGC27 (bottom panels) cells 24 h after treatment with DMSO (left panels), 5 mM 3-methyl adenine (middle panels) and the combination of Ku-0063794 at IC50 and PI103 at one-fifth IC50 (right panel). Images were captured at 20× magnification and are representative of two independent experiments.
Figure S4 Western blot analysis of LC3B in PIK3CA mutant (MT; AGS, HGC27) and wild-type (WT; MKN45, NUGC4) GC cells cultured in HG and LG conditions at 24 h post exposure to DMSO, PI103 (P), Ku-0063794 (K) and the combinations of PI103 at one-fifth IC50 and Ku-0063794 at IC50 (P/2+K) or Ku-0063794 at one-fifth IC50 and PI103 at IC50 (K/2+P). Data shown are representative of three independent experiments. GAPDH was used as loading control.
Figure S5 (A) Gene expression of PIK3CA mutant (MT; AGS, HGC27) and wild-type (WT; MKN45, NUGC4) GC cells treated with siRNA of Atg5 at 48 h determined by real-time PCR. Relative quantities were calculated using the ΔΔCt method with GAPDH as the reference gene and non-targeting siRNA controls as calibrators. (B) Western blot of Atg5 in PIK3CA mutant (AGS, HGC27) and wild-type (MKN45, NUGC4) GC cells cultured in HG and LG conditions at 48 h post-transfection to Atg5 siRNA or non-targeting control (NTC). GAPDH was used as a loading control.