

Abstract
BACKGROUND AND PURPOSE
Anthocyanins are phytochemicals with reported vasoactive bioactivity. However, given their instability at neutral pH, they are presumed to undergo significant degradation and subsequent biotransformation. The aim of the present study was to establish the pharmacokinetics of the metabolites of cyanidin-3-glucoside (C3G), a widely consumed dietary phytochemical with potential cardioprotective properties.
EXPERIMENTAL APPROACH
A 500 mg oral bolus dose of 6,8,10,3′,5′-13C5-C3G was fed to eight healthy male participants, followed by a 48 h collection (0, 0.5, 1, 2, 4, 6, 24, 48 h) of blood, urine and faecal samples. Samples were analysed by HPLC-ESI-MS/MS with elimination kinetics established using non-compartmental pharmacokinetic modelling.
KEY RESULTS
Seventeen 13C-labelled compounds were identified in the serum, including 13C5-C3G, its degradation products, protocatechuic acid (PCA) and phloroglucinaldehyde (PGA), 13 metabolites of PCA and 1 metabolite derived from PGA. The maximal concentrations of the phenolic metabolites (Cmax) ranged from 10 to 2000 nM, between 2 and 30 h (tmax) post-consumption, with half-lives of elimination observed between 0.5 and 96 h. The major phenolic metabolites identified were hippuric acid and ferulic acid, which peaked in the serum at approximately 16 and 8 h respectively.
CONCLUSIONS AND IMPLICATIONS
Anthocyanins are metabolized to a structurally diverse range of metabolites that exhibit dynamic kinetic profiles. Understanding the elimination kinetics of these metabolites is key to the design of future studies examining their utility in dietary interventions or as therapeutics for disease risk reduction.
Keywords: anthocyanins, metabolites, hippuric acid, ferulic acid, vanillic acid
Introduction
Despite the growing evidence for the cardioprotective effects of dietary anthocyanins such as cyanidin-3-glucoside (C3G) (Erdman et al., 2007; Mink et al., 2007; Cassidy et al., 2011; 2013), the mechanisms involved remain poorly defined due to a limited understanding of their bioavailability and metabolism. Anthocyanins are reported to have low bioavailability, with the majority of studies recording a recovery of <1% of the ingested anthocyanin dose (Kay et al., 2005; Manach et al., 2005; McGhie and Walton, 2007). Several previous human feeding studies have explored the absorption, distribution, metabolism and elimination (ADME) of anthocyanins; however, most studies only reported conjugated derivatives [methyl, glucuronide (GlcA), sulfate] of parent anthocyanins as the major metabolites in the circulation post-consumption, with maximum serum concentrations ranging from 1.4 to 547 nM, between 0.5 and 1.5 h (tmax) post-consumption (Kay et al., 2004; Manach et al., 2005; McGhie and Walton, 2007).
A human study feeding blood orange juice suggested that the phenolic acid degradation product, protocatechuic acid (PCA), was a major metabolite of anthocyanins (Vitaglione et al., 2007). In addition, a range of phenolic acids, including vanillic acid (VA), syringic acid, caffeic acid and ferulic acid, have been identified within human serum, following the consumption of an anthocyanin-rich elderberry extract (de Ferrars et al., 2014) and bilberry-lingonberry puree (Nurmi et al., 2009). However, the complex flavonoid and phenolic profile of the interventions limited the ability to trace the metabolites back to their source. Furthermore, in vitro and human studies indicate that such phenolic acids undergo phase II conjugation (Nardini et al., 2006; 2009; Woodward et al., 2011), suggesting that anthocyanins can undergo extensive metabolism in vivo. Recent evidence also suggests that the major metabolites of anthocyanins are likely to be derived from bacterial fermentation and absorption from the colon (McGhie and Walton, 2007; Del Rio et al., 2010; Williamson and Clifford, 2010).
The extensive degradation and metabolism of anthocyanins was recently confirmed in our stable isotope-labelled C3G feeding study in which the relative bioavailability of C3G was established as 12.4 ± 1.4%, based on the recovery of the 13C-label in the urine and breath (Czank et al., 2013), suggesting that the extent of anthocyanin absorption and metabolism had been previously underestimated. Furthermore, given the degradation, short t½ and low Cmax of the parent anthocyanins, the observed cardiovascular benefits of anthocyanin consumption (Erdman et al., 2007; Mink et al., 2007; Cassidy et al., 2011; 2013) are probably the consequence of the metabolites, which are present within the circulation for significantly longer and at higher concentrations than the parent anthocyanins.
The present study aimed to identify the unique pharmacokinetic profiles of each anthocyanin metabolite following the consumption of a 500 mg oral bolus dose of 13C-labelled C3G. The findings from this work will inform the design of future clinical interventions and mechanistic studies exploring the biological activity of anthocyanins.
Methods
Chemicals and reagents
A 13C-enriched anthocyanin, 6,8,10,3′,5′-13C5-C3G (herein referred to as 13C5-C3G), containing 13C at three positions on the A-ring and two positions on the B-ring of the anthocyanin (Figure 1) was synthesized as previously described (Zhang et al., 2011). Unlabelled C3G and peonidin-3-glucoside (P3G) were obtained from Extrasynthese (Genay, France) as analytical standards. HPLC-grade acetonitrile was purchased from Fisher Scientific (Loughborough, UK). Phase II conjugates of phenolic acids [PCA-3-GlcA, PCA-4-GlcA, vanillic acid (VA)-4-GlcA, isoVA-3-GlcA, benzoic acid (BA)-4-GlcA, PCA-3-sulfate, PCA-4-sulfate, VA-4-sulfate and isoVA-3-sulfate] were synthesized at St Andrews University, as previously described (Zhang et al., 2012). Strata-X™ solid phase extraction (SPE) columns (6 mL, 500 mg), Kinetex pentafluorophenol (PFP) HPLC column (2.6 μM, 100 × 4.6 mm) and SecurityGuard® cartridges (PFP, 4.0 × 2.0 mm) were purchased from Phenomenex (Cheshire, UK). Bond Elute C18 (20 mL, 5 g) SPE columns were from Agilent (Workingham, UK), and Discovery® DSC-18 SPE columns (6 mL, 1 g), Acrodisc PTFE syringe filters (0.45 μm, 13 mm) and all other chemicals were purchased from Sigma-Aldrich (Dorset, UK).
Figure 1.
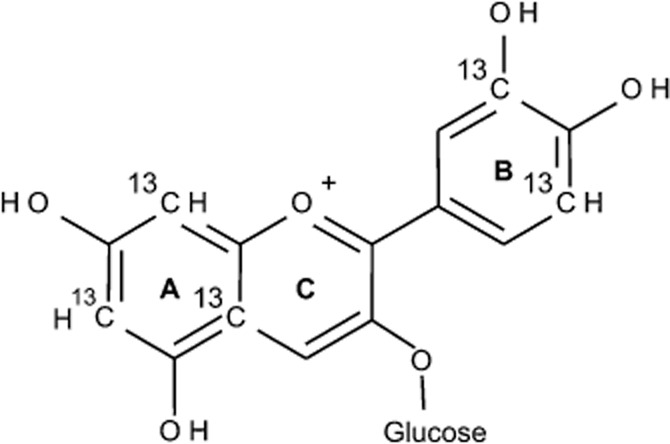
Structure of 6,8,10,3′,5′-13C5-cyanidin-3-glucoside.
Clinical design
A detailed description of the clinical design was previously published (Czank et al., 2013). Briefly, a single 500 mg oral bolus dose of isotopically labelled C3G (13C5-C3G) was fed to eight healthy male participants (body mass index, 18.5–30.5 kg·m–2; aged 18–45 years) after an overnight fast (>8 h). Participants provided blood (baseline, 0.5, 1, 2, 4, 6, 24, 48 h), urine (individual voids between 0 and 6 h, total voids between 6–24 and 24–48 h), breath (baseline, 0.5, 1, 2, 4, 6, 24, 48 h) and faecal samples (all voids between 0–6, 6–24 and 24–48 h). The study was conducted at the Clinical Research and Trials Unit at the University of East Anglia according to the principles expressed in the Declaration of Helsinki and was approved by the Cambridgeshire 3 Research Ethics Committee (REC ref: 10/H0306/42) and registered at clinicaltrials.gov as NCT01106729.
Sample extraction and analysis
Serum, urine and faecal samples were extracted by SPE and analysed by HPLC-ESI-MS/MS as recently described (Czank et al., 2013). The extraction efficiency was established as 87 ± 11% (coefficient of variation, CV; 6.8 ± 0.7%) for serum, 88 ± 18% (CV, 7.9 ± 0.8%) for urine and 81 ± 21% (CV, 14.1 ± 1.2%) for faeces (n = 3 replicates for each analyte). Sample extracts (5 μL) were injected onto a Kinetex PFP column (Phenomonex) and separated using an Agilent 1200 series HPLC with a QTrap 4000 linear ion trap mass spectrometer (ABSciex, Warrington, UK). The HPLC gradient consisted of 0.1% (v v−1) formic acid in water (A) and 0.1% (v v−1) formic acid in acetonitrile (B), with a flow rate of 1.5 mL·min−1 and gradient consisting of 1% B at 0 min, 7.5% B at 7 min, 7.6% B at 14 min, 10% B at 17 min, 12% B at 18.5 min, 12.5% B at 20 min, 30% B at 24 min and 90% B at 25 min. Metabolite identification was performed by multiple reaction monitoring (MRM) optimized for the detection of pure standards with m/z of the parent and daughter fragments adjusted to +2,+3,+5 amu to allow identification of the 13C-labelled metabolites derived from the B-ring, A-ring or the parent structure respectively. Metabolites were confirmed on the basis of retention time (using authentic and synthesized standards where possible) and three or more ion transitions. The HPLC-ESI-MS/MS method was validated for linearity and precision across all metabolites. Six point standard curves ranging from 1.25 to 20 μM were constructed from analytical standards and injected six times. The precision was established as 1.4–11.0% and linearity of the standard curves was established as r2 = 0.991–1.000 (CV, 0.2%) across the identified metabolites.
Pharmacokinetic and data analysis
Pharmacokinetic modelling of metabolites in the serum was performed with the PKSolver ‘add-on’ for Excel 2010 (Microsoft, Mountain View, CA, USA) (Zhang et al., 2010) using non-compartmental analysis with the AUC calculated using the trapezoidal rule. Pharmacokinetic parameters were established for each individual analyte and presented as mean ± SEM. Urine samples collected during the first 6 h post-bolus were grouped together to the nearest hour time point (i.e. samples were not pooled but individual concentrations were averaged post-quantification) for graphical representation and to calculate total cumulative recovery. The concentration of metabolites was converted to amount recovered from urine by accounting for the molecular weight of the individual 13C-labelled metabolites and the volume of the individual participants void and averaged across participants. Recovery of metabolites in the faeces was established from the molecular weight of the 13C-labelled metabolite and the weight of the individual participants void adjusting for faecal water content as previously described (Czank et al., 2013). Urine and faecal recovery amounts are presented as mean ± SEM (n = 8), unless otherwise stated.
Results
Metabolite identification
A total of 35 13C-labelled analytes (including the parent 13C5-C3G) were identified in the serum, urine and faecal samples collected over 48 h post-consumption. The metabolites identified included the degradation products of C3G [PCA and phloroglucinaldehyde (PGA)], phase I (dehydroxylation, reduction) and phase II (methyl, sulfate, glycine and glucuronyl) conjugates of C3G, PCA and PGA, and probable bacterial metabolites, including carboxylic, phenylacetic and phenylpropenoic acids. Of the 35 analytes identified, six metabolites (two isomers of cyanidin-glucuronide, methyl-cyanidin-glucuronide and three isomers of methyl-cyanidin-3-glucose-glucuronide; Table 1) were tentatively identified as having a neutral loss of 176 m/z (GlcA) while sharing common daughter ion transitions with C3G or P3G. The remaining 29 metabolites [C3G, P3G, PCA, PGA, hydroxybenzoic acid, BA-4-GlcA, PCA-3-GlcA, PCA-4-GlcA, PCA-3-sulfate, PCA-4-sulfate, VA, isoVA, VA-4-GlcA, isoVA-3-GlcA, VA-4-sulfate, isoVA-3-sulfate, 4-hydroxyphenylacetic acid, 3,4-dihydroxyphenylacetic acid, 4-hydroxybenzaldehyde (4-HBAL), 3,4-dihydroxybenzaldehyde, caffeic acid, ferulic acid (both A- and B-ring derived), hippuric acid, 4-methoxybenzaldehyde, 2-hydroxy-4-methoxybenzoic acid, methyl vanillate and methyl-3,4-dihydroxybenzoate (Table 1)] were confirmed by comparison of retention time and MS/MS fragmentation patterns to that of pure standards.
Table 1.
HPLC-MS/MS identification (MRM) of 13C-labelled cyanidin-3-glucoside (C3G) and its metabolites in the serum, urine and faeces of healthy volunteers (n = 8) after the consumption of 500 mg of 13C-labelled C3G
| Metabolite | Compound identification | Analytical standards | |||
|---|---|---|---|---|---|
| Rt (min) | MRM ion transitions (m/z)a | Location | # 13Cb | MS2 fragments (m/z) | |
| Parent anthocyanins | |||||
| Cyanidin-3-glucoside (C3G) | 12.6 | 454/292, 246, 218, 133 | Urine, serum, faeces | +5 | 449/287, 241, 213, 128 |
| Cyanidin-glucuronide | 11.7 | 468/292 | Urine | +5 | NA |
| Cyanidin-glucuronide | 16.5 | 468/292 | Urine | +5 | NA |
| Peonidin-3-glucoside | 16.6 | 468/306 | Urine | +5 | 463/301 |
| Methyl-cyanidin-glucuronide | 16.7 | 482/306 | Urine | +5 | NA |
| Methyl-C3G-glucuronide | 5.7 | 644/306 | Urine | +5 | NA |
| Methyl-C3G-glucuronide | 8.0 | 644/306 | Urine | +5 | NA |
| Methyl-C3G-glucuronide | 9.6 | 644/306 | Urine | +5 | NA |
| Degradants | |||||
| Protocatechuic acid (PCA) | 4.3 | 155/111, 93, 83 | Urine, serum, faeces | +2 | 153/109, 91, 81 |
| Phloroglucinaldehyde | 7.4 | 156/155, 128, 110, 86 | Urine, serum, faeces | +3 | 153/151, 125, 107, 83 |
| Metabolites | |||||
| 3-Hydroxybenzoic acid | 8.1 | 138/95, 67 | Urine, faeces | +2 | 136/93, 65 |
| 4-Hydroxybenzoic acid | 6.5 | 138/95, 67 | Urine, faeces | +2 | 136/93, 65 |
| Benzoic acid-4-glucuronide | 3.0 | 317/175, 155, 113, 95 | Urine, serum, faeces | +2 | 315/175, 153, 113, 93 |
| PCA-3-glucuronide | 4.3 | 331/175, 155, 113, 111 | Urine, serum, faeces | +2 | 329/175, 153, 113, 109 |
| PCA-4-glucuronide | 3.3 | 331/175, 155, 113, 111 | Urine, serum, faeces | +2 | 329/175, 153, 113, 109 |
| PCA-3-sulfate | 6.5 | 235/191, 155, 111 | Urine, serum, faeces | +2 | 233/189, 153, 109, 97 |
| PCA-4-sulfate | 6.2 | 235/191, 155, 111 | Urine, serum, faeces | +2 | 233/189, 153, 109, 97 |
| Vanillic acid (VA) | 9.5 | 169/154, 125, 110 | Urine, serum, faeces | +2 | 167/152, 123,108 |
| IsoVA | 9.9 | 171/153, 127, 95 | Urine, serum, faeces | +2 | 169/151, 125, 93, 65 |
| IsoVA-3-glucuronide | 6.2 | 347/175, 171, 154, 113 | Urine, serum, faeces | +2 | 345/175, 169, 152, 113 |
| VA-4-glucuronide | 4.9 | 347/175, 171, 154, 113 | Urine, serum, faeces | +2 | 345/175, 169, 152, 113 |
| IsoVA-3-sulfate | 8.8 | 247/169, 154, 125, 110 | Urine, serum, faeces | +2 | 245/167, 152, 123, 108 |
| VA-4-sulfate | 8.6 | 247/169, 154, 125, 110 | Urine, serum, faeces | +2 | 245/167, 152, 123, 108 |
| 4-Hydroxyphenylacetic acid | 6.8 | 154/125, 109, 95 | Urine, faeces | +2 | 152/123, 107, 93, 79 |
| 3,4-Dihydroxyphenylacetic acid | 4.6 | 171/127, 111, 97 | Urine, faeces | +2 | 169/125, 109, 95 |
| 4-Hydroxybenzaldehyde | 8.5 | 123/110, 94, 67 | Urine, serum, faeces | +2 | 121/108, 92, 65 |
| 3,4-Dihydroxybenzaldehyde | 5.8 | 139/110, 94, 83 | Urine, faeces | +2 | 137/109, 92, 81 |
| Caffeic acid | 10.4 | 183/139, 110, 93 | Faeces | +2 | 181/137, 108, 91 |
| Ferulic acid | 18.8 | 195/180, 150, 136 | Urine, serum, faeces | +2 | 193/178, 148, 134 |
| 196/181, 151, 137 | Urine, serum, faeces | +3 | |||
| Hippuric acid | 6.3 | 179/136, 134, 79 | Urine, serum, faeces | +2 | 177/134 ,132, 77 |
| 4-Methoxybenzaldehyde | 19.6 | 169/125, 110, 81 | Faeces | +2 | 167/123, 108, 79 |
| 2-Hydroxy-4-methoxybenzoic acid | 20.1 | 155/94, 79, 65 | Faeces | +2 | 153/92,77, 63 |
| 156/95, 80, 66 | Urine | +3 | |||
| Methyl vanillate | 21.4 | 185/153, 125, 109 | Faeces | +2 | 183/151, 123, 107, 77 |
| Methyl-3,4-dihydroxybenzoate | 12.9 | 170/111, 93 | Urine, serum, faeces | +2 | 168/109, 91 |
Mass spectra fragments for 13C-labelled metabolites with +2, +3 and +5 m/z.
+2, +3 and +5 m/z refer to metabolites derived from PCA, PGA and cyanidin respectively.
NA, no analytical standard available for confirmation.
Serum pharmacokinetics
In the serum sample, a total of 17 13C-labelled compounds, comprising C3G, PCA, PGA, 13 derivatives of PCA and 1 derivative of PGA, were detected (Table 2; Figures 2 and 3). The Cmax of the analytes ranged from 11 nM for PCA-3-GlcA (Figure 2B) to 1962 nM for hippuric acid (Figure 3A), with tmax between 1.8 h for C3G and 30.1 h for VA-sulfate (Table 2). Elimination half-lives (t½) also ranged from 0.4 h for C3G to 96.5 ± 73.4 h for the A-ring-derived ferulic acid (Table 2). PCA-3-GlcA was the least abundant metabolite present in the serum, whereas hippuric acid was the most abundant metabolite (Table 2).
Table 2.
Serum pharmacokinetic profiles of cyanidin-3-glucoside (C3G), its degradation products and derived metabolites in humans after the consumption of 500 mg 13C-labelled C3Ga
| Metabolite | nb | Cmax (nM) | tmax (h) | t1/2 (h) | AUC0-48 (nmol h L−1) |
|---|---|---|---|---|---|
| Parent anthocyanins | |||||
| Cyanidin-3-glucoside | 5 | 141 ± 70 | 1.8 ± 0.2 | 0.4 | 279 ± 170 |
| Degradants | |||||
| Protocatechuic acid (PCA) | 8 | 146 ± 74 | 3.3 ± 0.7 | 9.9 ± 3.4 | 1377 ± 760 |
| Phloroglucinaldehyde | 4 | 582 ± 536 | 2.8 ± 1.1 | NQ | 7882 ± 7768 |
| Protocatechuic acid derived | |||||
| Benzoic acid-4-glucuronide | 7 | 74 ± 20 | 10.9 ± 3.4 | 17.1 ± 3.0 | 1467 ± 489 |
| Methyl-3,4-dihydroxybenzoate | 8 | 12 ± 5 | 8.4 ± 5.7 | 21.6 ± 5.9 | 171 ± 70 |
| PCA-3-glucuronide | 5 | 11 ± 3 | 2.7 ± 1.0 | 18.0 ± 15.6 | 60 ± 38 |
| PCA-4-glucuronide | 8 | 68 ± 61 | 3.8 ± 0.8 | 19.4 ± 3.1 | 618 ± 489 |
| PCA-sulfatesc | 8 | 157 ± 116 | 11.4 ± 3.8 | 31.9 ± 19.1 | 1180 ± 349 |
| Vanillic acid (VA) | 2 | 1845 ± 838 | 12.5 ± 11.5 | 6.4 | 23 319 ± 20 650 |
| IsoVA | 1 | 195 | 2.0 | NQ | 189 |
| VA-4-glucuronide | 8 | 24 ± 4 | 4.8 ± 0.4 | NQ | 74 ± 11 |
| IsoVA-3-glucuronide | 8 | 35 ± 5 | 4.3 ± 0.6 | 1.6 ± 0.2 | 103 ± 13 |
| VA-sulfatesc | 4 | 430 ± 299 | 30.1 ± 11.4 | NQ | 10 689 ± 7751 |
| 4-Hydroxybenzaldehyde | 7 | 667 ± 653 | 5.6 ± 3.1 | 17.9 ± 8.8 | 663 ± 505 |
| Ferulic acid | 7 | 827 ± 371 | 8.2 ± 4.1 | 21.4 ± 7.8 | 17 422 ± 11 054 |
| Hippuric acid | 8 | 1962 ± 1389 | 15.7 ± 4.1 | 95.6 ± 77.8 | 46 568 ± 30 311 |
| Phloroglucinaldehyde derived | |||||
| Ferulic acidd | 6 | 87 ± 38 | 13.3 ± 7.9 | 96.5 ± 73.4 | 1816 ± 1054 |
Values are expressed as mean ± SEM.
Metabolite detected in n = number of participants.
PCA-sulfate and VA-sulfate isomers could not be separated sufficiently by HPLC to allow individual quantitation and the values presented are cumulative concentration of both isomers.
Alternative isomers of ferulic acid include 2-hydroxy-4-methoxycinnamic acid or 4-hydroxy-2-methoxycinnamic acid.
NQ, not quantifiable as compounds remained sufficiently above baseline at 48 h.
Figure 2.
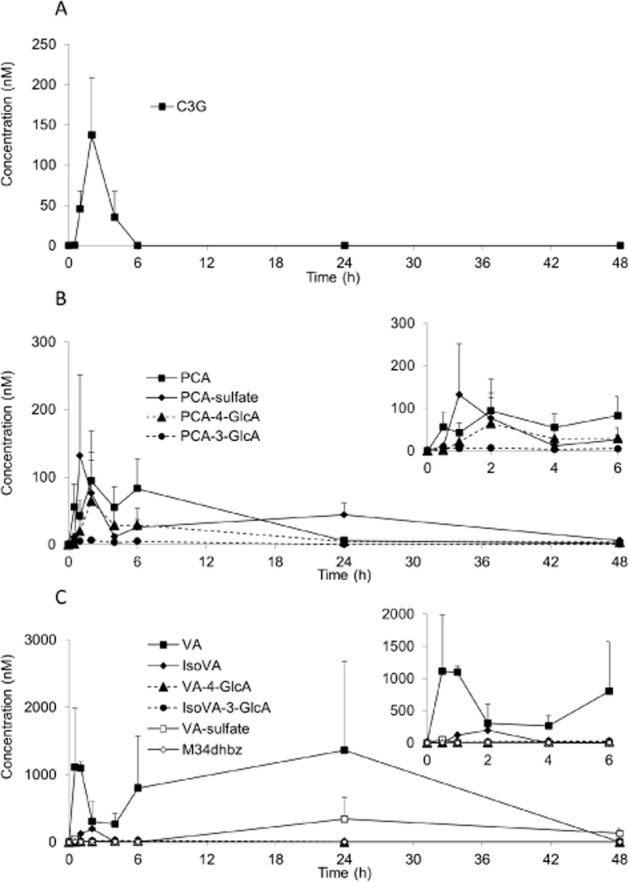
Serum pharmacokinetic profiles of (A) C3G, (B) PCA and its metabolites and (C) methylated PCA and its metabolites, in humans after the consumption of 500 mg 13C5-C3G in eight healthy male participants. All data are mean ± SEM. C3G, cyanidin-3-glucoside; GlcA, glucuronide; M34dhbz, methyl-3,4-dihydroxybenzoate; PCA, protocatechuic acid; VA, vanillic acid.
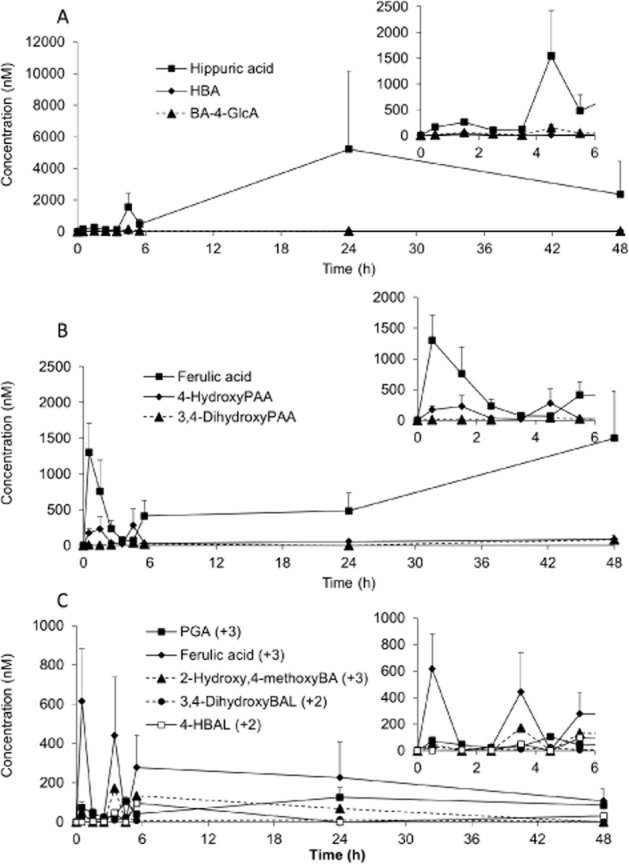
Figure 3.
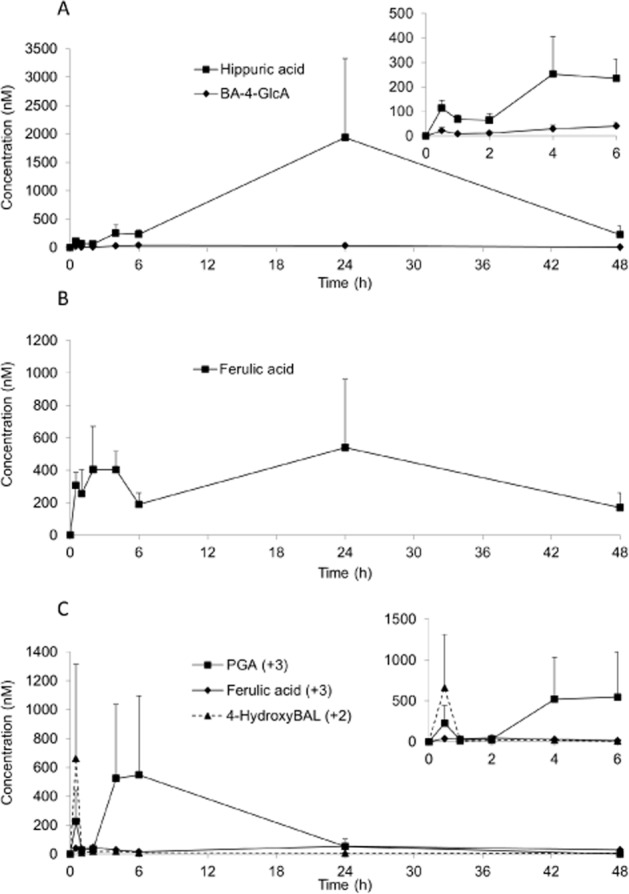
Serum pharmacokinetic profiles of (A) benzoic acid metabolites, (B) propenoic acid metabolites, and (C) A-ring-derived and aldehyde metabolites of cyanidin-3-glucoside in humans after the consumption of 500 mg 13C5-C3G in eight healthy male participants. All data are mean ± SEM. BA, benzoic acid; BAL, benzaldehyde; GlcA, glucuronide; PGA, phloroglucinaldehyde.
C3G reached a maximum serum concentration of 141 nM (Figure 2A), whereas its degradation products, PCA and PGA, were present at 146 nM (Figure 2B) and 582 nM (Figure 3C), respectively, with their tmax occurring 2–3 h later than that of C3G (Table 2). The metabolites of PCA were the dominant species detected in the serum, with hippuric acid, VA and the B-ring-derived ferulic acid representing the most abundant metabolites. Hippuric acid, PCA-sulfate and ferulic acid had significantly longer elimination half-lives than PCA (Table 2). Eight sulfated and glucuronidated forms of PCA and methylated PCA (VA) were identified within the serum (Figure 2B,C), with the conjugations occurring at both the meta and the para positions. Of these, VA-sulfate was present in the highest concentration followed by PCA-4-GlcA and PCA-sulfate (Table 2). In contrast, only PGA and one other A-ring-derived metabolite were identified within the serum, namely ferulic acid (Figure 3C; Table 2).
Urinary elimination
In the urine sample, 31 13C-labelled compounds were identified, comprising C3G, 7 methylated and glucuronidated conjugates of C3G and cyanidin (Cy), PCA, PGA, 19 derivatives of PCA, and 2 derivatives of PGA (Table 3; Figures 4 and 5). Maximum concentrations of C3G and its conjugated derivatives were identified between 1 and 2 h post-consumption (Figure 4A). PCA also reached maximum concentration at 1–2 h (Figure 4B), whereas PGA reached its peak concentration in the urine considerably later (6–24 h) (Figure 5C; Table 3). The phenolic metabolites were excreted in much higher concentrations than the parent anthocyanins, ranging from 24 nM for 3,4-dihydroxybenzaldehyde (Figure 5C) to 5417 nM for hippuric acid (Figure 5A), with peak excretions observed between 6 and 24 h post-consumption (Table 3).
Table 3.
Urinary recovery of cyanidin-3-glucoside, its degradation products and derived metabolites in humans after the consumption of 500 mg 13C-labelled C3Ga
| Metabolite | nb | Maximum concentration (nM) | Time at maximum concentration (h)c | Total recovery (μg) |
|---|---|---|---|---|
| Parent anthocyanin | ||||
| Cyanidin-3-glucoside (C3G) | 7 | 334 ± 145 | 1–2 | 120.0 ± 54.1 |
| Cyanidin-glucuronided | 5 | 88 ± 42 | 1–2 | 23.9 ± 11.3 |
| Cyanidin-glucuronided | 3 | 19 ± 7 | 1–2 | 12.2 ± 6.8 |
| Peonidin-3-glucoside | 7 | 76 ± 43 | 1–2 | 22.9 ± 10.6 |
| Methyl-cyanidin-glucuronidee | 5 | 206 ± 105 | 1–2 | 74.9 ± 36.0 |
| Methyl-C3G-glucuronidee | 4 | 6 ± 2 | 1–2 | 2.3 ± 1.1 |
| Methyl-C3G-glucuronidee | 4 | 14 ± 7 | 1–2 | 6.7 ± 3.7 |
| Methyl-C3G-glucuronidee | 5 | 20 ± 8 | 1–2 | 9.5 ± 5.5 |
| Degradants | ||||
| Protocatechuic acid (PCA) | 8 | 337 ± 117 | 1–2 | 71.6 ± 20.9 |
| Phloroglucinaldehyde | 8 | 170 ± 42 | 6–24 | 66.7 ± 21.3 |
| Protocatechuic acid derived | ||||
| Hydroxybenzoic acidf | 5 | 49 ± 11 | 1–2 | 13.2 ± 3.7 |
| Vanillic acid (VA) | 4 | 3412 ± 312 | 1–2 | 960.4 ± 350.0 |
| IsoVA | 4 | 212 ± 130 | 1–2 | 79.5 ± 54.2 |
| Methyl-3,4-dihydroxybenzoate | 8 | 108 ± 39 | 3–4 | 20.7 ± 8.0 |
| Benzoic acid-4-glucuronide | 7 | 129 ± 47 | 4–5 | 53.1 ± 18.1 |
| PCA-3-glucuronide | 8 | 301 ± 72 | 1–2 | 197.7 ± 41.2 |
| PCA-4-glucuronide | 8 | 233 ± 65 | 1–2 | 100.3 ± 30.2 |
| PCA-3-sulfate | 8 | 1112 ± 318 | 1–2 | 322.0 ± 87.3 |
| PCA-4-sulfate | 8 | 1244 ± 333 | 1–2 | 492.4 ± 193.0 |
| VA-4-glucuronide | 8 | 762 ± 124 | 4–5 | 618.4 ± 109.7 |
| IsoVA-3-glucuronide | 8 | 699 ± 90 | 5–6 | 526.8 ± 92.2 |
| VA-4-sulfate | 7 | 1682 ± 899 | 3–4 | 449.1 ± 112.4 |
| IsoVA-3-sulfate | 5 | 822 ± 557 | 3–4 | 183.2 ± 93.1 |
| Hippuric acid | 8 | 5417 ± 4906 | 6–24 | 2415.6 ± 2223.0 |
| Ferulic acid | 8 | 1839 ± 657 | 24–48 | 798.2 ± 295.7 |
| 4-Hydroxyphenylacetic acid | 3 | 391 ± 113 | 4–5 | 50.0 ± 2.0 |
| 3,4-Dihydroxyphenylacetic acid | 1 | 82 | 24–48 | 28.0 |
| 4-Hydroxybenzaldehyde | 2 | 97 ± 94 | 5–6 | 10.0 ± 9.0 |
| 3,4-Dihydroxybenzaldehyde | 6 | 24 ± 7 | 0–1 | 6.3 ± 2.6 |
| Phloroglucinaldehyde derived | ||||
| Ferulic acidg | 8 | 474 ± 273 | 0–1 | 225.1 ± 175.3 |
| 2-Hydroxy-4-methoxybenzoic acid | 1 | 172 | 3–4 | 64.6 |
Values are expressed as mean ± SEM.
Metabolites detected in n = number of participants.
Samples were pooled across participants urine voids, for t = 0–1 h (n = 3), t = 1–2 h (n = 5), t = 2–3 h (n = 6), t = 3–4 h (n = 6), t = 4–5 h (n = 4), t = 5–6 h (n = 8), t = 6–24 h (n = 8) and t = 24–48 h (n = 8).
Quantified relative to C3G.
Quantified relative to peonidin-3-glucoside.
Includes both isomers (3-hydroxybenzoic acid and 4-hydroxybenzoic acid).
Alternative isomers of ferulic acid include 2-hydroxy-4-methoxycinnamic acid or 4-hydroxy-2-methoxycinnamic acid.
Figure 4.
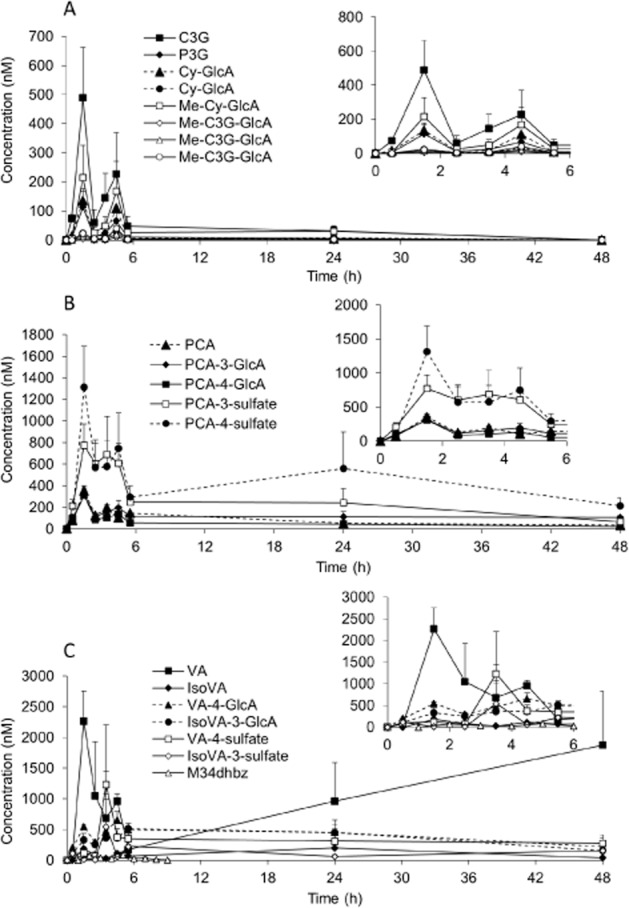
Urinary elimination profiles of (A) C3G and its metabolites, (B) PCA and its metabolites, and (C) methylated PCA and its metabolites in humans after the consumption of 500 mg 13C5-C3G in eight healthy male participants. All data are mean ± SEM. C3G, cyanidin-3-glucoside; Cy, cyanidin; GlcA, glucuronide; M34dhbz, methyl-3,4-dihydroxybenzoate; Me, methylated; P3G, peonidin-3-glucoside; PCA, protocatechuic acid; VA, vanillic acid.
Figure 5.
Urinary elimination profiles of (A) benzoic acid metabolites, (B) propenoic acid metabolites, and (C) A-ring-derived and aldehyde metabolites of cyanidin-3-glucoside in humans after the consumption of 500 mg 13C5-C3G in eight healthy male participants. All data are mean ± SEM. 4-HBAL, 4-hydroxybenzaldehyde; BA, benzoic acid; BAL, benzaldehyde; GlcA, glucuronide; PAA, phenylacetic acid; PGA, phloroglucinaldehyde.
Recovery of faecal metabolites
A total of 28 13C-labelled compounds were detected in the faeces, including C3G, PCA, PGA, 24 B-ring-derived metabolites and 1 A-ring-derived metabolite (Table 4). B-ring-derived ferulic acid was present at the highest concentration within the faeces, with a maximum recovery of 2373.1 μg at 6–24 h post-bolus, followed by the A-ring-derived ferulic acid (469.7 μg) and PCA (360.9 μg; Table 4).
Table 4.
Total faecal recovery of cyanidin-3-glucoside its degradation products and derived metabolites in humans between 0–6, 6–24 and 24–48 h after the consumption of 500 mg 13C-labelled C3G
| Metabolite | Recovery (μg) | ||
|---|---|---|---|
| 0–6 ha | 6–24 h | 24–48 h | |
| Parent anthocyanin | |||
| C3G | ND | 70.0b | 19.6b |
| Degradants | |||
| Protocatechuic acid (PCA) | ND | 360.9 ± 278.1c | 221.8 ± 134.9d |
| Phloroglucinaldehyde | ND | 2.1 ± 1.3e | 111.3 ± 78.7f |
| Protocatechuic acid derived | |||
| Hydroxybenzoic acid | ND | ND | 22.0 ± 11.6g |
| 2,3-Dihydroxybenzoic acid | ND | ND | 440.4 ± 381.8h |
| 2-Hydroxy-4-methoxybenzoic acid | ND | 1.4b | 273.3 ± 272.7h |
| Vanillic acid (VA) | ND | 54.7 ± 1.6h | 49.3 ± 21.4g |
| IsoVA | ND | 11.0b | 8.5b |
| Methyl-3,4-dihydroxybenzoate | ND | 166.6 ± 100.6g | 92.4 ± 49.4f |
| Methyl vanillate | ND | 35.1b | ND |
| Benzoic acid-4-glucuronide | 1.5b | 6.8 ± 3.0c | 14.8 ± 8.0i |
| PCA-3-glucuronide | ND | 22.9 ± 22.0g | 49.0b |
| PCA-4-glucuronide | ND | 16.1 ± 17.5 | 20.4 ± 16.2i |
| PCA-3-sulfate | 0.1b | 30.0 ± 27.7h | 11.7 ± 10.5e |
| PCA-4-sulfate | ND | 23.0 ± 18.1g | 12.0 ± 10.2g |
| VA-4-glucuronide | 3.6b | 3.3b | 9.5 ± 7.9g |
| IsoVA-3-glucuronide | 1.8b | 1.3b | 12.7 ± 10.9h |
| VA-4-sulfate | 0.6b | ND | 69.0 ± 39.1g |
| IsoVA-3-sulfate | ND | 0.6 ± 0.3h | 176.1 ± 174.7h |
| Hippuric acid | ND | 12.0 ± 11.4g | 27.5 ± 27.4h |
| Caffeic acid | ND | 25.2b | 354.6 ± 125.0h |
| Ferulic acid | ND | 2373.1 ± 2905.4e | 1454.7 ± 1362.0f |
| 4-Hydroxyphenylacetic acid | ND | 7.3b | 55.4b |
| 3,4-Dihydroxyphenylacetic acid | 2.0b | 10.1 ± 4.0e | 12.8 ± 7.5c |
| 4-Hydroxybenzaldehyde | ND | 0.8 ± 0.8h | 0.1b |
| 4-Methoxybenzaldehyde | ND | 20.7b | ND |
| 3,4-Dihydroxybenzaldehyde | ND | 3.4 ± 3.8h | 5.1 ± 1.8i |
| Phloroglucinaldehyde derived | |||
| Ferulic acidj | ND | 469.7 ± 687.1h | 240.8 ± 154.3c |
Number of participants providing sample voids at 0–6 h n = 2; all participants provided voids for the remaining time points.
Values are expressed as mean ± SEM, where metabolites were detected in bn = 1, cn = 5, dn = 7, en = 4, fn = 6, gn = 3, hn = 2, in = 8 participants.
jAlternative isomers of ferulic acid include 2-hydroxy-4-methoxycinnamic acid or 4-hydroxy-2-methoxycinnamic acid.
ND, not detected.
Discussion and conclusions
Interest in anthocyanins continues to grow as a result of their reported cardiovascular activity (Mink et al., 2007; Cassidy et al., 2011; 2013). We recently established that anthocyanins are absorbed and metabolized to a greater extent than had been previously reported (Miyazawa et al., 1999; Kay et al., 2004; 2005; Garcia-Alonso et al., 2009). Specifically, using a 13C-labelled anthocyanin and isotope-ratio mass spectrometry, we established that a substantial number and amount of breakdown products and conjugates of C3G were absorbed, metabolized and excreted; as represented by the recovery of 12% of the initial dose of 13C within the urine sample (Czank et al., 2013). The present study indicates that the majority of the label is present in the circulation as lower molecular weight 13C-labelled phenolic metabolites of the parent C3G.
By utilizing the targeted labelling of the A- and B-rings of C3G (Figure 1), the present study was able to confirm the pharmacokinetics of the phenolic conjugates of anthocyanins through the identification of 13C5-, 13C3- and 13C2-derived metabolites of the parent anthocyanin. This strategy allowed for the establishment of pharmacokinetic profiles of 17 metabolites in the circulation as well as the elimination of 31 and 28 metabolites in the urine and faeces respectively. To our knowledge, this diversity of anthocyanin metabolites has not been demonstrated previously in humans.
C3G and seven methylated and glucuronidated conjugates of C3G or Cy were identified within the urine sample, reaching cumulative concentrations of 763 nM at 1–2 h post-bolus (Figure 4A), which is in accordance with the previous studies (Kay et al., 2004; Manach et al., 2005; McGhie and Walton, 2007). However, the parent anthocyanin only represented 2% of the total metabolites found in the circulation and was only present for a relatively short period of time (t½, 0.4 h; Table 2), thus suggesting that anthocyanin bioactivity is likely to be mediated by high concentrations of its phenolic intermediates as opposed to the parent structure.
It is well established that C3G degrades to PCA and PGA when incubated at neutral pH (Kay et al., 2009; Woodward et al., 2009) and this is corroborated by the present data, as PCA (tmax, 3.3 h; Figure 2B) and PGA (tmax, 2.8 h; Figure 3C) were some of the earliest phenolic metabolites identified in the circulation (Table 2). In the present study, PCA was observed at maximum concentrations of 147 nM, thus suggesting that it is not a major metabolite of anthocyanins. The A-ring-derived degradation product, PGA, was present at concentrations greater than either C3G or PCA in the serum (Table 2 and Figure 3C). However, it was not detected in urine at any appreciable concentration, suggesting that it was further metabolized prior to elimination (Table 3 and Figure 5C). Multiple phase II metabolites of PCA were detected in early (from 0.5 h to 1 h) serum samples, suggesting that the degradation of anthocyanins in vivo is swiftly followed by further biotransformation.
Hippuric acid was identified as the major metabolite of anthocyanins in the present study, reaching a maximum concentration of 1962 nM in the serum (Table 2). Hippuric acid has been speculated to be a common metabolite for many flavonoids (Pero, 2010) but it is a challenging metabolite to identify without the use of an isotope label due to its high background levels derived from other dietary and endogenous (i.e. protein metabolism and amino acid catabolism) sources, where it is reported to reach 1–2 mM concentrations in human urine (Toromanović et al., 2008; Pero, 2010). The detection of 13C2-labelled hippuric acid in the present study indicates that PCA and its conjugates are likely further metabolized to form BA, which is conjugated with glycine to form hippuric acid, or alternatively, formed from the alpha-oxidation and dehydroxylation of hydroxyphenylacetic acids (Mullen et al., 2008). This suggests that glycine conjugation is a key metabolic process responsible for the clearance of phenolic metabolites of C3G from the body.
VA, the methylated metabolite of PCA, was also present in the serum in high concentrations (Table 2 and Figure 2C); however, it was only identified in the serum in two participants. Sulfation appeared to be the preferential metabolic process for the clearance of PCA, as PCA-sulfate (Figure 2B) and VA-sulfate (Figure 2C) were detected in much higher concentrations than their unconjugated or GlcA counterparts. This pattern of elimination of PCA metabolites in the serum was mirrored in the urine samples, with VA detected at the highest concentration, followed by meta and para sulfated and glucuronidated conjugates of PCA and VA (Table 3). Di-methylation of PCA was also observed by the presence of methyl-3,4-dihydroxybenzoate and methyl vanillate; however, methyl vanillate was only detected in the faeces (Table 4), suggesting that di-methylation of PCA results in biliary elimination, or more likely, is a product of microbial metabolism. Therefore, a primary route of metabolism and subsequent elimination of C3G appears to be through degradation to PCA, followed by rapid methylation of the catechol group to form VA, and subsequent sulfate and GlcA conjugation, thus increasing its polarity and elimination from the body. This finding is supported by previous studies feeding catechin to rats and guinea pigs, where unconjugated metabolites represented only 3.5–4.4% of the recovered phenolic metabolites (Das and Griffiths, 1969). Minimal amounts of phase I metabolites of PCA were also detected in this study, including 3,4-dihydroxybenzaldehyde (Figure 5C) and hydroxybenzoic acid (Figure 5A) within urine and 4-HBAL within serum (Figure 3C) and urine (Figure 5C), suggesting that phase I metabolism may not be a highly utilized pathway for anthocyanin metabolism.
Many metabolites of PCA in the present study appeared to follow biphasic serum kinetics, displaying an initial serum peak between 0 and 5 h followed by a second peak between 6 and 48 h (Figures 2 and 3). Biphasic absorption or elimination of delphinidin-3-glucoside has previously been reported in rats, with maximum plasma concentrations reported at 15 and 60 min (Ichiyanagi et al., 2004) and also within human studies feeding flavonoids, where isoflavonoids and metabolites including caffeic acid, ferulic acid and ferulic acid-sulfate were reported to follow biphasic plasma kinetic patterns (Anupongsanugool et al., 2005; Wittemer et al., 2005; Azzini et al., 2007; Stalmach et al., 2009; Rodriguez-Mateos et al., 2013). The biphasic profiles most likely result from metabolism occurring in multiple tissues, including the liver and at different sites within the gastrointestinal tract.
The route of elimination of the A-ring-derived metabolites is less clear. A total of three A-ring-derived metabolites were identified in the serum, urine and faecal samples (PGA, 2-hydroxy-4-methoxybenzoic acid and a compound putatively identified as ferulic acid). The metabolite tentatively identified as ferulic acid matched the molecular weight (+3), fragmentation pattern and had a retention time similar to the ferulic acid standard (Table 1); however, the exact structural conformation of 13C3-ferulic acid cannot be established with certainty, as other probable isomers could result from the methylation of the A-ring hydroxyl to form either 2-hydroxy-4-methoxycinnamic acid or 4-hydroxy-2-methoxycinnamic acid. We are not aware of previous studies reporting these metabolites and more work is required to confirm their exact structural identities. In addition, A-ring-derived 3,4-dihydroxybenzaldehyde and methyl 3,4-dihydroxybenzoate were tentatively identified within post-bolus samples; however, due to their low concentrations, they were not included in the present analyses. At present, little is known about the metabolism of PGA and further studies are required to delineate the mechanisms involved in its metabolism and clearance.
Colonic metabolism has long been speculated to be a major contributor to the overall metabolism of anthocyanins (Williamson and Clifford, 2010; Cardona et al., 2013) and our 13C-labelled C3G study reported 32 ± 6% of the recovered 13C-label in faeces (Czank et al., 2013). It has been proposed that phenylpropenoic acids arise from C3G as a result of bacterial cleavage of the C-ring in the colon (Forester and Waterhouse, 2008; Gonzalez-Barrio et al., 2011), which is supported by the detection of caffeic acid and its methyl metabolite, ferulic acid, within the faeces in the present investigation. The absence of caffeic acid in the serum and urine despite its abundance within the faeces (Table 4) suggests that the catechol group of caffeic acid is rapidly methylated to yield ferulic acid, either during intestinal absorption, prior to entry into the systemic circulation or by the liver. The rapid metabolism of caffeic acid has been observed in previous phenolic acid intervention studies, where caffeic acid is reported at significantly lower concentrations than its methyl, glucuronyl and sulfate conjugates (Nardini et al., 2006). In addition, ferulic acid was detected within the serum and urine samples within 4 h of consumption, indicating that ferulic acid may, in part, be formed proximal to the colon (i.e. the middle and lower small intestine).
On the basis of the findings of this study, the metabolism of anthocyanins can be summarized as undergoing multiple biotransformations (Figure 6). The parent compound appears to undergo methylation and glucuronidation to some extent; however, it primarily undergoes degradation, followed by significant phase II conjugation, particularly methylation and sulfation. Given the early timing and high concentrations of PCA and PGA observed in this study, it is clear that C3G spontaneously degrades to PCA and PGA in the small intestine and circulation; however, colonic metabolism is also likely to play a significant role. Dehydroxylation by colonic bacteria, to form hydroxybenzoic acid, followed by conjugation with glycine to form hippuric acid, appears to be the definitive elimination pathway. Finally, the metabolism of PGA to phenylpropenoic acids, which are similar to, or include, ferulic acid, may be responsible for the detoxification and elimination of PGA.
Figure 6.

Proposed pathway for the metabolism of cyanidin-3-glucoside in humans. *Conjugates represent unknown structural position. BA, benzoic acid; BAL, benzaldehyde; C3G, cyanidin-3-glucoside; Cy, cyanidin; GlcA, glucuronide; Me, methoxy; M34dhbz, methyl-3,4-dihydroxybenzoate; P3G, peonidin-3-glucoside; PAA, phenylacetic acid; PGA, phloroglucinaldehyde.
The biological activities of the parent anthocyanins has been previously reported (Xu et al., 2004; Bell and Gochenaur, 2006; Kim et al., 2006; Nizamutdinova et al., 2009; Zhu et al., 2011); however, the activities of the phenolic metabolites identified in the present study are relatively unknown. Many of the metabolites identified share structural similarities with known bioactives such as apocynin, an inhibitor of NADPH oxidase (Kim et al., 2011), and salicylic acid, known for its anti-inflammatory activity (Vane and Botting, 2003). Of the limited information available for many of the presently identified metabolites, PCA has been shown to reduce vascular cell adhesion molecule-1 (VCAM-1) protein and mRNA in TNF-α-induced mouse aortic endothelial cells (Wang et al., 2010). In addition, plasma VCAM-1 levels were reduced in mice fed PCA (Wang et al., 2010), whereas vanillic acid fed mice showed reductions in plasma IL-6 (Kim et al., 2010). Moreover, in LPS-induced RAW 264.7 cells, PCA has been shown to suppress the production of TNF-α, IL-1β, NO, PGE2 and the gene expression of NOS and COX-2 (Min et al., 2010). Together, these studies suggest that the bioactivity of anthocyanins is likely attributed to their phenolic metabolites, which may have both vascular and anti-inflammatory activity. However, a great deal of work is required to confirm the bioactivities of the extensive numbers of metabolites identified herein.
The major limitation of the presently employed analytical methodology is its targeted approach, which relies on pure standards and MRM for identification. This approach is highly sensitive; however, it does not allow for the identification of unknown/untargeted metabolites. Additional synthesis of the speculated metabolites is necessary to confirm their identities. In addition, alternative spectroscopy techniques such as GC-MS/MS and high resolution time-of-flight MS would aid in identifying further metabolites not captured by the present methodology. As many of the metabolites did not completely returned to baseline by 48 h, a longer blood, urine and faecal sampling time may have increased the recovery of metabolites. Despite these limitations, this human study has demonstrated for the first time that a wide array of metabolites are recovered by the described extraction and detection methods and these data represent a considerable advancement in our understanding of anthocyanin ADME.
In conclusion, the extensive number of anthocyanin metabolites identified, the appearance of multiple peaks across the 48 h time period and the wide range of their elimination half-lives suggest that the clearance of anthocyanins involves multiple processes, including enterohepatic recirculation, hepatic recycling and microbial metabolism, with an extended period of intestinal absorption from both the small and the large bowel. This study provides new insights into the metabolism of anthocyanins, which should inform the design of future clinical studies exploring the bioactivity of these potentially important dietary compounds.
Acknowledgments
We thank Hiren Amin, Mark Philo and Shikha Saha for their contributions to sample collection and analysis; and Paul Needs, K Saki Raheem and David O'Hagan for their work on the chemical synthesis of phenolic conjugate standards. C. D. K. and A. C. have received research funding from GlaxoSmithKline for UK BBSRC Council CASE studentships in the past. A. C. is a Royal Society Wolfson Research Merit Award Holder. This study was supported by funding from the UK Biotechnology and Biological Sciences Research Council Diet and Health Research Industry Club (BBSRC-DRINC) (BB/H004963/1, BB/H00503X/1 and BB/H004726) and partially through a BBSRC Institute Strategic Programme Grant to IFR/UEA (‘Food and Health’; Grant No. BB/J004545/1).
Glossary
- ADME
absorption, distribution, metabolism and elimination
- BA
benzoic acid
- C3G
cyanidin-3-glucoside
- Cy
cyanidin
- GlcA
glucuronide
- 4-HBAL
4-hydroxybenzaldehyde
- P3G
peonidin-3-glucoside
- PCA
protocatechuic acid
- PGA
phloroglucinaldehyde
- VA
vanillic acid
Authors contribution
The authors' responsibilities were as follows: C. D. K., A. C., N. P. B. and P. A. K. conceived and designed the study; C. D. K. and C. C. gained research-governance, ethical approval and conducted the feeding study and R. M. F. assisted with sample collection and processing; C. D. K. and P. A. K. managed the analytical work; C. D. K., C. C. and R. M. F. performed the HPLC-MS/MS analysis and pharmacokinetic modelling, compiled and analysed the raw data; N. P. B. and Q. Z. developed the synthesis strategy and synthesized the 13C5-C3G; C. D. K., R. M. F. and C. C. prepared the first draft of the manuscript; C. D. K., C. C., R. M. F., A. C., Q. Z. and P. A. K., all reviewed and critically appraised the manuscript; C. D. K had primary responsibility for the final content or the manuscript; and all authors agreed on the final version.
Conflict of interest
All authors report no conflicts of interest.
References
- Anupongsanugool E, Teekachunhatean S, Rojanasthien N, Pongsatha S, Sangdee C. Pharmacokinetics of isoflavones, daidzein and genistein, after ingestion of soy beverage compared with soy extract capsules in postmenopausal Thai women. BMC Pharmacol Toxicol. 2005;5:2. doi: 10.1186/1472-6904-5-2. [DOI] [PMC free article] [PubMed] [Google Scholar]
- Azzini E, Bugianesi R, Romano F, Di Venere D, Miccadei S, Durazzo A, et al. Absorption and metabolism of bioactive molecules after oral consumption of cooked edible heads of Cynara scolymus L. (cultivar Violetto di Provenza) in human subjects: a pilot study. Br J Nutr. 2007;97:963–969. doi: 10.1017/S0007114507617218. [DOI] [PubMed] [Google Scholar]
- Bell DR, Gochenaur K. Direct vasoactive and vasoprotective properties of anthocyanin-rich extracts. J Appl Physiol. 2006;100:1164–1170. doi: 10.1152/japplphysiol.00626.2005. [DOI] [PubMed] [Google Scholar]
- Cardona F, Andrés-Lacueva C, Tulipani S, Tinahones FJ, Queipo-Ortuño MI. Benefits of polyphenols on gut microbiota and implications in human health. J Nutr Biochem. 2013;24:1415–1422. doi: 10.1016/j.jnutbio.2013.05.001. [DOI] [PubMed] [Google Scholar]
- Cassidy A, O'Reilly ÉJ, Kay CD, Sampson L, Franz M, Forman J, et al. Habitual intake of flavonoid subclasses and incident hypertension in adults. Am J Clin Nutr. 2011;93:338–347. doi: 10.3945/ajcn.110.006783. [DOI] [PMC free article] [PubMed] [Google Scholar]
- Cassidy A, Mukamal KJ, Liu L, Franz M, Eliassen AH, Rimm EB. High anthocyanin intake is associated with a reduced risk of myocardial infarction in young and middle-aged women. Circulation. 2013;127:188–196. doi: 10.1161/CIRCULATIONAHA.112.122408. [DOI] [PMC free article] [PubMed] [Google Scholar]
- Czank C, Cassidy A, Zhang Q, Morrison DJ, Preston T, Kroon PA, et al. Human metabolism and elimination of the anthocyanin, cyanidin-3-glucoside: a 13C-tracer study. Am J Clin Nutr. 2013;97:995–1003. doi: 10.3945/ajcn.112.049247. [DOI] [PubMed] [Google Scholar]
- Das NP, Griffiths LA. Studies on flavonoid metabolism. Metabolism of (+)-[14C] catechin in the rat and guinea pig. Biochem J. 1969;115:831–836. doi: 10.1042/bj1150831. [DOI] [PMC free article] [PubMed] [Google Scholar]
- Del Rio D, Borges G, Crozier A. Berry flavonoids and phenolics: bioavailability and evidence of protective effects. Br J Nutr. 2010;104(Suppl. 3):S67–S90. doi: 10.1017/S0007114510003958. [DOI] [PubMed] [Google Scholar]
- Erdman JW, Jr, Balentine D, Arab L, Beecher G, Dwyer JT, Folts J, et al. Flavonoids and heart health: proceedings of the ILSI North America Flavonoids Workshop, May 31-June 1, 2005, Washington, DC. J Nutr. 2007;137:718S–737S. doi: 10.1093/jn/137.3.718S. [DOI] [PubMed] [Google Scholar]
- de Ferrars RM, Cassidy A, Curtis P, Kay CD. Phenolic metabolites of anthocyanins following a dietary intervention study in postmenopausal women. Mol Nutr Food Res. 2014;58:490–502. doi: 10.1002/mnfr.201300322. [DOI] [PubMed] [Google Scholar]
- Forester SC, Waterhouse AL. Identification of Cabernet Sauvignon anthocyanin gut microflora metabolites. J Agric Food Chem. 2008;56:9299–9304. doi: 10.1021/jf801309n. [DOI] [PubMed] [Google Scholar]
- Garcia-Alonso M, Minihane A-M, Rimbach G, Rivas-Gonzalo JC, de Pascual-Teresa S. Red wine anthocyanins are rapidly absorbed in humans and affect monocyte chemoattractant protein 1 levels and antioxidant capacity of plasma. J Nutr Biochem. 2009;20:521–529. doi: 10.1016/j.jnutbio.2008.05.011. [DOI] [PubMed] [Google Scholar]
- Gonzalez-Barrio R, Edwards C, Crozier A. Colonic catabolism of ellagitannins, ellagic acid, and raspberry anthocyanins: in vivo and in vitro studies. Drug Metab Dispos. 2011;39:1680–1688. doi: 10.1124/dmd.111.039651. [DOI] [PubMed] [Google Scholar]
- Ichiyanagi T, Rahman MM, Kashiwada Y, Ikeshiro Y, Shida Y, Hatano Y, et al. Absorption and metabolism of delphinidin 3-O-β-d-glucopyranoside in rats. Free Radic Biol Med. 2004;36:930–937. doi: 10.1016/j.freeradbiomed.2004.01.005. [DOI] [PubMed] [Google Scholar]
- Kay CD, Mazza G, Holub BJ, Wang J. Anthocyanin metabolites in human urine and serum. Br J Nutr. 2004;91:933–942. doi: 10.1079/bjn20041126. [DOI] [PubMed] [Google Scholar]
- Kay CD, Mazza G, Holub BJ. Anthocyanins exist in the circulation primarily as metabolites in adult men. J Nutr. 2005;135:2582–2588. doi: 10.1093/jn/135.11.2582. [DOI] [PubMed] [Google Scholar]
- Kay CD, Kroon PA, Cassidy A. The bioactivity of dietary anthocyanins is likely to be mediated by their degradation products. Mol Nutr Food Res. 2009;53(S1):92–101. doi: 10.1002/mnfr.200800461. [DOI] [PubMed] [Google Scholar]
- Kim HJ, Tsoy I, Park JM, Chung JI, Shin SC, Chang KC. Anthocyanins from soybean seed coat inhibit the expression of TNF-α-induced genes associated with ischemia/reperfusion in endothelial cell by NF-κB-dependent pathway and reduce rat myocardial damages incurred by ischemia and reperfusion in vivo. FEBS Lett. 2006;580:1391–1397. doi: 10.1016/j.febslet.2006.01.062. [DOI] [PubMed] [Google Scholar]
- Kim S-J, Kim M-C, Um J-Y, Hong S-H. The beneficial effect of vanillic acid on ulcerative colitis. Molecules. 2010;15:7208–7217. doi: 10.3390/molecules15107208. [DOI] [PMC free article] [PubMed] [Google Scholar]
- Kim SY, Moon K-A, Jo H-Y, Jeong S, Seon S-H, Jung E, et al. Anti-inflammatory effects of apocynin, an inhibitor of NADPH oxidase, in airway inflammation. Immunol Cell Biol. 2011;90:441–448. doi: 10.1038/icb.2011.60. [DOI] [PubMed] [Google Scholar]
- Manach C, Williamson G, Morand C, Scalbert A, Rémésy C. Bioavailability and bioefficacy of polyphenols in humans. I. Review of 97 bioavailability studies. Am J Clin Nutr. 2005;81:230S–242S. doi: 10.1093/ajcn/81.1.230S. [DOI] [PubMed] [Google Scholar]
- McGhie TK, Walton MC. The bioavailability and absorption of anthocyanins: towards a better understanding. Mol Nutr Food Res. 2007;51:702–713. doi: 10.1002/mnfr.200700092. [DOI] [PubMed] [Google Scholar]
- Min S-W, Ryu S-N, Kim D-H. Anti-inflammatory effects of black rice, cyanidin-3-O-β-D-glycoside, and its metabolites, cyanidin and protocatechuic acid. Int Immunopharmacol. 2010;10:959–966. doi: 10.1016/j.intimp.2010.05.009. [DOI] [PubMed] [Google Scholar]
- Mink PJ, Scrafford CG, Barraj LM, Harnack L, Hong CP, Nettleton JA, et al. Flavonoid intake and cardiovascular disease mortality: a prospective study in postmenopausal women. Am J Clin Nutr. 2007;85:895–909. doi: 10.1093/ajcn/85.3.895. [DOI] [PubMed] [Google Scholar]
- Miyazawa T, Nakagawa K, Kudo M, Muraishi K, Someya K. Direct intestinal absorption of red fruit anthocyanins, cyanidin-3-glucoside and cyanidin-3,5-diglucoside, into rats and humans. J Agric Food Chem. 1999;47:1083–1091. doi: 10.1021/jf9809582. [DOI] [PubMed] [Google Scholar]
- Mullen W, Rouanet J, Auger C, Teissèdre P, Caldwell S, Hartley R, et al. Bioavailability of [2-(14)C]quercetin-4′-glucoside in rats. J Agric Food Chem. 2008;56:12127–12137. doi: 10.1021/jf802754s. [DOI] [PubMed] [Google Scholar]
- Nardini M, Natella F, Scaccini C, Ghiselli A. Phenolic acids from beer are absorbed and extensively metabolized in humans. J Nutr Biochem. 2006;17:14–22. doi: 10.1016/j.jnutbio.2005.03.026. [DOI] [PubMed] [Google Scholar]
- Nardini M, Forte M, Vrhovsek U, Mattivi F, Viola R, Scaccini C. White wine phenolics are absorbed and extensively metabolized in humans. J Agric Food Chem. 2009;57:2711–2718. doi: 10.1021/jf8034463. [DOI] [PubMed] [Google Scholar]
- Nizamutdinova IT, Kim YM, Chung JI, Shin SC, Jeong Y-K, Seo HG, et al. Anthocyanins from black soybean seed coats preferentially inhibit TNF-α-mediated induction of VCAM-1 over ICAM-1 through the regulation of GATAs and IRF-1. J Agric Food Chem. 2009;57:7324–7330. doi: 10.1021/jf900856z. [DOI] [PubMed] [Google Scholar]
- Nurmi T, Mursu J, Heinonen M, Nurmi A, Hiltunen R, Voutilainen S. Metabolism of berry anthocyanins to phenolic acids in humans. J Agric Food Chem. 2009;57:2274–2281. doi: 10.1021/jf8035116. [DOI] [PubMed] [Google Scholar]
- Pero RW. Health consequences of catabolic synthesis of hippuric acid in humans. Curr Clin Pharmacol. 2010;5:67. doi: 10.2174/157488410790410588. [DOI] [PubMed] [Google Scholar]
- Rodriguez-Mateos A, Rendeiro C, Bergillos-Meca T, Tabatabaee S, George TW, Heiss C, et al. Intake and time dependence of blueberry flavonoid-induced improvements in vascular function: a randomized, controlled, double-blind, crossover intervention study with mechanistic insights into biological activity. Am J Clin Nutr. 2013;98:1179–1191. doi: 10.3945/ajcn.113.066639. [DOI] [PubMed] [Google Scholar]
- Stalmach A, Mullen W, Barron D, Uchida K, Yokota T, Cavin C, et al. Metabolite profiling of hydroxycinnamate derivatives in plasma and urine after the ingestion of coffee by humans: identification of biomarkers of coffee consumption. Drug Metab Disp. 2009;37:1749. doi: 10.1124/dmd.109.028019. [DOI] [PubMed] [Google Scholar]
- Toromanović J, Kovač-Bešović E, Šapčanin A, Tahirović I, Rimpapa Z. Urinary hippuric acid after ingestion of edible fruits. Bosn J Basic Med Sci. 2008;8:38–43. doi: 10.17305/bjbms.2008.2994. [DOI] [PMC free article] [PubMed] [Google Scholar]
- Vane JR, Botting RM. The mechanism of action of aspirin. Thromb Res. 2003;110:255–258. doi: 10.1016/s0049-3848(03)00379-7. [DOI] [PubMed] [Google Scholar]
- Vitaglione P, Donnarumma G, Napolitano A, Galvano F, Gallo A, Scalfi L, et al. Protocatechuic acid is the major human metabolite of cyanidin-glucosides. J Nutr. 2007;137:2043–2048. doi: 10.1093/jn/137.9.2043. [DOI] [PubMed] [Google Scholar]
- Wang D, Wei X, Yan X, Jin T, Ling W. Protocatechuic acid, a metabolite of anthocyanins, inhibits monocyte adhesion and reduces atherosclerosis in apolipoprotein E-deficient mice. J Agric Food Chem. 2010;58:12722–12728. doi: 10.1021/jf103427j. [DOI] [PubMed] [Google Scholar]
- Williamson G, Clifford MN. Colonic metabolites of berry polyphenols: the missing link to biological activity? Br J Nutr. 2010;104(Suppl. 3):S48–S66. doi: 10.1017/S0007114510003946. [DOI] [PubMed] [Google Scholar]
- Wittemer SM, Ploch M, Windeck T, Müller SC, Drewelow B, Derendorf H, et al. Bioavailability and pharmacokinetics of caffeoylquinic acids and flavonoids after oral administration of Artichoke leaf extracts in humans. Phytomedicine. 2005;12:28–38. doi: 10.1016/j.phymed.2003.11.002. [DOI] [PubMed] [Google Scholar]
- Woodward G, Kroon P, Cassidy A, Kay C. Anthocyanin stability and recovery: implications for the analysis of clinical and experimental samples. J Agric Food Chem. 2009;57:5271–5278. doi: 10.1021/jf900602b. [DOI] [PubMed] [Google Scholar]
- Woodward GM, Needs PW, Kay CD. Anthocyanin derived phenolic acids form glucuronides following simulated gastrointestinal digestion and microsomal glucuronidation. Mol Nutr Food Res. 2011;55:378–386. doi: 10.1002/mnfr.201000355. [DOI] [PubMed] [Google Scholar]
- Xu J-W, Ikeda K, Yamori Y. Upregulation of endothelial nitric oxide synthase by cyanidin-3-glucoside, a typical anthocyanin pigment. Hypertension. 2004;44:217–222. doi: 10.1161/01.HYP.0000135868.38343.c6. [DOI] [PubMed] [Google Scholar]
- Zhang Q, Botting NP, Kay C. A gram scale synthesis of a multi-13C-labelled anthocyanin,[6, 8, 10, 3′, 5′-13C5] cyanidin-3-glucoside, for use in oral tracer studies in humans. Chem Commun. 2011;47:10596–10598. doi: 10.1039/c1cc14323a. [DOI] [PubMed] [Google Scholar]
- Zhang Q, Saki Raheem K, Botting N, Slawin A, Kay C, O'Hagan D. Flavonoid metabolism: the synthesis of phenolic glucuronides and sulfates as candidate metabolites for bioactivity studies of dietary flavonoids. Tetrahedron. 2012;68:4194–4201. [Google Scholar]
- Zhang Y, Huo M, Zhou J, Xie S. PKSolver: an add-in program for pharmacokinetic and pharmacodynamic data analysis in Microsoft Excel. Comput Methods Programs Biomed. 2010;99:306–314. doi: 10.1016/j.cmpb.2010.01.007. [DOI] [PubMed] [Google Scholar]
- Zhu Y, Xia M, Yang Y, Liu F, Li Z, Hao Y, et al. Purified anthocyanin supplementation improves endothelial function via NO-cGMP activation in hypercholesterolemic individuals. Clin Chem. 2011;57:1524–1533. doi: 10.1373/clinchem.2011.167361. [DOI] [PubMed] [Google Scholar]