Abstract
Rate (k) and equilibrium (K) constants for the reaction of tetrahydrofuranol with a series of Mg2+ complexes of methyl triphosphate analogues, CH3O-P(O2)-O-P(O2)-X-PO34–, X = O, CH2, CHCH3, C(CH3)2, CFCH3, CHF, CHCl, CHBr, CFCl, CF2, CCl2, and CBr2, forming phosphate diester and pyrophosphate or bisphosphonate in aqueous solution were evaluated by B3LYP/TZVP//HF/6-31G* quantum chemical calculations and Langevin dipoles and polarized continuum solvation models. The calculated log k and log K values were found to depend linearly on the experimental pKa4 of the conjugate acid of the corresponding pyrophosphate or bisphosphonate leaving group. The calculated slopes of these Brønsted linear free energy relationships were βlg = −0.89 and βeq = −0.93, respectively. The studied compounds also followed the linear relationship Δlog k = 0.8Δlog K, which became less steep, Δlog k = 0.6Δlog K, after the range of studied compounds was extended to include analogues that were doubly protonated on γ-phosphate, CH3O-P(O2)-O-P(O2)-X-PO3H22–. The scissile Pα–Olg bond length in studied methyl triphosphate analogues slightly increases with decreasing pKa of the leaving group; concomitantly, the CH3OPα(O2) moiety becomes more positive. These structural effects indicate that substituents with low pKa can facilitate both Pα–Olg bond breaking and the Pα–Onuc bond forming process, thus explaining the large negative βlg calculated for the transition state geometry that has significantly longer Pα–Onuc distance than the Pα–Olg distance.
DNA polymerases are complex bisubstrate enzymes that facilitate DNA replication.1 From the chemical point of view, these enzymes catalyze the transfer of the nucleotidyl moiety of deoxyribonucleoside triphosphates (dNTPs) to the 3′-end of the DNA primer. This reaction is known to involve deprotonation of the 3′-terminal oxygen atom of the primer strand, which is followed by the attack of this nucleophile on the Pα atom of dNTP and the breaking of the Pα–O bond in the Pα–O–Pβ bridge to generate inorganic pyrophosphate (PPi). The knowledge of the free energy surface for the corresponding reference reaction in aqueous solution is important to quantitatively assess the DNA polymerase catalysis and identify mechanistic alterations that could facilitate the insertion of wrong or nonstandard dNTP substrates into the growing DNA chain.
The nature of the transition state (TS) for the enzymatic nucleotidyl transfer reaction has been studied in human DNA polymerase β (pol β) using a series of modified dNTP substrates that differed in the chemical structure of the group that bridges β and γ phosphorus atoms of the triphosphate part of dNTP.2−5 These experiments initially showed that the rate constant of the enzymatic reaction is directly proportional to the equilibrium constant for the protonation of PPi or its bisphosphonate analogues and that the slope (βlg) of this linear free energy relationship (LFER) differs between the right and wrong dNTP substrates.2 Later, a structurally broader range of substituents showed a clearly separate LFER for the insertion of a wrong dNTP with mono- and dihalogenated β–γ bridging substituents.3,5 Interestingly, these effects of bulky substituents were later reproduced by quantum mechanical calculations in the absence of the enzyme environment.6
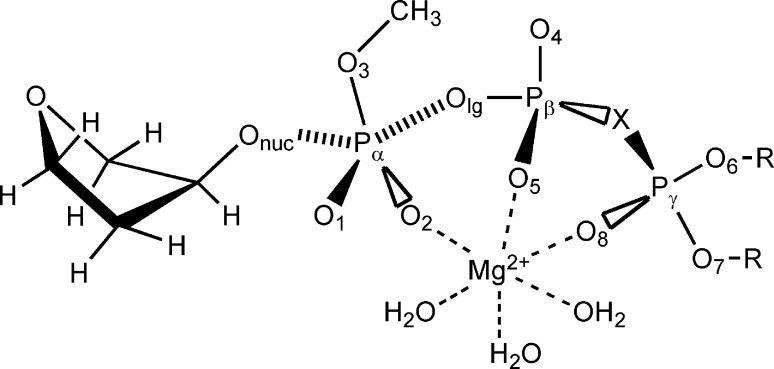
In this paper, we present computational study of the uncatalyzed reaction of tetrahydrofuranolate (THFO–) with a series of Mg2+ complexes of β–γ-substituted methyl triphosphates in aqueous solution (Figure 1). These reactants were chosen as models of the deprotonated deoxyribose terminus of the primer DNA strand and dNTP, respectively. After exploring the free energy surface near the TS plateau for this reaction, we expanded our study to include an additional 11 dNTP analogues with bisphosphonate leaving groups of pKa4 constants spanning the 7.8–12.3 range. For these compounds, we examined βlg and the corresponding linear relationship (βeq) between leaving group pKa and the logarithm of the calculated equilibrium constant for the studied reaction. To address the structural basis of the observed Brønsted LFER, we also evaluated substituent effects on the POlg bond length and atomic charges.
Figure 1.
Schematic structure of the reacting system. X = O, (R)-CHF, (S)-CHF, (R)-CHCl, (S)-CHCl, (R)-CHBr, (S)-CHBr, (R)-CFCl, (S)-CFCl, (R)-CHCH3, (S)-CHCH3, (R)-CFCH3, (S)-CFCH3, CH2, CF2, CCl2, CBr2, C(CH3)2; R = H+ or nothing.
Computational Methods
Structural and Mechanistic Models
The 3′-terminus of the primer DNA strand and β,γ-substituted dNTP substrate were modeled by 3′-hydroxy tetrahydrofuran and β,γ-substituted methyl triphosphate, respectively, in a complex with a Mg2+ ion and three explicit water molecules (Figure 1). The initial reactant state geometry of methyltriphosphate and Mg2+ ion was identical to the geometry of these atoms in dCTP bound to pol β.7 Of the two Mg2+ ions present in the pol β active site we kept the “structural” ion, which is complexed to the triphosphate moiety, while the “catalytic” Mg2+ ion, which coordinates only the α-phosphate, was removed. Although the “structural” Mg2+ ion may increase the reaction rate in aqueous solution by up to 3 orders of magnitude (about 4 kcal/mol at 298 K),8 its main purpose in our study is to make the calculated gas-phase and solvation energetics more accurate by decreasing large negative charge of the substrate.
The following two mechanistic variants of this reacting system were considered: For the parent triphosphate (X = O in Figure 1), the first mechanism contained doubly protonated γ-phosphate:
| 1 |
and the second mechanism contained unprotonated γ-phosphate:
| 2 |
resulting, respectively, in the −1 and −3 total charge of the reacting system. (Note that eq 2 is referred in the text either as mechanism 2 or as reaction 2. In the former case THFO– has the role of reaction intermediate, and in the latter it is considered to be the reactant.)
The reaction free energy surfaces in aqueous solution were studied by constrained mapping of the relative free energy of the reacting system as a function of the POnuc and POlg distances (Figure 1). Each gas-phase ab initio energy and solvation free energy of the reacting system was calculated relative to the sum of the corresponding energies of THFO– and the Mg2+ complex of β–γ-substituted methyl triphosphate. The free energy cost of protonating the γ-phosphate in mechanism 1 was determined as ΔGpH = 2.303RT(pH – pKa1) + 2.303RT(pH – pKa2), where pKa1 = 6.6 and pKa2 = 1.5.9,10 To generate free energy surfaces for the reaction of the primer terminus of DNA with dNTP in aqueous solution at pH 7 and 1 M concentration of each reactant,
|
|
3 |
the resulting relative free energies from mechanism 1 and 2 were corrected for the configuration entropy and experimental pKa of deoxyribose (pKa = 12.67).11 The constant configuration entropy correction of 5.3 kcal/mol was taken from the restraint-release entropy calculations of hydrolysis of a phosphate monoester with the 3-chloro phenyl leaving group,12 whose pKa of 9.02 is similar to the pKa of PPi, which is the leaving group for our parent compound.
Ab Initio Quantum Mechanical Calculations
Partial and full geometry optimizations were carried out in the gas phase at the HF/6-31G* level using the Gaussian 03 program.13 Each point on the reaction pathway was defined by a pair of fixed POnuc and POlg distances, which were the same for mechanisms 1 and 2. For each mechanism, three reaction pathways were considered to generate relevant POnuc and POlg pairs (Figures 2 and 3). Due to our primary focus on aqueous solution rather than gas-phase energies, we used a loose convergence criterion of maximum force = 0.0025 hartree/bohr. Single point energies were obtained using the B3LYP hybrid density functional combined with Ahlrich’s triple-ζ valence polarized basis set (TZVP).14 This method was selected to allow consistent comparison with an earlier study of methanolysis of dimethylphosphate that was carried out at the same B3LYP/TZVP//HF/6-31G* level.15
Figure 2.
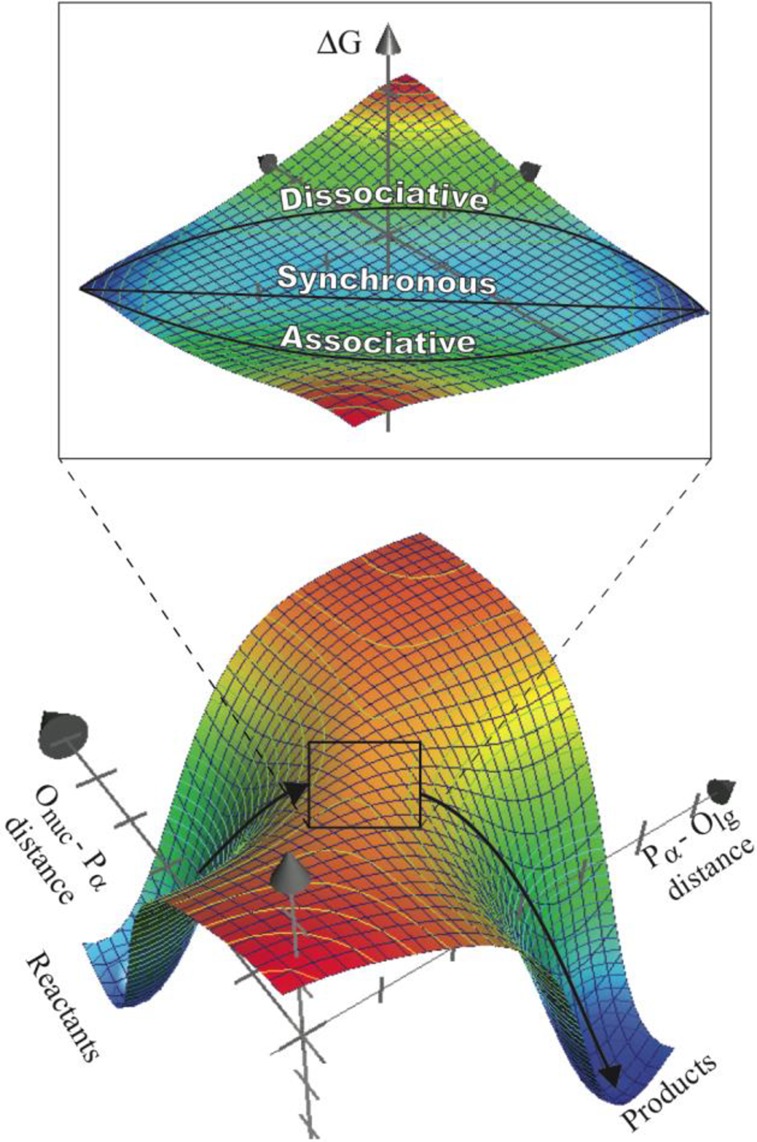
Schematic free energy surface for the hydrolysis of phosphate diesters with good leaving groups in aqueous solution. Figure inset illustrates the minimal number of reaction pathways that are required to map the free energy profile in the TS region.
Figure 3.
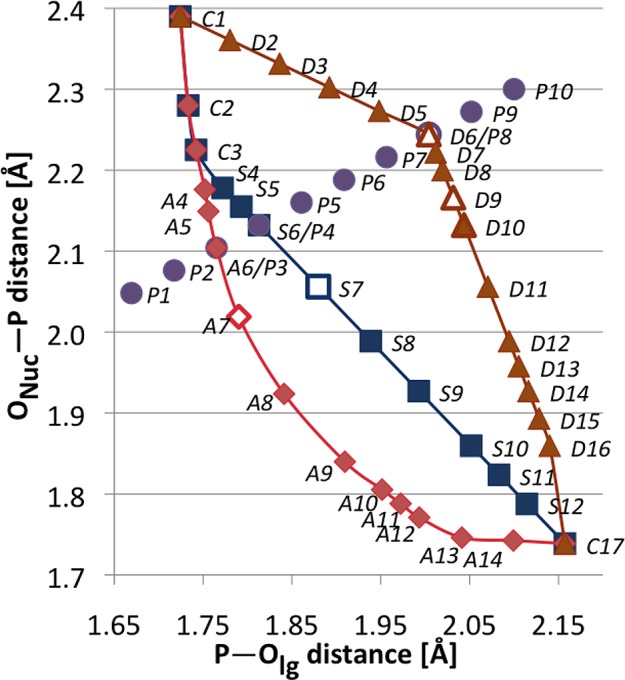
Bond distances that were used for mapping of relative free energies in the vicinity of the TS plateau for reaction 3. The labels A, S, D, P, and C denote, respectively, associative, synchronous, dissociative reaction pathways, a slice orthogonal to the reaction coordinate, and points belonging to two or more pathways. The A7, S7, D9, and D6 points were used in our analysis of the β–γ substituent effects.
For the reactant state and all points on the reaction pathways, positions of the Olg, Pα, and Onuc atoms were maintained in a plane perpendicular to the Pα–O1–O2 plane, and the torsional angles χ = Pα–Olg–Pβ–Oβγ, δ = Olg–Pβ–Oβγ–Pγ, and ε = Pβ–Oβγ–Pγ–Oγ1 (Figure 1) were fixed at −87.09°, 98.47°, and 97.95°, respectively; the δ and ε angles remained fixed also in the product structure, while the structure of the diester product was fully optimized. These torsional angles were observed in dCTP bound to pol β.7 Other DNA polymerases16−20 and dUTPases,21 which catalyze an analogous reaction, bind dNTP substrates in a similar gauche conformation that does not significantly change during their chemical transformation22,23 (Supplementary Table 1S). For the diester product, we considered only the lowest free energy gauche–gauche conformer. In addition, each point for mechanism 1 was initially optimized with the oxygen atom in the β,γ-bridge and with the γ-phosphate in a doubly protonated form (Figure 1, X = O, R = H). All torsional angles in the final optimized geometry were kept fixed in the subsequent optimization of the geometry of the point with the same POnuc and POlg distances for mechanism 2.
For each chemically modified compound (i.e., Xβγ ≠ O, Figure 1), the partially optimized geometries and solvation free energies were evaluated for the reactant and product states and for the TS along each of the three reaction pathways of mechanisms 1 and 2 (Figure 3). The POnuc and POlg distances at the six TS points were chosen to be the same for all β–γ-substituted compounds; these distances were determined from the free energy surfaces calculated for the parent substrate (i.e., X = O, Figure 1). This approximation is justified by the flatness of the free energy surface near the TS. In other words, the use of the same P–Onuc and P–Olg distances for the TS of all compounds causes an error of the calculated substituent effect on the activation free energy that is negligible compared to the inaccuracy of the calculated solvation free energy differences. Partial geometry optimizations for these TS points were carried out at the PCM/HF/6-31G* level using the Gaussian 09 program24 and employing the torsional constraints for the triphosphate backbone that were described in the previous paragraph.
Free Energy Calculations
Calculations of reaction free energy surfaces of charged flexible compounds in aqueous solution are associated with challenging difficulties. These issues include, for example, the large charge–charge interactions distorting the solute geometries during quantum-mechanical geometry optimizations in the gas phase or implicit solvents, the difficulties with sampling of the energies along degrees of freedom that do not contribute to the reaction coordinate, in particular torsional coordinates that feature multiple minima on their potential energy surfaces, and the multidimensional nature of the reaction coordinate. To partly offset these artifacts we fixed several torsional coordinates of the substrate and studied doubly protonated and Mg2+-complexed substrates, thereby decreasing the total charge of the reacting system to −1. The main purpose of examining the −1 charged system was to improve the validity of the gas-phase geometries of the coordinates perpendicular to the reaction coordinate during the exploration of the free energy surface of the parent compound (Supplementary Figure 1S). The −3 charged reacting system, as the predominant form at pH 7, was then relied upon for the calculations of the substituent effects.
The free energies in aqueous solution at pH 7 were calculated as a sum of the B3LYP/TZVP//HF/6-31G* energy, the solvation free energy, and empirical pKa and configurational entropy corrections (Supplementary Figure 1S). The energies for the reactant and product states were calculated as a sum of free energies of the corresponding infinitely separated fragments.
Solvation free energies (i.e., the free energies of transfer of the solute molecule from a 1 M concentration in the gas phase to a 1 M concentration in aqueous solution at 298 K) were calculated using the Langevin dipoles (LD) solvation model and the ChemSol 2.1 program.25,26 The LD model, which evaluates an average polarization of the solvent molecules and energetics of solute–solvent interactions by using a discrete dipolar representation of the solvent, has been used extensively in studies of chemical processes in solution.6,26−30 The LD solvation free energies also involve parametrized terms that represent dispersion and hydrophobic solute–solvent interactions and that depend on the atom type and solute–solvent boundary. In the present study, the solute–solvent boundary was determined using the atomic radii of 3.2, 2.8, 2.65, 2.65, 2.46, 3.16, 3.44, and 1.82 Å for the P, O, C, N, F, Cl, Br, and Mg atoms, respectively. The radius of each hydrogen atom was equal to the radius of the nearest non-hydrogen atom multiplied by a factor of 0.88. With the exception of the radius of the oxygen atoms, these radii and other parameters correspond to the default parameter set in the ChemSol program.26 The radius of the oxygen atoms was adjusted to obtain reasonable agreement between the calculated (−71 kcal/mol) and experimental (−68 ± 5 kcal/mol)25 solvation free energy of H2PO4–. For each solute, the calculated solvation free energies were averaged over 50 separate calculations, each calculation having a different position of the grid of solvent dipoles with respect to the solute.
In order to account for the polarization of the solute that is induced by the solvent, the ChemSol program models an electrostatic field of the solute by atomic charges that are calculated using the polarized continuum method (PCM). Atomic charges that were used in our LD calculations were fitted to the molecular electrostatic potential (ESP) that was calculated at the PCM/B3LYP/TZVP level using the Merz–Kollman set of atomic radii. The PCM calculations were carried out using the Gaussian 03 program and options scrf=(pcm, solvent=water), scfvac, radii=uahf, alpha=0.95, and noaddsphere.
Results
Free Energy Profiles for the Parent Substrate
Points that were used to map free energies for the parent compound X = O (Figure 1) along three possible reaction pathways are shown in Figure 3. The choice of the associative, synchronous, and dissociative pathways was guided by the free energy surfaces of phosphate diester reactions.6,12,15 After initial calculations, extra points were inserted along the associative, synchronous, and dissociative pathways to keep the calculated free energy difference between two adjacent points in the TS area below 1 kcal/mol. Additionally, we mapped free energy along the “tightness coordinate”31 that passes through the highest energy plateau in the direction that is approximately perpendicular to the synchronous pathway.
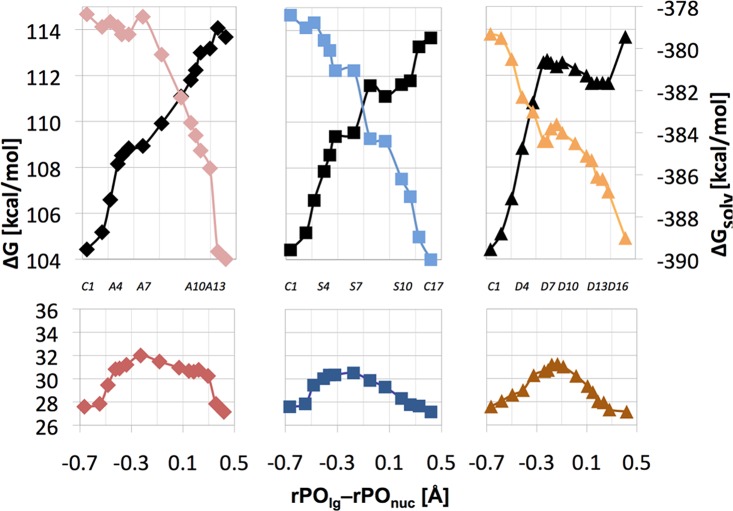
The free energy profiles for the mechanism involving unprotonated γ-phosphate (mechanism 2) at pH 7 are shown in the bottom section of Figure 4. The associative, synchronous, and dissociative pathways have activation free energies of 32.0, 30.5, and 31.3 kcal/mol, respectively. Since the synchronous pathway provides the lowest barrier at 30.5 kcal/mol, the position of its highest point at rPOnuc = 2.06 ± 0.05 Å and rPOlg = 1.88 ± 0.05 Å represents the TS for mechanism 2.
Figure 4.
Bottom: Relative free energy (ΔG, bottom) along the associative (left), synchronous (middle), and dissociative (right) pathway for mechanism 2 of reaction 3 in aqueous solution at pH 7. Top: The corresponding solvation (ΔGsolv, color, right y-axis scale) and gas-phase (black) energy components. Individual points along each reaction pathway can be associated with specific rPOlg and rPOnuc distances using labels defined in Figure 3. For easier orientation, some of these labels are also shown in the center portion of this figure.
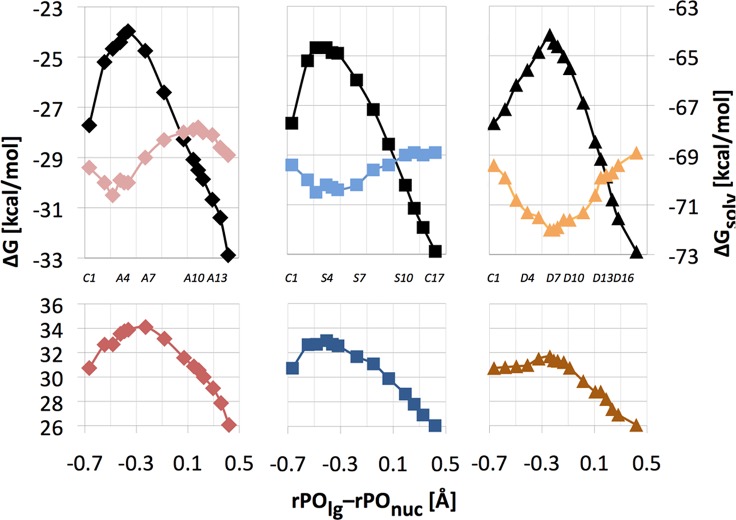
The individual gas-phase and solvation components of the free energy profiles (Step 4 in Supplementary Figure 1S) are shown in the upper part of Figure 4. The gas-phase energies rise as the −1-charged nucleophile approaches −2-charged methyl triphosphate complex. Concomitantly, solvation free energy of the reacting system becomes more negative, resulting in relatively flat free energy profiles, especially for the associative pathway. The compensation of gas-phase and solvation energetics occurs also for the tightness coordinate of the reaction free energy surface (Figure 5).
Figure 5.
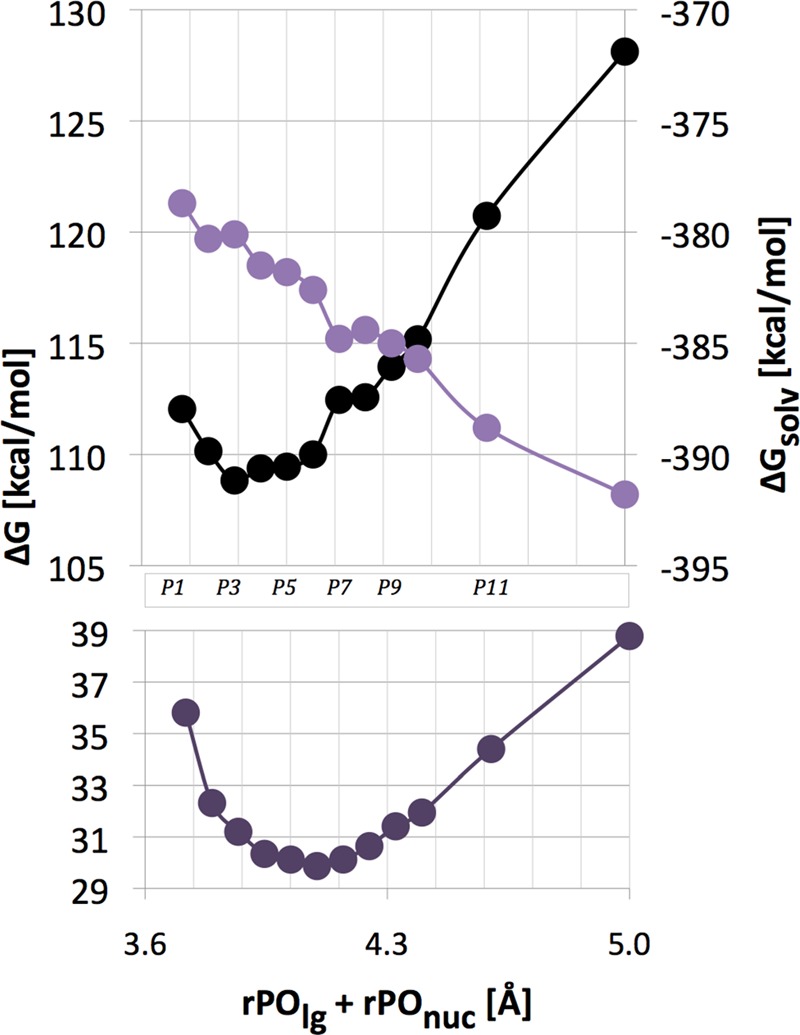
Bottom: Slice of the free energy surface for mechanism 2 of reaction 3 along the direction that is perpendicular to the reaction pathway (Figure 3). Top: The corresponding solvation (ΔGsolv, color, right y-axis scale) and gas-phase energy (black) components. Individual points can be associated with specific rPOlg and rPOnuc distances using labels defined in Figure 3. For easier orientation, some of these labels are also shown in the center portion of this figure.
Starting from the same reactant state (at pH 7) we also investigated an alternative reaction mechanism that involves the initial double protonation of the γ-phosphate (mechanism 1). This mechanism yields higher activation barriers of 34.1, 33.0, and 31.7 kcal/mol for the associative, synchronous and dissociative pathways, respectively (Figure 6). Thus, the reaction of the doubly protonated triphosphate proceeds via the dissociative pathway that is characterized by a looser TS (rPOnuc = 2.24 ± 0.05 Å and rPOlg = 2.00 ± 0.05 Å) for the rate-limiting step.
Figure 6.
Bottom: Relative free energy (ΔG, bottom) along the associative (left), synchronous (middle), and dissociative (right) pathway for mechanism 1 of reaction 3 in aqueous solution at pH 7. Top: The corresponding solvation (ΔGsolv, color, right y-axis scale) and gas-phase (black) energy components. Individual points along each reaction pathway can be associated with specific rPOlg and rPOnuc distances using labels defined in Figure 3. For easier orientation, some of these labels are also shown in the center portion of this figure.
Charge Distribution for the Parent Substrate
To interpret Brønsted LFER of phosphoryl transfer reactions31,32 and to provide quantitative data for the parametrization of empirical valence bond (EVB) methods,33 it is important to examine how the charges of atoms or groups change along various reaction coordinates. The NBO charges for the reactant, TS, and product states of the two mechanistic models of reaction 3, which differ in the total charge of the reacting system, are presented in Table 1. In both mechanisms, the total charge of the leaving group, which includes the complex of pyrophosphate (PPi) with the Mg2+ ion and three water molecules, decreases upon going from the methyl triphosphate reactant to the pyrophosphate product. This decrease is slightly larger (0.36 au) when the γ-phosphate is unprotonated (mechanism 2) than in mechanism 1 (0.32 au), the charge transfer to Olg contributing 33% and 45% of this change for mechanisms 2 and 1, respectively. Similar trends emerge from the analysis of Mulliken charges (Supplementary Table 2S). For both mechanisms, the shift of the electron density to the leaving group during the nucleotidyl transfer reaction is accompanied by depletion of the electron density on the nucleophile, which is modeled in our calculations by the THFO– moiety.
Table 1. Variation of Atom and Group Charges during Model Nucleotide Transfer Reactions in Aqueous Solution.
| total
chargea (au) |
|||||||
|---|---|---|---|---|---|---|---|
| atom/groupb | R∞ | R3.6 | TSA | TSS | TSD | P∞ | |
| Mechanism 2c | |||||||
| lg | –1.64 | –1.79 | –1.80 | –1.84 | –1.90 | –2.00 | |
| Olg | –1.11 | –1.15 | –1.15 | –1.17 | –1.19 | –1.28 | |
| nuc | –1.00 | –0.81 | –0.75 | –0.76 | –0.78 | –0.72 | |
| Onuc | –1.10 | –1.04 | –0.93 | –0.93 | –0.95 | –0.83 | |
| CH3PO3 | –0.36 | –0.40 | –0.44 | –0.40 | –0.32 | –0.28 | |
| Pα | 2..53 | 2..53 | 2..54 | 2.55 | 2..56 | 2.49 | |
| Pβ | 2.55 | 2.54 | 2.54 | 2..54 | 2..53 | 2.48 | |
| Pγ | 2.50 | 2.50 | 2.50 | 2.50 | 2.50 | 2.49 | |
| –1.19 | –1.20 | –1.23 | –1.22 | –1.19 | –1.19 | ||
| –1.20 | –1.20 | –1.23 | –1.23 | –1.24 | –1.25 | ||
| –1.25 | –1.26 | –1.26 | –1.26 | –1.26 | –1.26 | ||
| Mg | 1.48 | 1.54 | 1.58 | 1.58 | 1.58 | 1.52 | |
| Mechanism 1d | |||||||
| lg | 0.32 | 0.15 | 0.11 | 0.13 | 0.07 | 0.00 | |
| Olg | –1.11 | –1.13 | –1.13 | –1.14 | –1.17 | –1.22 | |
| nuc | –1.00 | –0.90 | –0.70 | –0.74 | –0.76 | –0.72 | |
| Onuc | –1.10 | –1.04 | –0.90 | –0.92 | –0.94 | –0.83 | |
| CH3PO3 | –0.32 | –0.37 | –0.41 | –0.39 | –0.30 | –0.28 | |
| –1.18 | –1.19 | –1.23 | –1.22 | –1.19 | –1.19 | ||
| Mg | 1.49 | 1.52 | 1.69 | 1.60 | 1.59 | 1.58 | |
Atomic charge or the sum of atomic charges for the group of atoms. NBO atomic charges that were calculated at the PCM/B3LYP/TZVP//HF/6-31G* level. R∞, R3.6, P∞, TSA, TSS, and TSD denote, respectively, infinitely separated reactants (i.e., THFO– and methyl triphosphate·Mg complex, Figure 1), reactants with an Onuc–Pα distance of 3.6 Å, infinitely separated products (i.e., phosphate diester and PPi·Mg complex), and transition states along the associative, synchronous, and dissociative pathways (Figure 3).
The nucleophile (nuc) includes all
atoms of the THFO moiety. The leaving group (lg) includes the complex
of Mg2+ ion with three water molecules and β- and
γ-phosphate groups. CH3PO3 denotes “Metaphosphate”
moiety that consists of Pα, O1, O2, O3 atoms and the methyl group.  ,
,  and
and  denote average of atomic
charges of nonbridging
oxygen atoms on the α-, β-, and γ-phosphate, respectively.
For atom numbering, see Figure 1.
See eq 2
See eq 1.
The leaving group NBO charge at the three TS (Table 1) is approximately halfway between reactant and product state. This charge becomes closer to its reactant value as the tightness of the TS increases (i.e., upon going to a more associative TS structure). The charge of the “metaphosphate” moiety, which consists of Pα, two nonbridging oxygen atoms and the -OCH3 group, becomes more negative by 0.08 au in the associative TS for the mechanism 1 but increases by 0.04 au in the dissociative TS. Similarly, each of the two nonbridging oxygen atoms on the α-phosphate (O1 and O2) shows a small but significant buildup of the electron density, Δq = −0.04 and −0.05 au for mechanisms 2 and 1, respectively, upon going from the reactant to the associative TS. This increase is diminished in the synchronous TS (Δq = −0.03 and −0.04 au) and dissociative TS (Δq = −0.002 and −0.01 au). While Δq for the metaphosphate changes sign as tightness of the TS decreases, charges on both the nucleophile and leaving group compensate for this change. These variations of NBO charges between the reactant and TS are validated by changes in the corresponding Mulliken charges (Supplementary Table 2S).
We describe structural variations of electron density using the NBO and Mulliken rather than ESP atomic charges because the ESP charges of large molecules tend to suffer from large conformation-dependent fluctuations. This deficiency especially affects charges of atoms that are buried inside large molecules, for example, phosphorus and oxygen atoms that are located in the P–O–P or P–O–Mg bridges. However, ESP charges tend to have more realistic magnitudes for application in classical force fields or the LD models (Supplementary Table 3S). Since the charge variations between the reactant and TS, or between the TS for different mechanisms, determine the electrostatic stabilization of these states by the enzyme active site, it is important to properly incorporate these charge effects into reactive force fields. For this purpose, adding NBO or Mulliken charge variations to the ESP charges of the reactant state would represent a reasonable parametrization strategy.
Structural Effects of the β–γ Phosphate Bridging Groups in the Reactant State
Recently, a series of guanidyl triphosphates with their β–γ bridging oxygen substituted by various methylene and halomethylene groups (Figure 1) have become available.2−5 These compounds were shown to bind to pol β and to alter the reactant and TS properties for the nucleotide-transfer reaction.
The PC bonds in β–γ-substituted methyl triphosphates are significantly longer than the corresponding bridging PO bonds for the parent triphosphate: the bridging Pβ–O and Pγ–O distances are 1.574 and 1.696 Å, respectively, while the corresponding average P–C distances are 1.858 ± 0.03 and 1.909 ± 0.03 Å. The double protonation of γ-phosphate lengthens the Pβ–O bond to 1.659 Å and shortens the Pγ–O bond to 1.565 Å; a similar trend occurs for the substituted triphosphates. The longer P–C bonds are compensated by Pβ–C–Pγ angles that are more acute than the Pβ–O–Pγ angle, resulting in similar distances between Pβ and Pγ atoms. Thus, the methylene and halomethylene β–γ substitutions do not significantly perturb the calculated Mg2+ coordination geometry.
The length of the scissile Pα–Olg bond in the unprotonated methyl triphosphate complexes varies from 1.616 to 1.632 Å; these distances agree reasonably well with the distance of 1.608 Å observed in the ternary complex of pol β (PDB code 1BPY).34 The double protonation of the γ-phosphate tends to slightly lengthen this bond length (Figure 7). Interestingly, compounds with the highest pKa of the Olg atom in the corresponding bisphosphonate leaving group (PO3–CH2–PO34–) have the shortest Pα–Olg bond. In fact, further analysis shows a linear trend between the pKa of Olg and the scissile bond length for both unprotonated and protonated methyl triphosphate complexes (Figure 7). The calculated pKa-dependence of this bond length agrees well with the structural substituent effects observed by Jones and Kirby for phosphate mono- and triesters.35,36
Figure 7.
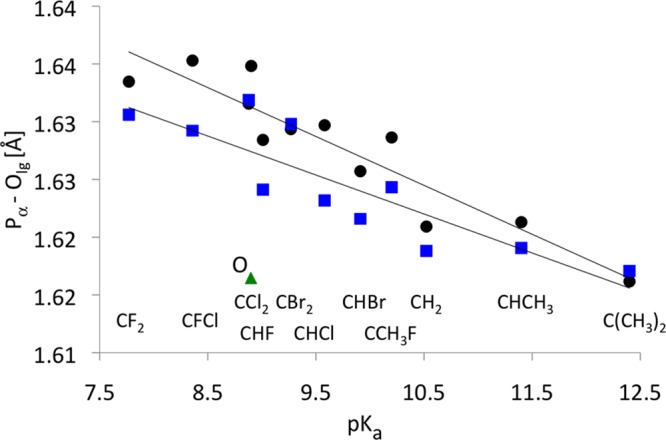
Calculated Pα–Olg bond length for methyl triphosphate complexes, averaged over two diastereomers (Figure 1), are plotted as a function of the corresponding experimental pKa of PPi and the substituted bisphosphonates.5 The correlation coefficients are R = 0.93 and 0.87 for the doubly protonated (black circle, slope −0.00423) and unprotonated triphosphates (blue square, slope −0.00338), respectively. The green triangle is for the parent O compound in the dianion system that was not included in the linear fit line for unprotonated triphosphates.
As the pKa of PPi and the β–γ-substituted bisphosphonates decreases, the NBO charges of the Olg, O4, and O5 atoms bonded to Pβ of the corresponding methyl triphosphate become less negative (Figure 8, Supplementary Figure 2S and Table 7S), and the corresponding Mulliken charges show similar correlations (Supplementary Figure 3S). Consistent with this trend, the “metaphosphate” (CH3PαO3) (Supplementary Figure 4S) and nonbridging oxygen atoms on α- and γ-phosphate also become less negative as the leaving group pKa decreases. This excess negative charge flows into the bridging group and the two adjacent phosphorus atoms (Figure 8).
Figure 8.
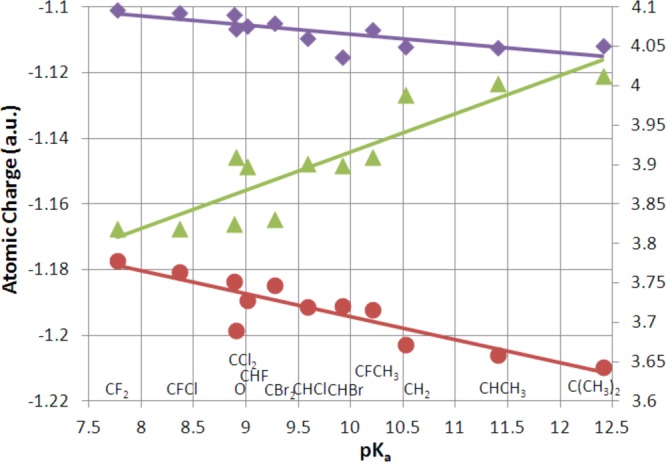
Relationship between the experimental pKa of the leaving group (PPi or its bisphosphonate analogues) and the selected NBO charges of the [Mg·3H2O·methyl triphosphate]2– complex and its analogues. The purple diamonds (slope = −0.0028, R = 0.78), red circles (slope = −0.007, R = 0.89), and green triangles (slope =0.049, R = 0.90) represent the Olg charge, average of the charges of the two nonbridging O atoms on β-phosphate, and the sum of charges on the X group (Figure 1), Pβ and Pγ, respectively. Values of the Xtot + Pβ + Pγ charge are depicted along the y-axis on the right.
The γ-phosphate protonation does not affect the local scissile bond polarity. That is, Olg is more negative than the CH3PαO3 moiety by 0.746 and 0.788 au for unprotonated and doubly protonated methyl triphosphates in solution, respectively. The difference in the charge of the CH3PαO3 moiety and the remaining part of the methyl triphosphate was 2.982 and 2.254 au for unprotonated and protonated compounds, respectively. In the absence of electron transfer between the two halves, one would expect double protonation of γ-phosphate to result in the charge difference of 0.982 au. Thus, the actual charge difference of 2.254 au shows that the γ-phosphate protonation represents a significantly larger electron withdrawing effect than even the most electron-withdrawing moiety, the -CF2- substitution, of the β–γ bridging oxygen.
Kinetic and Equilibrium Effects of the β–γ Phosphate Bridging Groups
Since Brønsted LFER37,38 is usually expressed as a linear relationship between the substituent-induced changes in the logarithm of the rate constant of the studied reaction (log k) and changes in pKa of the leaving group,
| 4 |
an important quantity for the LFER analysis of our system is the pKa of Olg in the product state (i.e., PPi for X = O and β,γ-X-bisphosphonates for X ≠ O, Figure 1). In our particular case, k corresponds to the rate constant for the nucleotidyl transfer reaction (reaction 3), and the pKa corresponds to the protonation of PPi or bisphosphonate. More specifically, for mechanisms 1 and 2, pKa corresponds, respectively, to the equilibrium between H3PPi–1 and H2PPi2– (pKa2) and HPPi3– and PPi4– (pKa4) with X = O and to analogous pKa constants of β,γ-X-bisphosphonates. The validity of eq 4 is difficult to justify theoretically; however, the corresponding LFER is frequently utilized31,39 since it serves as a practical surrogate for the theoretically established linear free energy relationship between the activation (Δg⧧) and reaction (ΔGr) free energies,
| 5a |
Validity of eq 5a can be derived for a single-step reaction, in which the free energy surface in the reactant and product states can be described as a quadratic function of the reaction coordinate called a Marcus parabola. The activation barrier is determined by the intersection of the two Marcus parabolas of equal curvature.40,41 This approach has been generalized for multistep reaction mechanisms for the hydrolysis of phosphate monoesters.39 In addition, Rosta and Warshel have recently established that during SN2 reactions the magnitude of coupling between the two Marcus parabolas is not affected by chemical substitutions.42
Because ΔGr = −2.303RT log Keq and ΔΔg⧧ = −2.303RT Δlog k,43 eq 5a can be equivalently presented as log k versus log Keq, where Keq is the equilibrium constant for the reaction
| 5b |
Replacing the relationship of eq 5a with eq 4 is convenient because in most cases the pKa of the leaving group is significantly easier to measure than Keq. Furthermore, because the free energy of the PPi product (X = O, bisphosphonate for X ≠ O) factors into both Ka and Keq, it is usually assumed32 that these equilibrium constants are linearly related,
| 6 |
Combining eq 5b and 6 implies the relationship
| 7 |
and validity of eq 4, which is supported by the observed kinetics of many phosphoryl transfer reactions.31
On the basis of the experimental data for pol β3 and model diester compounds in solution,44 a change of the acidity of the leaving group by 1 pKa unit results in a change of the activation free energy by about 1 kcal/mol. Thus, the need for accurate reproduction of the observed LFER effects puts extreme demands on the precision of the calculated energetics in solution.
The calculated free energy for reaction 2 in aqueous solution shows a linear correlation with the experimental pKa4 of PPi and β–γ-X-bisphosphonates that is characterized by a slope of 1.27 (Table 2). This linear relationship implies βeq value of −0.93 (eq 6), which is consistent with the close correlation between Ka and Keq that has been empirically confirmed for phosphate monoester hydrolysis.32
Table 2. Calculated Gas-Phase Reaction Energies (ΔEgas,0), Reaction Free Energies in Aqueous Solution (ΔGr,0), Gas-Phase Activation Free Energies (ΔE⧧gas), and Activation Free Energies in Aqueous Solution (ΔG⧧) for Reaction 2 Involving β–γ-Substituted Methyl Triphosphate Analoguesa.
| X | isomerb | pKa4c | ΔEgas,0 (kcal/mol) | ΔGr,0 (kcal/mol) | ΔE⧧gas (kcal/mol) | ΔG⧧ (kcal/mol) |
|---|---|---|---|---|---|---|
| CF2 | 7.8 | 1.3 | –16.3 | 103.5 | 20.9 | |
| CFCl | S | 8.4 | 7.7 | –14.5 | 104.2 | 21.9 |
| CClF | R | 8.4 | –3.3 | –16.3 | 99.4 | 20.1 |
| CCl2 | 8.8 | 5.4 | –15.4 | 101.1 | 21.7 | |
| O | 8.9 | 3.2 | –15.9 | 107.9 | 22.4 | |
| CHF | S | 9.0 | –2.2 | –13.8 | 102.7 | 23.8 |
| CFH | R | 9.0 | 3.7 | –13.0 | 103.3 | 22.0 |
| CBr2 | 9.3 | –1.2 | –14.5 | 96.2 | 23.0 | |
| CHCl | S | 9.5 | 4.1 | –10.4 | 105.0 | 23.7 |
| CClH | R | 9.5 | 3.0 | –17.8 | 104.8 | 22.5 |
| CHBr | S | 9.9 | 8.6 | –16.1 | 108.1 | 24.8 |
| CBrH | R | 9.9 | 9.7 | –12.4 | 109.2 | 23.7 |
| CFCH3 | R | 10.2 | 14.1 | –15.5 | 106.0 | 23.6 |
| CCH3F | S | 10.2 | –1.6 | –12.7 | 103.6 | 25.0 |
| CH2 | 10.5 | 5.9 | –12.8 | 106.2 | 25.5 | |
| CHCH3 | S | 11.6 | 8.0 | –11.0 | 105.7 | 25.6 |
| CCH3H | R | 11.6 | 4.9 | –11.2 | 104.5 | 25.1 |
| C(CH3)2 | 12.3 | 12.3 | –10.7 | 108.2 | 25.8 | |
| sloped | 2.21 | 1.27 | 1.23 | 1.23 | ||
| Rd | 0.76 | 0.94 | 0.46 | 0.94 |
Note that the data in this table utilize the reactant and product protonation states shown in eq 2 (reaction 2) to evaluate energy differences.
The R- or S-stereoisomers. Atoms bound to the chiral center (bridging C) are ordered with the lowest atomic number atom pointing away and the remaining atoms from Pβ to Pγ to the remaining substitutent are ordered clockwise in the R-form. This means that when looking from Pβ to bridging C to Pγ, the heavier substituent is on the left in the R-form.
Reference (5).
Slope and R denote the slope of the linear interpolation of energy as a function of pKa and the correlation coefficient, respectively. Diastereomer energies were averaged.
By adding 7.8 kcal/mol for the protonation of the nucleophile (Supplementary Figure 1S) and by subtracting 2.6 kcal/mol for the protonation of PPi (pKa = 8.9) to the calculated value for the parent rection 2 (ΔGr = −15.9 kcal/mol, Table 2), we obtain the ΔGr° = −10.7 kcal/mol that corresponds to the most stable reactant and product states at pH 7. This calculated reaction free energy agrees reasonably well with the experimental free energy of ATP hydrolysis to AMP and PPi reported by Jencks (−7.7 kcal/mol, pH 7)45 and Schuegraf (−10.3 kcal/mol, pH 7.5).46
The calculated activation free energies trend linearly with the calculated ΔGr for the reaction 2. That is, when we fixed the Pα–Onuc and Pα–Olg distances at 2.06 and 1.88 Å, which corresponds to the synchronous TS for mechanism 2 (point S7 in Figure 3), while relaxing remaining coordinates except the backbone torsional angles (see Methods), we obtained a linear trend of eq 5a with the slope β′ = 0.73 and a correlation coefficient R = 0.85. Similarly, we obtained β′ = 0.71 and R = 0.81 for the associative TS (point A7 in Figure 3) and β′ = 0.86 and R = 0.85 for the dissociative TS (point D9 in Figure 3). Thus, as expected,31 tightening the TS yields an LFER relationship with a smaller slope.
The data presented in the previous paragraph were generated by considering the individual points for the parent, dihalogenated, methylene, and dimethyl compounds, and the average free energy of each pair of diastereomers. Since the synchronous and dissociative TS show undistinguishable free energies (considering their error bar), whereas those for associative TS are systematically higher, we improved the quality of the linear fit by averaging over activation free energies for the synchronous and dissociative TS, yielding β′ of 0.79 (Figure 9) that corresponds to βlg = −0.73 (eq 7). This averaging of the two TS could be used to lower the data noise because the free energy surface is very flat in the TS region. By considering compounds protonated on γ-phosphate as a natural extension of the range of the substituent effects in terms of available reaction free energy values, we obtain linear correlations with β′ = 0.59 (Supplementary Figure 5S) and βlg = −0.55. Finally, direct correlation of the calculated log k and experimental pKa4 yielded βlg = −0.89 with a correlation coefficient of 0.94 (Figure 10).
Figure 9.
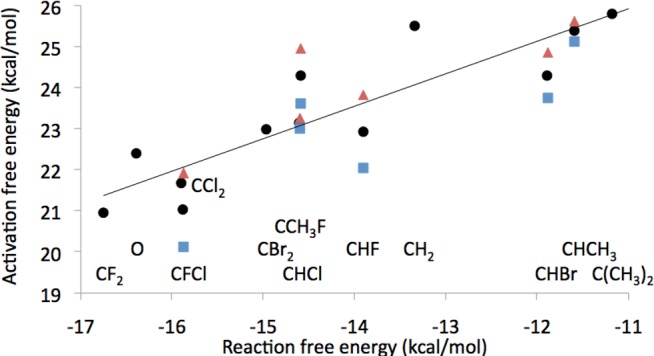
Relationship between calculated activation free energy and calculated reaction free energy for reaction 2 (eq 2). The reaction free energy values for the stereoismeric compounds (i.e., data on the x-axis) were averaged over the two diastereomers, while activation free energies were allowed to show stereoismeric effects. S-form diastereomers, R-form diastereomers, and average of S- and R-form diastereomers with other compounds, are shown as red triangles, blue squares, and black circles (β′ = 0.79, R = 0.89), respectively.
Figure 10.
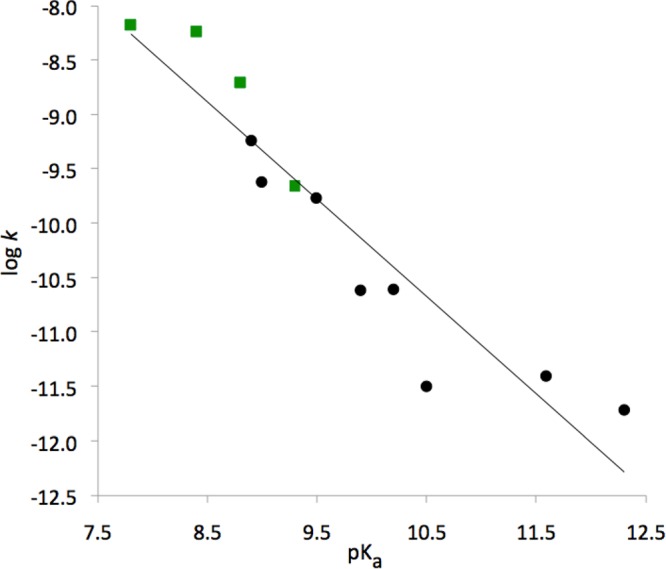
Linear relationship (βlg = −0.89, R = 0.94) between experimental pKa’s of the leaving groups (PPi or its bisphosphonate analogues)5 and the logarithm of the rate constants calculated for the mechanism 2 (eq 2) at pH 7 and 298 K. Green squares denote data for dihalogenated compounds.
R-Diastereomers have systematically lower activation free energies than the S-diastereomers (Figure 9). The stereoisomeric effects for the average synchronous and dissociative TS energies decrease by 1.79, 1.76, 1.34, 1.17, 1.10, and 0.50 kcal/mol for CClF, CFH, CFCH3, CClH, CBrH, and CCH3H, respectively. Similar R-form preference has been observed in pol β kinetic experiments where an incoming β–γ-substituent guanine is inserted opposite cytosine with a stereospecificity4 of 0.41 (0.62 with G opposite T) and 0.28 (1.00 with G opposite T) kcal/mol for CHF and CHCl, respectively. Previously, researchers have attributed this difference to the interaction of the dipole of the halogen bond with the Arg183 residue in the pol β active site;4 interestingly, our data show a significant R-form preference even in the absence of the protein. Unfortunately, the decomposition of the calculated stereoisomeric energy differences into structural components is not feasible due to the small magnitude of these differences and inherent nonadditivity of quantum-mechanical energies and solvation free energies.
Effects of the β–γ Phosphate Bridging Groups on the TS Charge Distribution
The substituent effects on pKa constants of organic compounds are often attributed to through-bond induction effects that result in the withdrawal or donation of electron density from or to the protonation site.38 In our specific case, substituted dNTPs with lower leaving group pKa's have atoms at the β–γ-X-phosphate bridging position that are expected to show greater electron-withdrawing propensity. As the pKa increases, electron density withdrawing effects should lessen and electron-donating should become more evident. Indeed, in both protonated and unprotonated methyl triphosphate complexes (RS), and all TS, the Olg charge, the average of O1 and O2 charges, and the average of O4 and O5 charges all became more negative as the pKa of the leaving group increased, while the opposite was calculated for the charge of the Pβ + Xtot + Pγ group (Figure 1, Supplementary Table 7S).
However, for most atoms and groups, these pKa correlations disappeared when the charge difference between TS and the RS, ΔQ = Q(TS) – Q(RS), was considered. The two exceptions included the CH3PO3, i.e. “metaphosphate” moiety, and Olg in mechanism 1 (Supplementary Table 7S). The ΔQ value for CH3PO3 became more negative as pKa of the leaving group decreased but less negative for Olg. These two events occur with relation to one another, as the ΔQ for Olg correlates strongly with ΔQ for CH3PO3.
Discussion
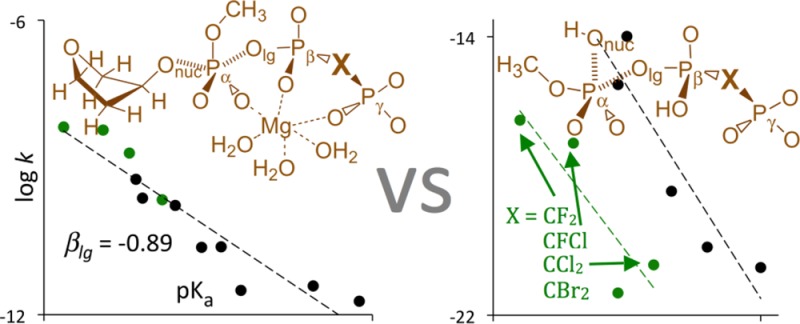
The first motivation for the present study was to verify that the unusual irregular Brønsted LFER that was observed for the insertion of β–γ-modified dGTP substrates into DNA by pol β2,3 occurs also in the corresponding nonenzymatic reactions as suggested by Kamerlin et al.6 More specifically, we wanted to verify the plot of kpol as a function of pKa4 of the free bisphosphonic acid corresponding to the leaving group that showed both experimentally in pol β (Figure 11A) and computationally in aqueous solution (Figure 11B) two distinctly different linear correlations, one for monohalogenated and the other for dihalogenated substituents.
Figure 11.
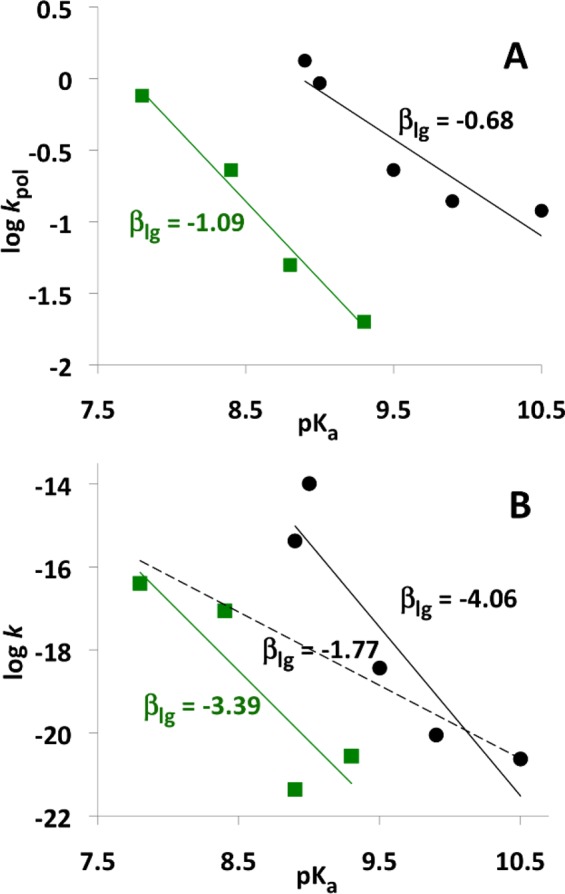
Linear relationships between experimental pKa's of the leaving groups (PPi or its bisphosphonate analogues)5 and the logarithm of the rate constant for (A) the insertion of dGTP and its β–γ bisphosphonate analogues opposite dT by pol β3 at 37 °C and (B) hydrolysis of methyl triphosphate and its β–γ bisphosphonate analogues in aqueous solution at 37 °C.6 Green squares denote data for dihalogenated compounds.
The nonenzymatic hydrolysis of β–γ-modified dGTPs in aqueous solution is difficult to be studied experimentally due to very long reaction times47,48 and the necessity to distinguish between mechanisms that involve nucleophilic attack on α- and β-phosphate. Therefore, Kamerlin et al. carried out a computational study of hydrolysis of β–γ-substituted methyl triphosphate4– in aqueous solution by H2O attack on Pα.6 For the nine studied compounds, Kamerlin et al. separately mapped the free energy surface by scanning fixed POnuc and POlg distances with 0.15 and 0.2 Å increments, respectively, fully optimized all remaining internal coordinates of the reacting system at the gas-phase B3LYP/6-31+G* level, and included solvation free energies at the LD or PCM level. Because these calculations yielded a similar pattern of the LFER separation between compounds containing mono- and dihalogenated substituents as experimental pol β essays (Figure 11), it was concluded that this peculiar LFER behavior is mainly due to solvation effects.6
Because conformational equilibria of phosphate diesters in aqueous solution are characterized by several states of similar stability that are separated by low torsional barriers,49,50 large conformational variability can be expected also for methyl triphosphates. However, Kamerlin et al. did not examine free energies of possible multiple conformational minima. Thus, the agreement with the experimentally observed mono- and dihalogen LFER separation calculated by Kamerlin could be a coincidence caused by a subset of compounds converging to a higher energy conformation. In fact, Figure 6 in ref (6) shows a TS structure in which the methyl group on the pentavalent α-phosphate (pseudo)rotated from its initial equatorial position to the apical position, a process that should not be allowed to occur during a concerted in-line attack on α-phosphate. It is quite possible that this pseudorotation occurred only for some of the compounds calculated by Kamerlin et al. Furthermore, the reaction mechanism of Kamerlin et al. employs proton transfer from the nucleophilic water to the nonbridging oxygen on β-phosphate. Although this protonation might explain the calculated LFER splitting, it is unlikely to occur in aqueous solution or the pol β active site due to low pKa of the acceptor oxygen atom.
Our suspicion that Kamerlin et al. results were affected by numerical instability was reinforced by the fact that the βlg coefficients of −3.39 and −4.06 for the di- and monohalo-substituted methyl triphosphates, respectively, which we obtained by converting activation free energies published by Kamerlin et al. to log k at 310 K, were significantly larger (in absolute value) than the corresponding experimental βlg. Moreover, when we made a new linear fit that considered all of the kinetic data (dashed line in Figure 11B), the corresponding correlation coefficient R decreased to 0.53 but the resulting βlg of −1.77 was much closer to the experimental βlg (Figure 11A).
To increase the precision and stability of our activation free energies, we increased the pKa range and number of the studied compounds, neglected substituent effects on the POlg and POnuc distances in the TS, and considered only an in-line nucleophilic attack and a single triphosphate conformation. Here, a natural choice was to use the three crystallographic torsional angles from the triphosphate chain of dCTP bound in the active site of pol β.7 Small torsional movements during the catalytic reaction that were revealed by time-lapse crystallography (Supplementary Table 1S)22 suggest that this was an appropriate approximation. Additionally, in order to obtain realistic geometries in aqueous solution and support the use of a smaller quantum-mechanical basis set, we reduced the total solute charge by including an explicitly hydrated structural Mg2+ ion into our model system. The intended goal of our model, to generate sufficiently stable and also realistic free energies for a series of chemically similar compounds, appears to have been achieved.
Our calculations did not confirm the results of Kamerlin et al. but showed that all β–γ-modified methyl triphosphates follow a single Brønsted LFER line with a βlg of −0.89 (Figure 10). This slope reflects the POnuc and POlg distances being in the 2.05–2.15 Å and 1.90–2.05 Å range, respectively. The free energy surface in the rectangular area between these two points is within the relative accuracy of our calculations (1 kcal/mol) and is equal to 30 kcal/mol (for the parent methyl triphosphate in 1 M concentration, pH 7 and 298 K). The absolute accuracy of this activation free energy is difficult to estimate since there are many possible sources of computational errors that may or may not cancel upon going from the reactant state to TS. One such source, namely, the effect of a small difference in the geometry of the studied compounds, can be estimated from our data. Since we have calculated the activation free energy using both the geometry optimized in the gas phase (30.5 kcal/mol, HF/6-31G*, Figure 4) and in water modeled by dielectric continuum (30.2 kcal/mol, PCM/HF/6-31G*), this geometry-related error is negligibly small. Furthermore, changing the quantum mechanical method to LD/PCM/B3LYP/6-31+G*//PCM/B3LYP/6-31+G* yielded activation free energy of 30.1 kcal/mol. However, the magnitude of these method-dependent deviations could be significantly larger if the triphosphate torsions were fully relaxed.
Although the calculated POlg and POnuc distances in the TS imply that this TS has a large contribution of bond making and a smaller contribution of POlg bond breaking, the calculated βlg of −0.89 is close to βeq = −0.93, which reflects the limiting case of the POlg bond being fully broken. The large βlg value occurring even for the TS that occurs quite early on the reaction coordinate can be rationalized by the electron withdrawal from the “metaphosphate” portion of the molecule in compounds with low leaving group pKa's. The resulting slightly more positive charge facilitates a lower activation barrier for the attack by the negative nucleophile. Nevertheless, as indicated by the calculated βlg variation along the tightness coordinate and by longer POlg bond length in the compounds with lower leaving group pKa's (Figure 7), the dominant contribution to βlg still originates from the POlg bond breaking.
In conclusion, the splitting of LFER lines observed in pol β is not due to general solvation effects. Since the structural Mg2+ ion and torsional constraints characteristic of the pol β active site were included in our model, it is also unlikely that the LFER splitting would be caused by systematic alteration of Mg2+–halogen interactions or intramolecular steric or electrostatic effects upon going from monohalogenated to dihalogenated bisphosphonates. These exclusions point to differences in specific interactions with the enzyme active site, including possible effects of γ-phosphate monoprotonation or changes in the catalytic mechanism as the cause of the splitting effect. Although the LFER slope and its splitting could be also altered “intrinsically”, by significant changes in the conformations of the substrates bound in the pol β, these conformational effects were not evaluated in this study, nor were they observed crystallographically.51
Acknowledgments
We thank Prof. Charles E. McKenna and Dr. Boris A. Kashemirov for sending us their experimental pKa values prior to their publication. We thank former lab members Dr. Martin Klvana, Dr. James Borden, and Mr. Kiran Thalody for assistance and helpful discussions.
Glossary
Abbreviations
- DNA
deoxyribonucleic acid
- dNTP
deoxyribonucleoside triphosphates
- PPi
pyrophosphate
- TS
transition state
- LFER
linear free energy relationship
- THFO–
tetrahydrofuranolate
- HF
Hartree–Fock
- dCTP
deoxycytidine triphosphate
- TZVP
triple-ζ valence polarized
- LD
Langevin dipoles
- PCM
polarized continuum model
- ESP
electrostatic potential
- NBO
natural bond orbitals
- PDB
protein database
- R
Pearson correlation coefficient
- pol β
human DNA polymerase β
Supporting Information Available
Flow chart of the free energy surface calculations, relationships between pKa of the leaving group and the NBO and Mulliken charges of select atoms, variation of charges of atoms and groups during model nucleotide transfer reactions in aqueous solution, β–γ substituent effects on charges of atoms and groups, calculated reaction and activation energies in gas phase and aqueous solution, relationships between activation and reaction free energies, and conformational variability of the triphosphate chain of dNTP substrates bound to DNA polymerases. This material is available free of charge via the Internet at http://pubs.acs.org.
This work was supported by the National Institutes of Health Program Project Grant 5U19CA105010.
The authors declare no competing financial interest.
Funding Statement
National Institutes of Health, United States
Supplementary Material
References
- Kornberg A., and Baker T. A. (1992) DNA Replication, W. H. Freeman, New York. [Google Scholar]
- Sucato C. A.; Upton T. G.; Kashemirov B. A.; Osuna J.; Oertell K.; Beard W. A.; Wilson S. H.; Florián J.; Warshel A.; McKenna C. E.; Goodman M. F. (2007) Modifying the β, γ-gamma. Leaving-Group Bridging Oxygen Alters Nucleotide Incorporation Efficiency, Fidelity, and the Catalytic Mechanism of DNA Polymerase β. Biochemistry 46, 461–471. [DOI] [PubMed] [Google Scholar]
- Sucato C. A.; Upton T. G.; Kashemirov B. A.; Osuna J.; Oertell K.; Beard W. A.; Wilson S. H.; Florián J.; Warshel A.; McKenna C. E.; Goodman M. F. (2008) DNA Polymerase β Fidelity: Halomethylene-Modified Leaving Groups in Pre-Steady-State Kinetic Analysis Reveal Differences at the Chemical Transition State. Biochemistry 47, 870–879. [DOI] [PubMed] [Google Scholar]
- Oertell K.; Wu Y.; Zakharova V. M.; Kashemirov B. A.; Shock D. D.; Beard W. A.; Wilson S. H.; McKenna C. E.; Goodman M. F. (2012) Effect of β, γ-CHF- and β, γ-CHCl-dGTP Halogen Atom Stereochemistry on the Transition State of DNA Polymerase β. Biochemistry 51, 8491–8501. [DOI] [PMC free article] [PubMed] [Google Scholar]
- Oertell K.; Chamberlain B. T.; Wu Y.; Ferri E.; Kashemirov B. A.; Beard W. A.; Wilson S. H.; McKenna C. E.; Goodman M. F. (2014) The Transition-State in DNA Polymerase β Catalysis: Rate-limiting Chemistry Altered by Base-Pair Configuration. Biochemistry 53, 1842–1848. [DOI] [PMC free article] [PubMed] [Google Scholar]
- Kamerlin S. C. L.; McKenna C. E.; Goondman M. F.; Warshel A. (2009) A Computational Study of the Hydrolysis of dGTP Analogues with Halomethylene-Modified Leaving Groups in Solution: Implications for the Mechanism of DNA Polymerases. Biochemistry 48, 5963–5971. [DOI] [PMC free article] [PubMed] [Google Scholar]
- Batra V. K.; Beard W. A.; Shock D. D.; Krahn J. M.; Pedersen L. C.; Wilson S. H. (2006) Magnesium-induced assembly of a complete DNA polymerase catalytic complex. Structure 4, 757–766. [DOI] [PMC free article] [PubMed] [Google Scholar]
- Williams N. H. (2000) Magnesium Ion Catalyzed ATP Hydrolysis. J. Am. Chem. Soc. 122, 12023–12024. [Google Scholar]
- Mucha A.; Knobloch B.; Jezowska-Bojczuk M.; Kozłowski H.; Sigel R. K. O. (2008) Comparison of the Acid–Base Properties of Ribose and 2′-Deoxyribose Nucleotides. Chem.—Eur. J. 14, 6663–6671. [DOI] [PubMed] [Google Scholar]
- Sigel H.; Bianchi E. M.; Corfu N. A.; Kinjo Y.; Tribolet R.; Martin R. B. (2001) Acid–Base Properties of the 5′-Triphosphates of Guanosine and Inosine (GTP4- and ITP4-) and of Several Related Nucleobase Derivatives. J. Chem. Soc., Perkin Trans. 2 507–511. [Google Scholar]
- Izatt R. M.; Rytting H.; Hansen L. D.; Christensen J. J. (1966) Thermodynamics of Proton Dissociation in Dilute Aqueous Solution. V. An Entropy Titration Study of Adenosine, Pentoses, Hexoses, and Related Compounds. J. Am. Chem. Soc. 88, 2641–2645. [DOI] [PubMed] [Google Scholar]
- Rosta E.; Kamerlin S. C. L.; Warshel A. (2008) On the Interpretation of the Observed Linear Free Energy Relationship in Phosphate Hydrolysis: A Thorough Computational Study of Phosphate Diester Hydrolysis in Solution. Biochemistry 47, 3725–3735. [DOI] [PubMed] [Google Scholar]
- Frisch M. J.et al. (2004) Gaussian03M (revision C.02), Gaussian, Inc., Wallingford. [Google Scholar]
- Becke A. D. (1993) Density-Functional Thermochemistry. III. The Role of Exact Exchange. J. Chem. Phys. 98, 5648–5652. [Google Scholar]
- Borden J.; Crans D. C.; Florian J. (2006) Transition State Analogues for Nucleotidyl Transfer Reactions: Structure and Stability of Pentavalent Vanadate and Phosphate Ester Dianions. J. Phys. Chem. B 110, 14988–14999. [DOI] [PubMed] [Google Scholar]
- Doublie S.; Tabor S.; Long A. M.; Richardson C. C.; Ellenberger T. (1998) Crystal Structure of Bacteriophage T7 DNA Replication Complex at 2.2 A Resolution. Nature 391, 251–258. [DOI] [PubMed] [Google Scholar]
- Bebenek K.; Pedersen L. C.; Kunkel T. A. (2011) Replication Infidelity via a Mismatch with Watson-Crick Geometry. Proc. Natl. Acad. Sci. U.S.A. 108, 1862–1867. [DOI] [PMC free article] [PubMed] [Google Scholar]
- Wang W.; Hellinga H. W.; Beese L. S. (2011) Structural Evidence for the Rare Tautomer Hypothesis of Spontaneous Mutagenesis. Proc. Natl. Acad. Sci. U.S.A. 108, 17644–17648. [DOI] [PMC free article] [PubMed] [Google Scholar]
- Li Y.; Korolev S.; Waksman G. (1998) Crystal Structures of Open and Closed Forms of Binary and Ternary Complexes of the Large Fragment of Thermus aquaticus DNA Polymerase I: Structural Basis for Nucleotide Incorporation. EMBO J. 17, 7514–7525. [DOI] [PMC free article] [PubMed] [Google Scholar]
- Biertumpfel C.; Zhao Y.; Kondo Y.; Ramon-Maiques S.; Gregory M.; Lee J. Y.; Masutani C.; Lehmann A. R.; Hanaoka F.; Yang W. (2010) Structure and Mechanism of Human DNA Polymerase eta. Nature 465, 1044–1048. [DOI] [PMC free article] [PubMed] [Google Scholar]
- Garcia-Nafria J.; Burchell L.; Takezawa M.; Rzechorzek N. J.; Fogg M. J.; Wilson K. S. (2010) The Structure of the Genomic Bacillus subtilis dUTPase: Novel Features in the Phe-lid. Acta Crystallogr. D66, 953–961. [DOI] [PubMed] [Google Scholar]
- Nakamura T.; Zhao Y.; Yamagata Y.; Hua Y.-j.; Yang W. (2012) Watching DNA Polymerase η Make a Phosphodiester Bond. Nature 487, 196–201. [DOI] [PMC free article] [PubMed] [Google Scholar]
- Freudenthal B. D.; Beard W. A.; Shock D. D.; Wilson S. H. (2013) Observing a DNA Polymerase Choose Right from Wrong. Cell 154, 157–168. [DOI] [PMC free article] [PubMed] [Google Scholar]
- Frisch M. J.et al. (2009) Gaussian 09, rev. A.02, Gaussian, Inc., Wallingford. [Google Scholar]
- Florián J.; Warshel A. (1997) Langevin Dipoles Model for Ab Initio Calculations of Chemical Processes in Solution: Parametrization and Application to Hydration Free Energies of Neutral and Ionic Solutes and Conformational Analysis in Aqueous Solution. J. Phys. Chem. B 101, 5583–5595. [Google Scholar]
- Florián J.; Warshel A. (1999) Calculations of Hydration Entropies of Hydrophobic, Polar, and Ionic Solutes in the Framework of the Langevin Dipoles Solvation Model. J. Phys. Chem. B 103, 10282–10288. [Google Scholar]
- Florián J.; Warshel A. (1998) Phosphate Ester Hydrolysis in Aqueous Solution: Associative versus Dissociative Mechanisms. J. Phys. Chem. B 102, 719–734. [Google Scholar]
- Strajbl M.; Florián J.; Warshel A. (2000) Ab Initio Evaluation of the Potential Suface for General Base-Catalyzed Methanolysis of Formamide: A Reference Solution Reaction for Studies of Serine Proteases. J. Am. Chem. Soc. 122, 5354–5366. [Google Scholar]
- Strajbl M.; Florián J.; Warshel A. (2001) Ab Initio Evaluation of the Free Energy Surfaces for the General Base/Acid Catalyzed Thiolysis of Formamide and the Hydrolysis of Methyl Thioformate: A Reference Solution Reaction for Studies of Cysteine Proteases. J. Phys. Chem. B 105, 4471–4484. [Google Scholar]
- Bren U.; Zupan M.; Guengerich F. P.; Mavri J. (2006) Chemical Reactivity as a Tool to Study Carcinogenicity: Reaction between Chloroethylene Oxide and Guanine. J. Org. Chem. 71, 4078. [DOI] [PubMed] [Google Scholar]
- Lassila J. K.; Zalatan J. G.; Herschlag D. (2011) Biological Phosphoryl-Transfer Reactions: Understanding Mechanism and Catalysis. Annu. Rev. Biochem. 80, 669–702. [DOI] [PMC free article] [PubMed] [Google Scholar]
- Bourne N.; Williams A. (1984) Effective Charge on Oxygen in Phosphoryl Group Transfer from an Oxygen Donor. J. Org. Chem. 49, 1200–1204. [Google Scholar]
- Warshel A., and Florián J. (2004) The Empirical Valence Bond (EVB) Method, in The Encyclopedia of Computational Chemistry (von Ragué Schleyer P., Allinger N. L., Clark T., Gasteiger J., Kollman P. A., Schaefer H. F. III, and Schreiner P. R., Eds.), John Wiley & Sons, Chichester, U.K. [Google Scholar]
- Sawaya M. R.; Prasad R.; Wilson S. H.; Kraut J.; Pelletier H. (1997) Crystal Structures of Human DNA Polymerase beta Complexed with Gapped and Nicked DNA: Evidence for an Induced Fit Mechanism. Biochemistry 36, 11205–11215. [DOI] [PubMed] [Google Scholar]
- Jones P. G.; Kirby A. J. (1984) Simple Correlation between Bond Length and Reactivity. Combined Use of Crystallographic and Kinetic Data to Explore a Reaction Coordinate. J. Am. Chem. Soc. 106, 6207–6212. [Google Scholar]
- Kirby A. J. (1994) Crystallographic Approaches to Transition State Structures. Adv. Phys. Org. Chem. 29, 87–183. [Google Scholar]
- Williams A. (2003) Free Energy Relationships in Organic and Bio-Organic Chemistry, Royal Society of Chemistry, Cambridge, U.K. [Google Scholar]
- Lowry T. H., and Richardson K. S. (1987) Mechanism and Theory in Organic Chemistry, Haper International, New York, NY. [Google Scholar]
- Åqvist J.; Kolmodin K.; Florián J.; Warshel A. (1999) Mechanistic Alternatives in Phosphate Monoester Hydrolysis: What Conclusions Can Be Drawn from Available Experimental Data?. Chem. Biol. 6, R71–R80. [DOI] [PubMed] [Google Scholar]
- Marcus R. A.; Sutin N. (1985) Electron Transfers in Chemistry and Biology. Biochem. Biophys. Acta 811, 265–322. [Google Scholar]
- Åqvist J.; Warshel A. (1992) Computer Simulation of the Initial Proton Transfer Step in Human Carbonic Anhydrase I. J. Mol. Biol. 224, 7–14. [DOI] [PubMed] [Google Scholar]
- Rosta E.; Warshel A. (2012) Origin of Linear Free Energy Relationships: Exploring the Nature of the Off-Diagonal Coupling Elements in SN2 Reactions. J. Chem. Theory Comput. 3574–3585. [DOI] [PMC free article] [PubMed] [Google Scholar]
- Eyring H. (1935) The Activated Complex and the Absolute Rate of Chemical Reactions. Chem. Rev. 17, 65–77. [Google Scholar]
- Zalatan J. G.; Herschlag D. (2006) Alkaline Phosphate Mono- and Diesterase Reactions: Comparative Transition State Analysis. J. Am. Chem. Soc. 128, 1293–1303. [DOI] [PMC free article] [PubMed] [Google Scholar]
- Jencks W. P.; Gilchrist M. (1964) The Free Energies of Hydrolysis of Some Esters and Thiol Esters of Acetic Acid. J. Am. Chem. Soc. 86, 4651–4654. [Google Scholar]
- Schuegraf A.; Ratner S.; Warner R. C. (1960) Free Energy Changes of the Argininosuccinate Synthetase Reaction and of the Hydrolysis of the Inner Pyrophosphate Bond of Adenosine Triphosphate. J. Biol. Chem. 235, 3597–3602. [PubMed] [Google Scholar]
- Wolfenden R.; Ridgway C.; Young G. (1998) Spontaneous Hydrolysis of Ionized Phosphate Monoesters and Diesters and the Proficiencies of Phosphatases and Phosphodiesterases As Catalysts. J. Am. Chem. Soc. 120, 833–834. [Google Scholar]
- Schroeder G. K.; Lad C.; Wyman P.; Williams N. H.; Wolfenden R. (2006) The Time Required for Water Attack at the Phosphorus Atom of Simple Phosphodiesters and of DNA. Proc. Natl. Acad. Sci. U.S.A. 103, 4052–4055. [DOI] [PMC free article] [PubMed] [Google Scholar]
- Florián J.; Baumruk V.; Strajbl M.; Bednarova L.; Stepanek J. (1996) IR and Raman Spectra, Conformational Flexibility, And Scaled Quantum Mechanical Force Fields of Sodium Dimethyl Phosphate and Dimethyl Phosphate and Dimethyl Phosphate Anion. J. Phys. Chem. 100, 1559–1568. [Google Scholar]
- Florián J.; Strajbl M.; Warshel A. (1998) Conformational Flexibility of Phosphate, Phosphonate, and Phosphorothioate Methyl Esters in Aqueous Solution. J. Am. Chem. Soc. 120, 7959–7966. [Google Scholar]
- Batra V. K.; Pedersen L. C.; Beard W. A.; Wilson S. H.; Kashemirov B. A.; Upton T. G.; Goodman M. F.; McKenna C. E. (2010) Halogenated β,γ-Methylene- and Ethylidene-dGTP-DNA Ternary Complexes with DNA Polymerase β: Structural Evidence for Stereospecific Binding of the Fluoromethylene Analogues. J. Am. Chem. Soc. 132, 7617–7625. [DOI] [PMC free article] [PubMed] [Google Scholar]
Associated Data
This section collects any data citations, data availability statements, or supplementary materials included in this article.


