


Abstract
We created a single cell sorting system to screen for enzyme activity in Escherichia coli producing 3,4 dihydroxy benzoate (34DHB). To do so, we engineered a transcription factor regulon controlling the expression of green fluorescent protein (GFP) for induction by 34DHB. An autoregulated transcription factor, pcaU, was borrowed from Acinetobacter sp ADP1 to E. coli and its promoter region adapted for activity in E. Coli. The engineered pcaU regulon was inducible at >5 μM exogenous 34DHB, making it a sensitive biosensor for this industrially significant nylon precursor. Addition of a second plasmid provided IPTG inducible expression of dehydroshikimate dehydratase enzyme (AsbF), which converts endogenous dehydroshikimate to 34DHB. This system produced GFP fluorescence in an IPTG dose-dependent manner, and was easily detected in single cell on flow cytometer despite a moderate catalytic efficiency of AsbF. Using fluorescence-activated cell sorting (FACS), individual cells carrying the active AsbF could be isolated even when diluted into a decoy population of cells carrying a mutant (inactivated) AsbF variant at one part in a million. The same biosensor was also effective for further optimization of itself. FACS on E. coli carrying randomized loci in the promoter showed several variants with enhanced response to 34DHB.
INTRODUCTION
Whole-cell bioreporters and sensors are useful tools for detecting exogenous or endogenous change in environment in a dose-dependent manner (1–4). Since a transcription factor can sense the concentration of small molecules in the surrounding or inside the cell, it offers a potent opportunity to select biocatalysts (5–7) under directed evolution or screen large DNA libraries for function (8,9). In a transcription factor-based assay method, a reporter gene is added downstream of the promoter region. Typical reporters include an antibiotic resistance gene, a gene encoding a fluorescent protein or a lacz gene. Upon induction of the transcription factor, such reporters report the small molecule concentration via antibiotic resistance and hence growth of the cells (5,10), or fluorescence (7,11) or color change in blue–white colonies on plates (6,12).
In order to screen libraries with high genetic diversity, a key problem is scaling the screening or selection technique. To associate genotype to phenotype, growth-based assays usually separate colonies on agar plates or in liquid cultures in a 96-well format. Such assays suffer from low dynamic range, low throughput and unwanted sensitivity to variable experimental parameters. Fluorescence-based assays in colonies or plates also suffer from low throughput, but often have better dynamic range than the growth format. In this work, we apply high throughput flow cytometry to sort single cell fluorescence phenotypes by a reporter expression (4). A flow cytometer-based sorting (fluorescence-activated cell sorting or FACS) can sort up to 109 events in a day, each having different genotype (13). That rate conveniently aligns with the typical limit to library genotype diversity imposed by the transformation efficiency of bacterial cells. However, FACS requires that individual cells present a sortable signal, such as intracellular fluorescence proteins under control of a transcription factor.
Thus, a second key hurdle is the identification of a transcription factor sensitive to a molecule of interest. When the small molecule of interest is foreign to a culturable and laboratory-friendly host, as industrial chemicals are likely to be, the host will generally lack a cognate or robust regulatory mechanism to exploit. If the molecule is not too dissimilar to a common metabolite, it may be possible to evolve a weakly compatible receptor to be inducible. Very recently, FACS-based screening was used to pick a transcription factor-based sensor for triacetic acid lactone from a mutant library of an arabinose-sensitive transcription factor (12). A pitfall with exploiting a mutated native receptor is the potential for crosstalk with the native regulon or native metabolites. An alternative strategy is to import an orthogonal regulon into the host from another bacterial strain. The pitfall here is that the regulon may perform poorly outside its native host.
This work describes a holistic, end-to-end, process to originate reporter activity, develop a biosensor, integrate high-throughput flow cytometer sorting of mixed genotypes by phenotypic activity and use the same system and apparatus to select for enzyme activity. This work proceeds from making discrete mutations to establish nascent functionality of a transgenic transcription factor, then bootstrapping the selection of better variants of this biosensor from a large library randomizing the operon promoter region. This small molecule reporter system is also applied to sensitively sort single cells at high throughput for enzyme genotypes competent at producing the desired product molecule.
Our studies began with subcloning the gene encoding for the transcription factor, pcaU, from the soil bacteria Acinetobacter sp ADP1 into Escherichia coli. PcaU recognizes and binds to a small, aromatic molecule, 3,4-dihydroxy benzoate (34DHB), an intermediate found as a part of the aromatic molecule degradation pathway (14). Confirmation of transcription factor activity was determined by linking pcaU activation to green fluorescent protein (gfp) gene expression, adding exogenously supplied 34DHB and screening for GFP fluorescence by flow cytometry. Moving a step further, we transformed a second plasmid that harbored the gene encoding for the enzyme responsible for 34DHB production into the above E. coli strain containing plasmid with pcaU and gfp genes. Specifically, asbf encodes for a dehydroshikimate dehydratase (DHSase/AsbF), which converts intracellular dehydroshikimate (DHS) to 34DHB in many species within the Bacillus cereus sensu lato group (15,16). When the double transformant of E. coli had asbf gene turned on, the intracellular 34DHB production by the enzyme from DHS intermediate (also present in E. coli) subsequently turned on pcaU transcription factor, which in turn led to GFP expression. We benchmarked its activity selection power under FACS, which successfully and rapidly isolated an active asbf genotype out of pool of inactive asbf mutants at dilutions as high as one part in a million.
This small molecule, 34DHB, is of particular interest because it is a commodity chemical with a large carbon footprint (15). An estimated ∼98% of all chemicals produced in the U.S. are derived from petroleates and a significant proportion, trillions of pounds, are components of plastic or nylon (15). Direct biosynthesis of 34DHB could offset petrochemicals in nylon production and other products. Thus, development of regulators and selection systems for 34DHB production will have a wide impact.
MATERIALS AND METHODS
Plasmid construction
The pcaU gene was commercially synthesized and codon optimized for expression in E. coli (Eurofins MWG Operon). The pcaU regulation region consisting of an upstream autoregulatory region and downstream promoter region (17), was synthesized using overlap oligonucleotide method (18). The pGLO (BioRad) plasmid, carries a gfp reporter-gene under the control of an araC regulatory region. The araC regulatory region and araC gene were removed at the Nhe1 and Cla1 restrictions sites and replaced by our synthesized pcaU regulatory unit and pcaU gene (17). A stretch of 89 bases lying between stop codon of araC gene and Cla1 restriction site in original pGLO plasmid was maintained in our constructs. Since Nhe1 site in pGLO plasmid lies downstream of start codon of gfp, and would be removed upon restriction digestion, we took caution to reintroduce it in the constructs. We named this plasmid construct, pGlo.pcaU.
The asbf gene, from Bacillus thuringiensis', used for these studies was derived from pDTF_asbf_1191 as previously reported in our laboratory by Koppisch et al. (15,16). The asbf was subcloned into pRSF-1b vector (Novagen) at the SacI and XhoI restriction sites to provide pRSF.asbf. This vector was chosen due to a different origin of replication and antibiotic resistance marker (kanamycin) than the pGlo.pcaU construct (carbenicillin).
A control plasmid, containing an inactivated mutation of the asbf gene was also created using an overlap oligonucleotide method (18). His144 in AsbF is critical for the enzymatic activity. Mutation to alanine, H144A (CAT → GCG), renders the enzyme inactive (19).
Transformation and validation of gene expression
pGlo.pcaU was transformed in chemically competent E. coli BL21-Gold(DE3) cells (Agilent Technologies) and screened on Luria-Bertani (LB) agar plates containing 100 μg/ml carbenicillin (carb100). Single colonies from each plate were inoculated into 3 ml growth media (LB/carb100) and shaken overnight at 37°C. The following morning, the cultures were diluted (1:100) in fresh media and allowed to grow to mid-log phase (OD600 ∼0.6) when each culture was transferred to a single well in a 12-well plate containing various quantity of 34DHB to give 0–20 mM final concentration in the culture.
Measurement of induced GFP expression in bulk and individual cells
To prepare samples for the bulk spectrometer, 2 ml of each overnight-induced culture was spun down at 9000 × g for 5 min, washed twice with 500 μl phosphate buffered saline (PBS) buffer and finally resuspended in 500 μl PBS buffer. The relative cell concentration of each sample was assessed by OD600. Based on that, an equal amount of cells from each sample were transferred to 96-well Nunc white plates (Thermo Scientific) with opaque bottom to measure green fluorescence in the 530 nm band after excitation at 480 nm in a Tecan spectrometer.
For measurement using a flow cytometer, 2–5 μl of each overnight-induced culture was directly added to 200 μl of PBS buffer. An LSRII flow cytometer (BD Biosciences) measured the fluorescence distribution of individual cells with ex/em wavelengths of 488/530 nm.
Construction of a double plasmid system for sensing endogenous production of 34DHB
Plasmids containing the asbf gene were transformed into chemical competent cells of BL21-Gold(DE3) containing the pGlo.pcaU.eRBS plasmid, an optimized version of our pGlo.pcaU plasmid (see Results section). BL21-Gold(DE3) cells carrying pGlo.pcaU.eRBS were grown to an OD600 of ∼0.5 in growth media (LB/carb100) and washed and incubated in chilled 15% glycerol/0.1% CaCl2 solution. Post 3 h of incubation in ice bath gave chemically competent cells of BL21-Gold(DE3) harboring pGlo.pcaU.eRBS plasmid. A second plasmid, pRSF.asbf was transformed into the above competent cells to generate a double plasmid system. The asbf gene in pRSF.asbf plasmid is regulated by a T7 promoter and a lac operator, so that its level of expression is controlled by the exogenous concentration of isopropyl β-D-1-thiogalactopyranoside (IPTG). In the double plasmid system, the AsbF mutant (deadAsbF) and wild type (wtAsbF) showed similar levels of expression in the soluble fraction as confirmed by sodium dodecyl sulphate-polyacrylamide gel electrophoresis (SDS-PAGE).
Monitoring the enzyme-coupled transcription activity of the double plasmid system
Growth and induction of the cells with the double plasmids were done in a similar way as done for one plasmid system except for the addition of 50 μg/ml kanamycin antibiotic (kan50) to the growth media. At OD600 of ∼0.6, varying concentrations of the LacI inducer, IPTG, was added to induce AsbF enzyme production. A small volume of culture was lysed using BugBuster reagent (Novagen) according to the manufacturer's instructions and then the 6xHis tagged AsbF enzyme purified using Ni-NTA beads (Qiagen). Equal volume of eluate from each sample was run on a NuPAGE 4–12% Bis-Tris precast SDS-PAGE gel (Life Technologies) to qualitatively identify the concentration of AsbF enzyme at each level of inducer concentration. The corresponding GFP fluorescence due to enzyme product formation and coupled transcription activation was measured using either a Tecan spectrometer or a flow cytometer.
Preparation of mixed enzyme populations
We mixed the dual plasmid cells in a titration series of 1:1, 1:10, 1:102, 1:103, 1:104 and 1:106 ratio of the active AsbF enzyme (genotype wt_asbf) to the dead variant (genotype dead_asbf). To do this, seed cultures for both types of cells were grown separately overnight and combined in fresh growth media (LB/carb100/kan50) at a total dilution of 100-fold. At an OD600 of ∼0.6, 3 ml of each of six biclonal bacterial cultures was placed into a plate well (in a 12-well plate) and induced with IPTG at a final concentration of 1 mM. Control cultures consisting of pure wt_asbf genotype (ratio 1:0) and dead_asbf genotype (ratio 0:1) were also grown simultaneously. The plate was placed in a Micro bioshaker set at 18°C and 300 rpm for 16–20 h overnight.
Flow cytometer sorting of enzyme activity
After overnight induction, the mixed genotype cultures remained in a refrigerator for around 3 h before diluting 50- to 100-fold in a volume of 2–4 ml of PBS buffer containing 1% sucrose (20). A FACSaria III flow cytometer (BD Biosciences) analyzed and sorted the diluted cell culture. The flow cytometer was set up to monitor forward scatter, side scatter and fluorescence using a 488 nm laser (em 530 nm with a band width of 30 nm). In the first round of sorting, 6 million cells were sorted for 1:1, 1:10, 1:102, 10 million cells for 1:103, 1:104 and 150 million cells were sorted for 1:106. In each subsequent round of sorting, 5-fold fewer cells were sorted. The cytometer collected the brightest 1% of the fluorescent cells (except for 1:106 mix, in the first sort top 5% was collected). To mitigate cell death after the sort, the cells were collected in 1.5–4 ml of LB broth or SOC (Super Optimal Broth with glucose) medium. The collection tube was changed after every 30 min so that the sorted cells could be moved for recovery in a 250 rpm shaker at 37°C. Post 30 min recovery, antibiotics (carb100 + kan50) were added to the culture and grown overnight at 32°C and 200 rpm and diluted in fresh growth media for next round of analyses and sorting by flow cytometry. Post 30 min recovery, a 10–500 μl volume of culture was also plated on LB agar plates with carbenicillin and kanamycin, and 10 colonies were picked and grown in 3 ml growth media for plasmid minipreps (Qiagen) to be used for sequencing.
Promoter randomization and sorting
The intergenic region of pcaU/gfp was randomized at three blocks: –35, –10 and transcription initiation site. In addition, we also put a binary option of deletion of one base between operator and –35 region. Oligonucleotides with complete randomization at three positions in –35, three positions in –10, single position near transcription initiation site and with or without base deletion in the spacer between operator and –35 site were purchased (Eurofins MWG Operon). A theoretical diversity of 33 000 was expected in the library. The oligonucleotides were assembled for a complete intergenic region using overlap oligonucleotide method (18). Variable intergenic sequence, pcaU gene and the linker between stop codon and Cla1 site as observed in original pGLO plasmid, were assembled together and PCR amplified with oligonucleotides for ligation in pGLO vector between Nhe1 and Cla1. The ligated product was transformed into NEB5α electrocompetent cells (New England Biolabs) and plated on LB agar-carb100 plates. Twelve colonies were regrown and sent for sequencing and showed mutations at the desired positions, with higher bias for ‘Cs’ and ‘Gs’ at the randomized positions. Two out of 12 sequences also showed single base pair mutations at unwanted positions. A total of >50 000 transformant colonies were resuspended in LB media, mixed to homogeneity and spun down for plasmid isolation. The purified plasmid (DNA library with mutated intergenic region) was then transformed in Bl21-Gold(DE3) competent cells (Agilent Technologies). Approximately 40 000 transformant colonies were then resuspended from the plate in LB, mixed to homogeneity and glycerol stocks prepared. An aliquot of glycerol stock was then used as an inoculum for culture growth at a 100-fold dilution in LB/carb100. At OD600 of ∼0.6, the growing culture was induced with 1 mM 34DHB and moved to 18°C and 300 rpm for 16–20 h in Micro bioshaker until sorted using a flow cytometer.
Sequencing
For individual colony sequencing, ∼3 ml of culture carrying an appropriate plasmid was grown overnight in LB medium with antibiotics at 32°C. After extraction of the plasmids by Qiagen miniprep kit, these were sequenced using appropriate primers to cover the region of interest by Sanger sequencing (Eurofins MWG Operon).
Deep sequencing of mixed genotype cell populations was performed by an Ion Torrent sequencer. After plasmid extraction by a Qiagen miniprep kit, the genetic region surrounding the mutation position in asbf was amplified using primers carrying a 10-base unique barcodes. The amplicons were gel purified and quantified (Qbit, HS kit, Invitrogen). Each sample was prepared with a distinct barcode to allow a multiplex assay on a single Ion 316 chip (Life Technologies). The raw data from ion torrent sequencing was processed by the AbMining toolbox (21).
RESULTS
This section is organized in three parts. We first describe the transgenic construction of a working gene regulatory unit, to create a biosensor that can detect exogenously supplied or endogenously produced small molecule of interest, 34DHB (Figure 1A and B), followed by its application as a FACS reporter to select for enzyme activity and then return to improving the promoter region, using the reporter system to select for its own optimization in a large library.
Figure 1.
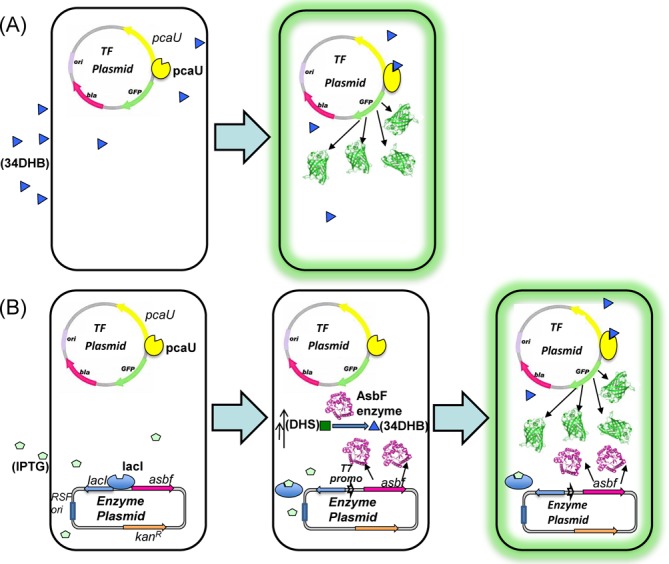
E. coli based whole-cell biosensor. (A) Single plasmid system with autoregulated transcription factor (TF), pcaU and gfp reporter responds to 34DHB in the environment. 34DHB binds to pcaU and activates the transcription of gfp gene that encodes for GFP, which makes the cells fluorescent. (B) Illustration for dual plasmid system. (Left) E. coli cells harboring TF-reporter plasmid (pcaU/gfp) and enzyme plasmid (lacI/asbf). Enzyme expression is repressed by lacI. (Middle) Upon addition of IPTG in the growth media, expression of asbf gene is initiated. Expressed AsbF enzyme (magenta) converts intracellular DHS (an intermediate in the shikimate pathway, indicated by the double arrows) to 34DHB. (Right) 34DHB molecule binds to pcaU transcription factor and activates the expression of downstream gene gfp, resulting in accumulation of GFP, which makes the E. coli cells fluorescent.
Part 1: Construction of a fluorescent reporter based on a transgenic regulatory unit
Selection of a transcription factor for transfer to E. coli
The pcaU transcription factor in Acinetobacter sp ADP1, helps regulate enzymes for catabolism of 34DHB (22). The intergenic region between pcaU and the gene it regulates, pcaI is well understood (17). We grafted the pcaU regulatory subunit, including the upstream pcaU gene (Supplementary Information 1.1) and its autoregulated promoter region (Supplementary Information 2.1 and Supplementary Figure S1) into a synthetic plasmid for E. coli. In our construct, the Acinetobacter pcaI was replaced by a gfp gene that encodes for GFP in the pGLO plasmid. The graft point was nine bases upstream of the GFP start codon thereby replacing the linker region between the ribosome binding site (RBS) and the gene with a native E. coli linker [i.e. substituting GATATACAT (pGLO) in place of AGTTATCTG (pcaI) (Supplementary Information 3.1). The corresponding construct, dubbed pGlo.pcaU, clearly responded to induction by 10 mM 34DHB (Figure 2A and B, left column at each 34DHB concentration) and showed a 3- to 7-fold fluorescence increase relative to the uninduced. The signal-to-noise ratio for this construct was poor for measurement by both Tecan (Figure 2A) and a flow cytometer (Figure 2B) making it difficult for a correct estimation of the contrast ratio (maximum induced signal/uninduced signal).
Figure 2.
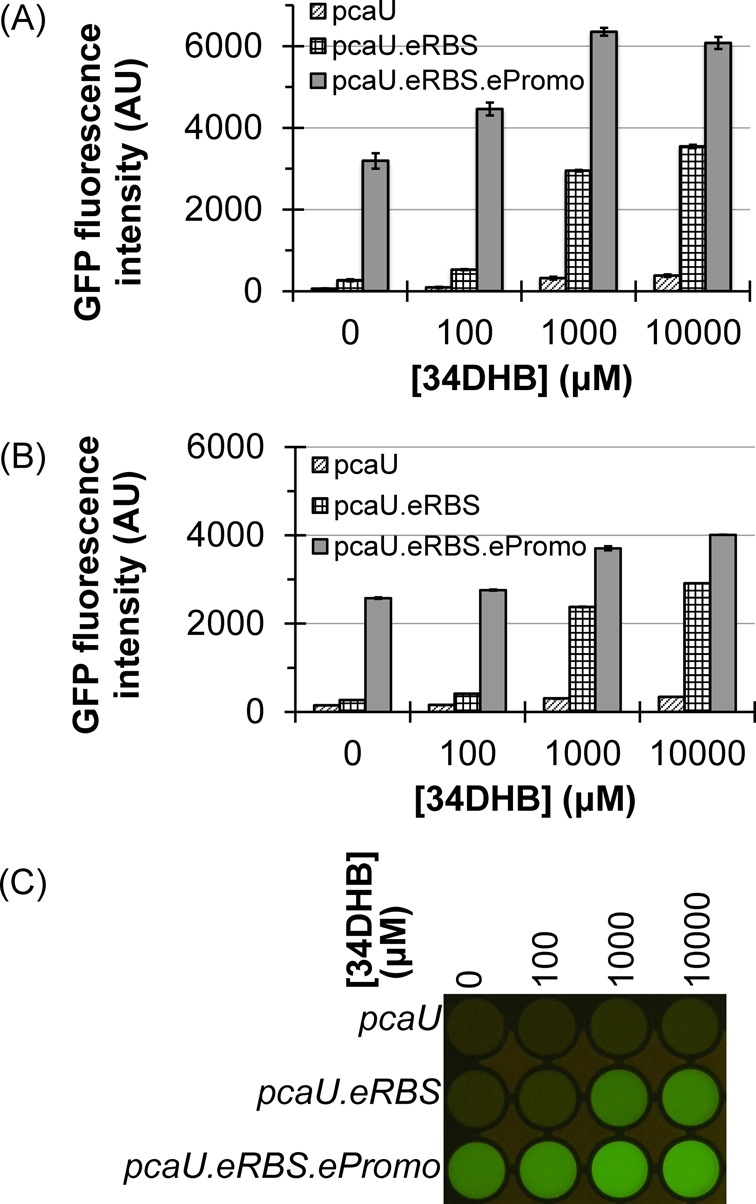
Inducer sensitivity and dynamic range of pcaU constructs with gfp reporter. (A) Three constructs used for pcaU and promoter show varying levels of signal and dynamic range against 34DHB in a bulk measurement using Tecan spectrometer. Native pcaU promoter showed overall very low signal level and poor signal-to-noise ratio. Substituting the E. coli RBS consensus sequence increase the signal level and contrast ratio (pcaU.eRBS). Substituting the promoter (-35/-10) with E. coli consensus sequence increased the amplitude at the expense of the contrast ratio making it nearly constitutively active. The data are mean of duplicates and error bars shown as ±standard deviation. (B) Above experiment repeated with new clones carrying three pcaU constructs and transcription response against inducer 34DHB measured in a single cell format using a flow cytometer. The plot shows average of mean fluorescent reading of duplicate samples and error bars shown as ±standard deviation of replicates. Single cell measurement shows consistency with the bulk measurement. (C) Yellow filtered photos of the 488 nm illuminated cell suspensions of equal cell density.
We further improved GFP expression levels by modification of the intergenic region between the pcaU binding site and the gfp gene for E. coli compatibility. A consensus RBS sequence AAGGAG is seen in E. coli expression vectors 8–9 bases away from the start codon. Substituting the newly designed RBS over the endogenous one, with the terminal G overlaying the leading G in the linker (Supplementary Information 3.2), increased the GFP expression >10-fold (Figure 2A and B, hashed columns). However, the uninduced ‘leakage’ expression also increased providing a ratio of ∼14 between the fully induced and uninduced fluorescence. (Contrast the left and middle columns at each 34DHB concentration in Figure 2A and B.) We named this construct pGlo.pcaU.eRBS.
We hypothesized that the preferred sigma factor binding sequence for E. coli, ought to increase residency on the DNA resulting in increased transcription of gfp. To test this, we replaced the Acinetobacter -35/-10 sequences (CTGGAA/AAAAAT) by E. coli compatible sequence (TTGACA/TATAAT) (23,24). While this construct named pGlo.pcaU.eRBS.ePromo, did increase the GFP fluorescence amplitude at saturated induction, it disproportionately increased the uninduced leakage fluorescence, reducing the contrast ratio of induced to uninduced to just two (Figure 2A and B, gray columns and Figure 2C, bottom row). This constitutive activity presumably arises because the E. coli sigma factor binds so well on its compatible binding site that the transcription factor is almost unnecessary for its recruitment. We also speculate that incompatibility at the interface of the Acinetobacter transcription factor and E. coli sigma factor renders the transcription factor less able to inhibit the sigma factor binding. Part 3, below, explored this promoter region more in depth. Thus, this construct was not used further and the previous pGlo.pcaU.eRBS construct was the starting point of all other experiments.
Dose-response of pGlo.pcaU.eRBS transformed E. coli cells to exogenous 34DHB
E. coli cells transformed with pGlo.pcaU.eRBS, were dosed with 34DHB in concentration intervals spanning six orders of magnitude from 0.02 to 20 000 μM. The bulk response curve (Figure 3A) was sigmoidal with upper and lower limits at 2000 μM and 4 μM, respectively. Similar outcomes were observed in single cell measurements using a flow cytometer. Over this range, the maximum GFP fluorescence reached 12- to 14-fold above the baseline in repeated trials. At even higher dosages (>>1000 μM), the fluorescence continued to increase but cytotoxic growth anomalies onset (Supplementary Figure S2).
Figure 3.
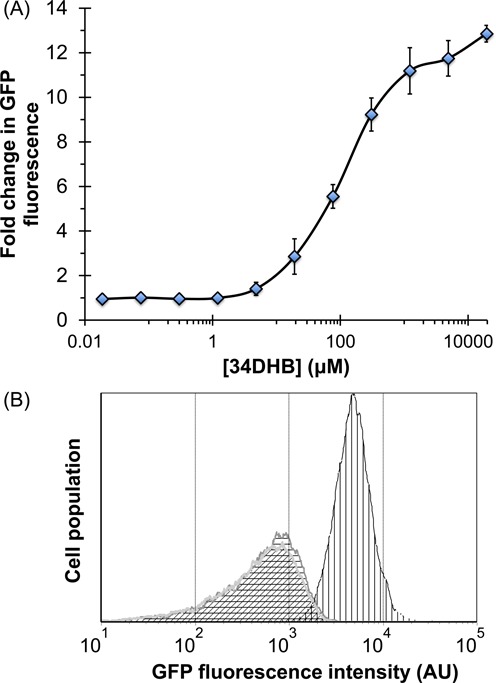
Biosensing 34DHB in E. coli using pcaU based biosensor. (A) Dose-response plot. 34DHB was provided exogenously to the cells transformed with pGlo.pcaU.eRBS and response as GFP fluorescence measured using Tecan spectrometer. Ratio of induced cell fluorescence to uninduced cell fluorescence is shown as a fold change in GFP fluorescence. Flow cytometry analyses showed similar fold change and the error bars represent standard deviation calculated from three independent experiments. (B) Flow cytometry analyses of the cell population grown under different conditions. E. coli cells without any gfp plasmid shown in silver and oblique shade, with pGlo.pcaU.eRBS but uninduced shown in gray outline with horizontal gridlines and finally with pGlo.pcaU.eRBS and induced with 20 mM 34DHB shown in black outline with vertical gridlines.
A histogram of the flow cytometer fluorescence displays the variability of the fluorescence from cell to cell. In Figure 3B, we compare the histograms for induced and uninduced pGlo.pcaU.eRBS transformed E. coli cells. The uninduced E. coli (Figure 3B, gray outline histogram with horizontal gridlines) is indistinguishable from the background fluorescence of a control with no plasmid (Figure 3B, silver outline histogram with oblique shade). The mean GFP fluorescence signal at 20 mM 34DHB showed a 14-fold increase when compared to the uninduced cell population, in agreement with the bulk measurement (Figure 3B, black outline histogram with vertical gridlines).
Part 2: High-throughput selection of active enzymes
Generation of endogenous 34DHB and monitoring enzyme activity
Previous work by Koppisch et al. shows that the enzyme AsbF, originally from Bacillus thuringiensis, will convert an endogenous metabolite (DHS) from an essential pathway (shikimate) to the product 34DHB in E. coli (15,16). In our dual plasmid system, this product will activate the pcaU transcription factor and proportionately express GFP (for illustration refer Figure 1B). Thus, we were able to monitor the total activity of the enzyme within each cell individually and at high-throughput by flow cytometry.
Cells expressing AsbF and pcaU
The activity of the wild type AsbF (wtAsbF) enzyme in E. coli under the control of T7 promoter and lac operator was previously validated (15). A vector with this regulated asbf operon, pRSF.asbf, was transformed in E. coli cells that already contained the pGlo.pcaU.eRBS plasmid and jointly maintained by carbenicillin (for pGlo.pcaU.eRBS) and kanamycin (for pRSF.asbf). For a negative control, we used a similar plasmid with single point mutant in the asbf gene (H144A in gene product); this expresses identically in E. coli (Supplementary Figure S3) but had no detectable activity in in vitro experiments (19). This control mutant was dubbed deadAsbF.
We observed increasing AsbF accumulation with increasing IPTG concentration spanning three orders of magnitude (1–1000 μM), (Figure 4B, top panel). Enzyme quantity was observed to be very similar for wild type and ‘dead’ (H144A) AsbF enzymes (Supplementary Figure S3). The T7 promoter we used for expression of AsbF is a strong promoter and would result in ‘leaky’ expression of AsbF enzyme even at no added IPTG. Using an unsaturated ‘seed’ culture (grown from glycerol stock for 5–6 h instead of overnight), faster growth using flasks with baffles (instead of 50 ml falcon conical tubes, BD Biosciences) and shorter induction period at 18°C (<14 h instead of ∼20 h), could suppress the leaky expression substantially (Figure 4B, bottom panel).
Figure 4.

Endogenous production of 34DHB producing enzyme and detection of its activity. (A) A coupled assay, where increasing inducer concentration for enzyme expression is linked to the induction of transcription factor, pcaU, for GFP expression. Wild-type AsbF (wtAsbF) shows increasing GFP fluorescence due to increase in expression and hence catalytic activity that produces 34DHB. ‘Long’ and ‘short’ stand for saturated seed culture plus extended induction (20 h) and mid-log phase seed culture plus short induction (14 h), respectively. ‘Short’ format (dotted line, diamonds) suppresses the leaky expression. Mutant AsbF (deadAsbF) is not active and hence cannot produce 34DHB to induce pcaU that regulates the production of GFP. Both ‘long’ and ‘short’ formats produce similar transcription factor response (squares, solid line versus dotted line). Each data point is an average of triplicate sample with standard deviation smaller than the size of symbols. (B) IPTG-induced AsbF expression in cell culture shown on SDS-PAGE. Both wtAsbF and deadAsbF had similar level of expression (Supplementary Figure S3). Qualitative comparison should be made within the same gel picture and not across the top panel and bottom panel, as variability in Ni-NTA bead quantity used, incubation time for protein capture, differences in wash and elution steps can result in significantly different amount of protein in the eluate.
Detection of enzymatic 34DHB production
As expected, the GFP fluorescence increased with increasing AsbF production in both long and short version of experiments (Figure 4A, diamonds). The control mutant, deadAsbF, had no significant change in GFP fluorescence with increasing AsbF accumulation (Figure 4A, squares); at 1 mM IPTG, the deadAsbF mutant showed less than 2-fold increase in fluorescence from the baseline. At maximal IPTG induction of wtAsbF, the resulting GFP response was about 14-fold higher than the baseline of the inactive mutant. With no IPTG induction, cells expressing the active enzyme were significantly more fluorescent than the inactive mutant (Figure 4A, first gray diamond and solid line). The fluorescence of wtAsbF versus the deadAsbF in the absence of IPTG is likely due to the leaky expression typical of T7 promoters, which can be suppressed in the shorter induction experiment (Figure 4A, open diamond and dotted line).
Enrichment studies: Separating active from inactive enzyme genotypes in a mixed population
In flow cytometry analyses, cells expressing either the wild-type AsbF or the ‘dead’ control mutant showed very different GFP fluorescence levels (compared in Figure 5A). The means (and modes) of the fluorescence distributions of the two strains differed by approximately 8-fold (and 6-fold). Most importantly, there was minimal overlap of the histograms for the individual populations, which made separation at the individual cell level highly tractable using a flow cytometer (FACS). As such, we prepared mixed populations of the two strains, wtAsbF and deadAsbF, for our enrichment studies (see Materials and Methods).
Figure 5.
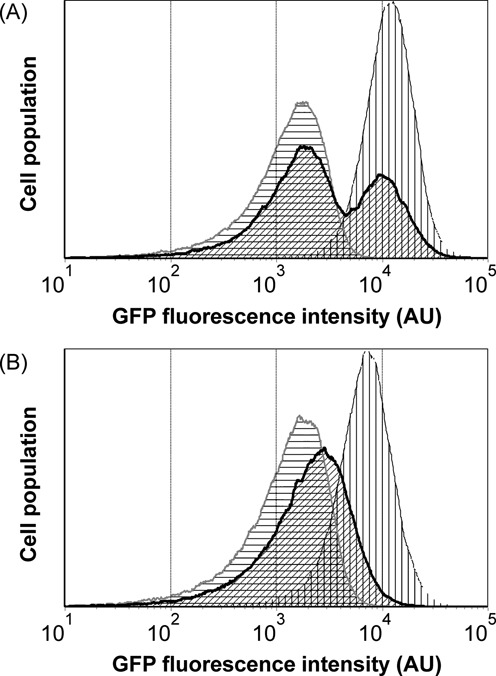
FACS-based screen of enzyme activity linked to transcription factor response. (A) Histograms showing fluorescence distribution of cell population expressing inactive enzyme deadAsbF (gray outline with horizontal gridlines) and active enzyme wtAsbF, (black outline with vertical gridlines). The enzyme produces 34DHB that activates pcaU transcription factor to express GFP. Cells producing deadAsbF mixed with cells producing wtAsbF in 1:1 ratio (thick black outline with oblique shade). (B) Mimicking ‘needle in a haystack’ problem. wtAsbF producing cells mixed with deadAsbF producing cells in a ratio 1:106. Before first sort, the population appeared indistinguishable from deadAsbF phenotype cell distribution (gray outline with horizontal gridlines). After three rounds of FACS, the cell population showed brighter fluorescence (thick black outline with oblique shade), which is consistent with the gain in cell population expressing wtAsbF. Fluorescence distribution of cells expressing wtAsbF alone is also shown (black outline with vertical gridlines).
We were concerned that the enzyme's activity, in addition to GFP expression, could slow the growth rate and thus impair the power of the assay. Overexpression of AsbF may deplete the aromatic amino acid pool since this enzyme utilizes the requisite shikimate pathway intermediate, DHS, for conversion to 34DHB. Fortunately, when an IPTG induced 1:1 mixture of active (wt_asbf) and dead (dead_asbf) genotype cells was grown and deep sequenced (∼200 000 templates), we observed only a 25% difference in the population (1.25:1 as estimated by ion torrent sequencing). Thus, there is no significant growth bias against the enzyme activity. We sorted 6 million of the 1:1 mixed cells based on individual cell fluorescence and captured the brightest of this mixed population. The selection threshold was set at 99 percentile of the uninduced population's fluorescence distribution and the brightest cells were collected. After regrowing the collected cells, the new fluorescence distribution was visually indistinguishable from the pure wtAsbF population (Supplementary Figure S4A–B). Deep sequencing 250 000 templates revealed >93% of the population was wt_asbf genotype. At dilutions of 1:10 and 1:100, one round of sorting achieved the same enrichment as observed for the 1:1 mixture, as inferred from the fluorescence histogram (Supplementary Figure S4C–F). The attribution of the fluorescence assignment was confirmed by sequencing 2 and 4 clones, respectively, observing 2 and 3 wt_asbf sequence.
At 1:103 and higher dilutions, the initial fluorescence distribution was indistinguishable from the pure ‘dead’ mutant distribution; the active enzyme's presence was completely masked in the histogram. After two rounds of collecting and regrowing the brightest 1% of the 1:103 mixture, a clear enrichment was observed in the fluorescence histogram: a strong bright-side shoulder corresponding to active AsbF phenotype (Supplementary Figure S4G–H). After the third sort and regrowth, sequencing revealed 7 out of 10 plated colonies carried the wt_asbf sequence. When extended to 1:104, three rounds of sorting and regrowth resulted in 5 out of 10 sequenced clones with wt_asbf sequence. Thus, three sorts enriched to parity (∼1:1) in active and inactive genotype concentrations for both 1:103 and 1:104 start dilutions.
At a dilution of 1:106, the protocol was adapted to improve the sampling in multiround sorting. In the first round, we sorted a larger number of cells in total (150 million), and we kept the gate at the brightest 5% (instead of 1%). While this would reduce the first round enrichment it also assured that, with 7.5 million cells collected, it was statistically unlikely to miss every active enzyme in the collected population. (Typically, 50–70% of the collected cells after sorting failed to grow.) With the small numbers pitfall avoided, in subsequent rounds we returned to selection of the 1% brightest and processed 5-fold fewer cells. After three rounds, the regrown cell population showed a visible shift in fluorescence peak toward the wtAsbF (Figure 5B). Sequencing after a fourth sort confirmed 4 out 9 colonies had the wt_asbf sequence. An alternative estimate by deep sequencing, 188 000 templates indicated a 2:1 ratio of wt:dead genotype.
Part 3: Library screening for an improved promoter region
Mutations on pcaU promoter region improve the dynamic range of response
We selected for an improved biosensor gene circuit from a library diversifying the transcription factor promoter region (24,25). In Part 1, we had seen that making the -35/-10 regions compatible with the E. coli sigma factor was, surprisingly, counterproductive since it rendered pcaU constitutively active and thus insensitive to the 34DHB inducer (pcaU.eRBS.ePromo in Figure 2A–C). Accordingly, we newly reasoned that degrading the sigma factor binding might make recruitment more dependent on the transcription factor conformation, enhancing the circuit's switching response. We further hypothesized that the coupling strength between the E. coli sigma factor and the Acinetobacter transcription factor might be modulated by the spacing between their adjacent binding sites on the DNA promoter region. Finally, we anticipated modulating transcription of gfp (and hence GFP signal) by randomizing a base in the vicinity of transcription initiation site where the largest ‘bubble’ is expected to form during transcription (26). Altering the base pairing and base stacking at the start point might alter the response and/or dynamic range (27).
To test this, we created a library that had alterations at 8 nucleotide positions: 3 positions each on the ‘-35’ and ‘-10’ binding sites (Acinetobacter -35/-10: CTGGAA/AAAAAT; E. coli -35/-10: TTGACA/TATAAT; Randomized -35/-10: NTGNNA/NANAAN, of these five positions differed between E. coli and Acinetobacter sp ADP1), 1 position near transcription initiation site (ACA → ANA), plus a deletion of a nucleotide in the spacer between -35 site and the pcaU operator region. Randomization of total of seven positions (47) and with or without deletion gave a library size of ∼33 000 variants.
Selection on the switch performance requires both positive selection for improved response, and negative selection against constitutive activity. (In contrast, enzyme activity enhancement only requires positive selection.) The library of clones, which consisted of >40 000 transformants were grown and induced with 1 mM 34DHB, which is below the response saturating concentration (Figure 3A). FACS was performed on the cells in two parallel protocols. For the first protocol, collection of brightest top 1% of an induced population in the first round was followed by a second round collection of darkest 25% of the uninduced population, and finally again collecting the top 1% of the induced population in the third round (Protocol A). Taking the dark tranche of uninduced sample eliminates the constitutively active variants. We also examined a second protocol (Protocol B) differing in the sorting order: the top 1% of induced population in the first round was again sorted for top 1% of induced sample in the second round and finally the bottom 25% of the uninduced cells were collected in the third round.
After three rounds of positive and negative sorting, 11 clones from each format were individually tested for response against 34DHB. All 22 clones showed increased induction relative to pcaU.eRBS at 1 mM 34DHB, some as high as 10-fold. However, the negative selection was imperfect, so there was also increased uninduced fluorescence relative to pcaU.eRBS: the GFP fluorescence in the uninduced samples had increased by 1.5- to 6-fold. Overall, 3 of the 22 clones showed the desired reduction in overlap between the induced and uninduced distributions (Figure 6A and C–F). Intriguingly, a few clones showed a bimodal behavior in the induced state with a small satellite peak in the distribution at the (dark) baseline fluorescence levels (Figure 6F).
Figure 6.
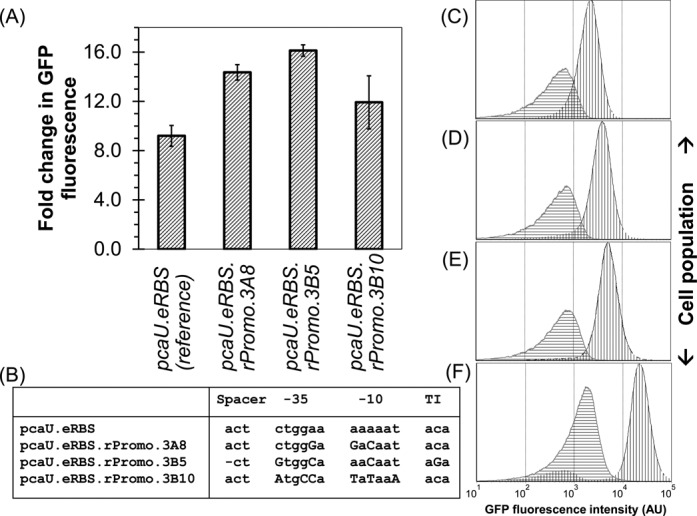
Position-specific randomization of intergenic region of pcaU-pcaI. (A) Improved dynamic range observed in a few clones with mutated intergenic region. Note that 30–60% increase in fold change based on mean GFP fluorescence for three clones shown. The error bars are shown as ±standard deviation. (B) Multiple sequence alignment of sequences from three improved clones shows variation in all four blocks (spacer between pcaU operator and -35 position, -35 sequence, -10 sequence and the transcription initiation site). The bases changed from the reference sequence are shown in uppercase. (C–F) Flow cytometry analyses of the reference clone and three evolved clones arranged in decreasing overlap between the induced (black outline with vertical gridlines) and uninduced (gray outline with horizontal gridlines) fluorescence distribution. (C) pGlo.pcaU.eRBS the reference clone used for library creation. (D) pGlo.pcaU.eRBS.rPromo.3A8, (E) pGlo.pcaU.eRBS.rPromo.3B5 and (F) pGlo.pcaU.eRBS.rPromo.3B10, all show better separation between basal signal and induced signal.
These three clones differed substantially in sequence with differences in each of the randomized loci (Figure 6B, Supplementary Information 4.1). The complete uniqueness seen in the sequenced samples suggests our sorted but unsequenced library contains a high diversity of solutions with improved response. Exhaustive measurements to pin-point the actual determinants of the activity or uninduced repression were beyond the scope of this work. Clone pcaU.eRBS.rPromo.3B5 (rPromo: randomized promoter; 3B5: sort round 3 using Protocol B and clone # 5) produced a >60% increase in contrast ratio, and it had the programmed deletion, two changes in -35 site (from CTGGAA to GTGGCA), one change in -10 site (from AAAAAT to AACAAT) and a change in the sequence near the transcription initiation site (from ACA to AGA). Clone pcaU.eRBS.rPromo.3B10 had a 10-fold higher induced fluorescence (and 6-fold higher uninduced fluorescence) showed mutations at all three randomized positions on -35 site (from CTGGAA to ATGCCA) and -10 site (from AAAAAT to TATAAA) but lacked the deletion and had an unmutated transcription initiation site. Finally, another clone, pcaU.eRBS.rPromo.3A8, which showed the second best improvement in terms of dynamic range, was unperturbed at transcription initiation site and lacked the deletion, while -35 and -10 randomized positions showed 3 out of 6 possible mutations with -35 region carrying one mutation (from CTGGAA to CTGGGA) and -10 region carrying two mutations (from AAAAAT to GACAAT). We also observed an unexpected mutation on -10 promoter site for pcaU transcription in pcaU.eRBS.rPromo.3A8 and between RBS and transcription initiation site in pcaU.eRBS.rPromo.3B10. Two unwanted mutations appeared in pcaU.eRBS.rPromo.3B5, one at pcaU operator site and another one between transcription initiation and RBS sites (refer Supplementary Information 4.2 for details).
DISCUSSION
A transcription factor adopted from a soil bacteria Acinetobacter sp ADP1 was heterogeneously expressed in E. coli as part of a whole-cell-fluorescent biosensor that specifically recognizes 34DHB in context of E. coli intracellular environment. This molecule is of particular interest because of its utility as a commodity chemical in many industrial applications (15). Further, this system represents a proof-of-concept study for linking together an enzyme-catalyzed product with a transcription factor that recognizes the biocatalytic product. This study, in effect, created a microbial biosensor against both exogenously supplied 34DHB and intracellularly generated 34DHB. We found the transcription factor was responsive at 34DHB concentrations in the low μM range as indicated by detectable GFP and its log-linear response region before saturation extended from 5 μM to at least 2.5 logs of concentration change. Same whole-cell biosensor either shows very weak response or poor sensitivity toward other closely related benzyl family molecules like 2-hydroxy benzoate (salicylate), 4-hydroxy benzoate, vanillic acid and vanillin (Supplementary Figure S5). This sensor was applied in a flow cytometer assay to successfully isolate individual E. coli cells carrying a functional enzyme at one part in million of a pool of cells carrying inactive enzyme. Finally, we demonstrated selection for improved biosensor response in the context of randomized library of biosensor promoter region variants.
A 1:106 mixed cell population carrying active to inactive enzyme genotype was enriched to approximately equal proportions after just four flow cytometer passages. At an equal mixing ratio (1:1), one pass through the flow cytometer resulted in an essentially pure (>93%) separation of the active enzyme genotype. We note that this enrichment rate already incorporates inadvertent factors, such as differential survival, growth and expression among different genotypes and phenotypes. Thus, this combined system is suited for screening enzyme libraries in which active enzymes account for at least 10−6 of the diversity, in a single pot format.
To place that scale in perspective we note two things. First, this feasible library size covers a common scenario in computational de novo enzyme design where in a catalytic pocket in a scaffold consisting of ∼10 residues each exploring ∼4 plausible amino acids alternatives giving a combinatorial library size of 410 or ∼106. A typical commercial flow cytometer can passage ∼109 cells/day, but in this investigation we collected only 108 cells because we were performing parallel sorts on many control conditions for the same day. Thus, our results are a lower bound on the feasible enrichment by at least an order of magnitude.
Second, the enzyme we employed, AsbF, is rather inefficient—its Kcat/Km is 103 to 104 M−1 s−1 (16,19), which is about four orders of magnitude lower than many natural proficient enzymes (28). Thus, our result is a proper benchmark for scenarios of selectio, such as de novo enzyme libraries or genome-scale screening for discovery of promiscuous activity (i.e. functional genomics), in which the enzyme might only be weakly active. Indeed, we observed that the FACS enrichment rate saturates as we approach high enrichment, presumably due to the secretion of the 34DHB from the concentrated active cells. Since, that minor nuisance is inoperative at the critical early stages when the active variant is dilute, we did not optimize the induction as we approached high purity.
We showed that we could readily select for altered properties of our transcription factor reporter system using both positive and negative selection for performance. We selected against a library of the promoter region and increased total signal level and a wider separation between the ‘on’ and ‘off’ states of the reporter. In particular, we increased this separation past the point of significant overlap between distributions of single cell fluorescence of these two states (compare Figure 6C which shows some overlap between the ‘on’ and ‘off’ states at 1 mM inducer to an evolved promoter in Figure 6D–F). This later factor, lack of overlap, can be more valuable in flow sorting than the mean fluorescence improvement, since that is what determines how stringently one can select the brightest cells.
The maximum amplitude and contrast ratio (12- to 14-fold) of the engineered biosensor is not as great as seen in many natural transcription factors; for example, under similar conditions araC in E. coli has a contrast ratio 20 times larger (>250-fold) and a maximum fluorescence about 15 times larger when cells are treated under similar growth and induction conditions (Supplementary Figure S6). Yet we were able to achieve a sort separation of 1 in 106 cells by flow cytometry. Thus, strong selection is possible even when using a low contrast biosensor; this bodes well for the prospect of crudely engineered or weak transgenic transcription factors being employed as powerful biosensors in the FACS context.
Finally, we discuss a pragmatic aspect of our experimental design. When we had previously employed antibiotic resistance selection instead of FACS, progress was slowed because every growth condition or different enzyme vector required parallel experiments to recalibrate the stringency. Notably, for low contrast enzymes and bioswitches, the narrow window of permissible protocol variation became technically exacting. Furthermore, negative selection by survival required additional genes and further protocol complexity. With FACS, the necessary threshold for both positive or negative selection is dynamically adjusted to match whatever fluorescent distribution is observed at the time of the sorting, avoiding prior calibration or parallel titration for protocol variants. Moreover, our sorting simultaneously combines multiple parameters at the same time, such as cell size for more uniform maturity.
Sensing the enzyme product within a cell, screens directly for improved total product formation rather than a proxy (e.g. substrate binding) or without resort to serially screening for component properties (i.e. expression, life-time, product inhibition and specific activity). Thus, we can uniformly compare many different growth conditions with ease, can employ biosensors with weak contrast ratios, can perform high throughput negative selection on the biosensor itself without modifying the reporter and can select simultaneously for multiple criteria instead of separate serial assays for component properties.
CONCLUSION
Transcription factors for reaction product offer a route to selection for an enzymes’ total activity instead of selection against proxies like substrate binding. However, nature does not conveniently provide transcription factors suited for many enzyme products of interest. Here, we obtained a sensitive and effective E. coli biosensor for 34DHB. Our approach used a transgenic transcription factor to derive initial sensitivity, and evolved improved switching characteristics by directed evolution. The dynamic range and amplitude of biosensor response was tailored by modification of the promoter region. Library selection of a diversified promoter region gave multiple solutions with improvement in desirable properties of a biosensor.
Our gene circuit was a sufficiently good 34DHB reporter to discriminate an active enzyme from an inactive enzyme. We showed that even with a relatively low contrast biosensor we could readily sort active from inactive enzyme genotypes at a dilution as high as 1:106 at the single cell level by flow cytometry. The versatility and forgiveness of this approach fosters the use of crudely engineered or other weakly promiscuous transcription factors as broadly applicable selection agents.
SUPPLEMENTARY DATA
Supplementary Data are available at NAR Online
ACKNOWLEDGEMENTS
We thank Claire Sanders for guidance in flow cytometry experiments, Sara D'Angelo for assistance in Ion Torrent sequencing and Csaba Kiss for processing the ion torrent data.
FUNDING
Defense Threat Reduction Agency (DTRA) [CBCALL12-LS6-1-0622]; Los Alamos [WSYN_BIO]. Source of open access funding: DTRA [CBCALL12-LS6-1-0622].
Conflict of interest statement. None declared.
REFERENCES
- 1.Daunert S., Barrett G., Feliciano J.S., Shetty R.S., Shrestha S., Smith-Spencer W. Genetically engineered whole-cell sensing systems: coupling biological recognition with reporter genes. Chem. Rev. 2000;100:2705–2738. doi: 10.1021/cr990115p. [DOI] [PubMed] [Google Scholar]
- 2.Gu M.B., Mitchell R.J., Kim B.C. Whole-cell-based biosensors for environmental biomonitoring and application. In: Zhong J.-J., editor. Biomanufacturing Advances in Biochemical Engineering. Berlin Heidelberg: Springer; 2004. pp. 269–305. [DOI] [PubMed] [Google Scholar]
- 3.Van der Meer J.R., Belkin S. Where microbiology meets microengineering: design and applications of reporter bacteria. Nat. Rev. Microbiol. 2010;8:511–522. doi: 10.1038/nrmicro2392. [DOI] [PubMed] [Google Scholar]
- 4.Dietrich J.A., McKee A.E., Keasling J.D. High-throughput metabolic engineering: advances in small-molecule screening and selection. Annu. Rev. Biochem. 2010;79:563–590. doi: 10.1146/annurev-biochem-062608-095938. [DOI] [PubMed] [Google Scholar]
- 5.Van Sint Fiet S., van Beilen J.B., Witholt B. Selection of biocatalysts for chemical synthesis. Proc. Natl. Acad. Sci. U. S. A. 2006;103:1693–1698. doi: 10.1073/pnas.0504733102. [DOI] [PMC free article] [PubMed] [Google Scholar]
- 6.Mohn W.W., Garmendia J., Galvao T.C., de Lorenzo V. Surveying biotransformations with à la carte genetic traps: translating dehydrochlorination of lindane (gamma-hexachlorocyclohexane) into lacZ-based phenotypes. Environ. Microbiol. 2006;8:546–555. doi: 10.1111/j.1462-2920.2006.00983.x. [DOI] [PubMed] [Google Scholar]
- 7.Uchiyama T., Miyazaki K. Product-induced gene expression, a product-responsive reporter assay used to screen metagenomic libraries for enzyme-encoding genes. Appl. Environ. Microbiol. 2010;76:7029–7035. doi: 10.1128/AEM.00464-10. [DOI] [PMC free article] [PubMed] [Google Scholar]
- 8.Van Rossum T., Kengen S.W.M., van der Oost J. Reporter-based screening and selection of enzymes. FEBS J. 2013;280:2979–2996. doi: 10.1111/febs.12281. [DOI] [PubMed] [Google Scholar]
- 9.Steele H.L., Jaeger K.-E., Daniel R., Streit W.R. Advances in recovery of novel biocatalysts from metagenomes. J. Mol. Microbiol. Biotechnol. 2009;16:25–37. doi: 10.1159/000142892. [DOI] [PubMed] [Google Scholar]
- 10.Dietrich J.A., Shis D.L., Alikhani A., Keasling J.D. Transcription factor-based screens and synthetic selections for microbial small-molecule biosynthesis. ACS Synth. Biol. 2013;2:47–58. doi: 10.1021/sb300091d. [DOI] [PMC free article] [PubMed] [Google Scholar]
- 11.Zhang F., Carothers J.M., Keasling J.D. Design of a dynamic sensor-regulator system for production of chemicals and fuels derived from fatty acids. Nat. Biotechnol. 2012;30:354–359. doi: 10.1038/nbt.2149. [DOI] [PubMed] [Google Scholar]
- 12.Tang S.-Y., Qian S., Akinterinwa O., Frei C.S., Gredell J.A., Cirino P.C. Screening for enhanced triacetic acid lactone production by recombinant Escherichia coli expressing a designed triacetic acid lactone reporter. J. Am. Chem. Soc. 2013;135:10099–10103. doi: 10.1021/ja402654z. [DOI] [PubMed] [Google Scholar]
- 13.Yang G., Withers S.G. Ultrahigh-throughput FACS-based screening for directed enzyme evolution. Chem. Bio. Chem. 2009;10:2704–2715. doi: 10.1002/cbic.200900384. [DOI] [PubMed] [Google Scholar]
- 14.Kok R.G., D'Argenio D.A., Ornston L.N. Mutation analysis of PobR and PcaU, closely related transcriptional activators in Acinetobacter. J. Bacteriol. 1998;180:5058–5069. doi: 10.1128/jb.180.19.5058-5069.1998. [DOI] [PMC free article] [PubMed] [Google Scholar]
- 15.Koppisch A., Fox D., Hotta K., Welsh J. Production of industrially relevant compounds in prokaryotic organisms. 201. US Patent application #13/018,066, United States.
- 16.Fox D.T., Hotta K., Kim C.-Y., Koppisch A.T. The Missing Link in Petrobactin Biosynthesis: asbF Encodes a (−)-3-Dehydroshikimate Dehydratase†. Biochemistry (Mosc.) 2008;47:12251–12253. doi: 10.1021/bi801876q. [DOI] [PubMed] [Google Scholar]
- 17.Molina-Henares A.J., Krell T., Eugenia Guazzaroni M., Segura A., Ramos J.L. Members of the IclR family of bacterial transcriptional regulators function as activators and/or repressors. FEMS Microbiol. Rev. 2006;30:157–186. doi: 10.1111/j.1574-6976.2005.00008.x. [DOI] [PubMed] [Google Scholar]
- 18.Stemmer W.P., Crameri A., Ha K.D., Brennan T.M., Heyneker H.L. Single-step assembly of a gene and entire plasmid from large numbers of oligodeoxyribonucleotides. Gene. 1995;164:49–53. doi: 10.1016/0378-1119(95)00511-4. [DOI] [PubMed] [Google Scholar]
- 19.Pfleger B.F., Kim Y., Nusca T.D., Maltseva N., Lee J.Y., Rath C.M., Scaglione J.B., Janes B.K., Anderson E.C., Bergman N.H., et al. Structural and functional analysis of AsbF: origin of the stealth 3,4-dihydroxybenzoic acid subunit for petrobactin biosynthesis. Proc. Natl. Acad. Sci. 2008;105:17133–17138. doi: 10.1073/pnas.0808118105. [DOI] [PMC free article] [PubMed] [Google Scholar]
- 20.Varadarajan N., Cantor J.R., Georgiou G., Iverson B.L. Construction and flow cytometric screening of targeted enzyme libraries. Nat. Protoc. 2009;4:893–901. doi: 10.1038/nprot.2009.60. [DOI] [PubMed] [Google Scholar]
- 21.D'Angelo S., Glanville J., Ferrara F., Naranjo L., Gleasner C.D., Shen X., Bradbury A.R., Kiss C. The antibody mining toolbox: an open source tool for the rapid analysis of antibody repertoires. mAbs. 2013;6:41–53. doi: 10.4161/mabs.27105. [DOI] [PMC free article] [PubMed] [Google Scholar]
- 22.Gerischer U., Segura A., Ornston L.N. PcaU, a transcriptional activator of genes for protocatechuate utilization in Acinetobacter. J. Bacteriol. 1998;180:1512–1524. doi: 10.1128/jb.180.6.1512-1524.1998. [DOI] [PMC free article] [PubMed] [Google Scholar]
- 23.Ross W., Aiyar S.E., Salomon J., Gourse R.L. Escherichia coli promoters with UP elements of different strengths: modular structure of bacterial promoters. J. Bacteriol. 1998;180:5375–5383. doi: 10.1128/jb.180.20.5375-5383.1998. [DOI] [PMC free article] [PubMed] [Google Scholar]
- 24.Blazeck J., Alper H.S. Promoter engineering: recent advances in controlling transcription at the most fundamental level. Biotechnol. J. 2013;8:46–58. doi: 10.1002/biot.201200120. [DOI] [PubMed] [Google Scholar]
- 25.Alper H., Fischer C., Nevoigt E., Stephanopoulos G. Tuning genetic control through promoter engineering. Proc. Natl. Acad. Sci. U. S. A. 2005;102:12678–12683. doi: 10.1073/pnas.0504604102. [DOI] [PMC free article] [PubMed] [Google Scholar]
- 26.Kalosakas G., Rasmussen K.Ø., Bishop A.R., Choi C.H., Usheva A. Sequence-specific thermal fluctuations identify start sites for DNA transcription. Europhys. Lett. EPL. 2004;68:127–133. [Google Scholar]
- 27.Alexandrov B., Voulgarakis N.K., Rasmussen K.Ø., Usheva A., Bishop A.R. Pre-melting dynamics of DNA and its relation to specific functions. J. Phys. Condens. Matter. 2009;21:034107. doi: 10.1088/0953-8984/21/3/034107. [DOI] [PubMed] [Google Scholar]
- 28.Radzicka A., Wolfenden R. A proficient enzyme. Science. 1995;267:90–93. doi: 10.1126/science.7809611. [DOI] [PubMed] [Google Scholar]
Associated Data
This section collects any data citations, data availability statements, or supplementary materials included in this article.