

Abstract
In vivo confocal imaging of the mucosal surface of rat stomach was used to measure pH noninvasively under the mucus gel layer while simultaneously imaging mucus gel thickness and tissue architecture. When tissue was superfused at pH 3, the 25 μm adjacent to the epithelial surface was relatively alkaline (pH 4.1 ± 0.1), and surface alkalinity was enhanced by topical dimethyl prostaglandin E2 (pH 4.8 ± 0.2). Luminal pH was changed from pH 3 to pH 5 to mimic the fasted-to-fed transition in intragastric pH in rats. Under pH 5 superfusion, surface pH was relatively acidic (pH 4.2 ± 0.2). This surface acidity was enhanced by pentagastrin (pH 3.5 ± 0.2) and eliminated by omeprazole, implicating parietal cell H,K-ATPase as the dominant regulator of surface pH under pH 5 superfusion. With either pH 5 or pH 3 superfusion (a) gastric pit lumens had the most divergent pH from luminal superfusates; (b) qualitatively similar results were observed with and without superfusion flow; (c) local mucus gel thickness was a poor predictor of surface pH values; and (d) no channels carrying primary gastric gland fluid through the mucus were observed. The model of gastric defense that includes an alkaline mucus gel and viscous fingering of secreted acid through the mucus may be appropriate at the intragastric pH of the fasted, but not fed, animal.
J. Clin. Invest. 103:605–612 (1999)
Introduction
The discovery of gastric acid in the 16th century (1), originated one of the oldest questions in medicine, about how is the gastric mucosa is defended from damage by extremely acidic luminal solutions. This gastric barrier to acid is multifaceted and includes a preepithelial mucus–bicarbonate layer, a tight epithelial layer, and subepithelial components such as blood flow (2). The mucus–bicarbonate layer is the first line of defense against acid, but is one of the least understood components because it is extracellular and has physical properties that resist conventional means of study. Microelectrode measurements of pH within the mucus gel layer have suggested that bicarbonate secreted from the gastric epithelium is sequestered within adherent mucus to form a protective alkaline layer at the epithelial surface (2–4). This concept of surface pH regulation has been the dominant paradigm for understanding how the stomach copes with the daily challenge of acid secretion in response to food intake. Compromises in surface pH regulation and/or mucus integrity have also been proposed to explain some actions of exogenous agents that compromise the gastric barrier to acid, e.g., nonsteroidal anti-inflammatory drugs, alcohol, Helicobacter pylori.
The difficulty of measuring gastric surface pH has limited extensive testing of the model for the regulation of gastric surface pH. Using pH-selective electrodes and microelectrodes to invasively measure pH within the mucus gel, a relatively alkaline (pH 5–7) mucus gel layer is consistently observed when tissue is bathed in more acidic (< pH 3) unbuffered solutions or in the presence of inhibitors of acid secretion (4–6). In contrast, there are conflicting reports concerning the absence or presence of the alkaline layer when gastric acid secretion is active (3, 4). Controversy exists about the ability of secreted acid to penetrate from the base of the gastric pits to the surface and then on through the mucus gel, without affecting surface pH. Secreted gastric acid undoubtedly exits gastric glands under hydrostatic pressure (7) and leaves the glandular epithelium unscathed because of the intrinsic proton impermeability of the apical membranes of gastric gland epithelia (8). This provides a physiologic model that correlates with in vitro results, which demonstrated that HCl under hydrostatic pressure could tunnel through spontaneously formed channels in isolated gastric mucus (9). This process, termed “viscous fingering,” led to the current vision of acid being expelled from the outlet of the gastric gland (at the base of gastric pits) and streaming undiluted through mucus without impinging on the surface. This model has been supported by vital Congo red staining of gastric mucosa, which qualitatively reported acidic areas over gastric pits (4, 10). Nevertheless, it has not been possible to consistently identify acidic streams emanating from gastric pits with other methods (4, 11).
Here we introduce the technology of in vivo confocal microscopy to studies of gastric surface pH. We observe substantial changes in the transporters that control surface pH when luminal pH is changed and only a limited role of the adherent mucus gel layer in regulation of surface pH at luminal pH values found either in fasted or fed animals.
Methods
In vivo stomach preparation.
Before experiments, rats were either fed ad libitum or fasted overnight. All animals had access to water ad libitum and were housed in cages that did allow coprophagia. Surgery to exteriorize and evert the stomach of rats has been described previously (12). Briefly, male or female rats weighing 250–350 g were anesthetized with 87 mg/kg ketamine and 13 mg/kg xylazine; then a midline incision was made across the abdomen to permit moving the stomach to the exterior of the body. The exteriorized stomach was opened by incision along the greater curvature and everted (inside out) to expose the mucosa. During eversion, stomach contents from some animals were collected for pH measurement with a conventional pH electrode (Ross semi-micro combination pH electrode model 8115; Orion Research, Boston, Massachusetts, USA). All incisions were cauterized to prevent bleeding, and the abdominal incision was stitched partially closed to keep the exteriorized, everted stomach in a relatively fixed position against the outer abdominal wall. Surgically prepared animals were placed prone on the microscope stage, with a portion of the stomach body protruding down into a 1.5-mm hole in the top of a microscope chamber kept at 37°C. The tissue sealed against the edges of the hole sufficiently to allow continuous perfusion of the chamber cavity, and thereby superfusion of the mucosal surface. Tissue was superfused with Krebs saline (136 mM NaCl, 2.6 mM KCl, 1.8 mM CaCl2, 20 mM HEPES, titrated to pH 3 or pH 5 with NaOH). If necessary, additional doses of anesthetics were given to surgically prepared animals to keep them under anesthesia for the 3–4 h of subsequent imaging experiments. In some surgically prepared animals, a rectal thermister probe (model 43TD; YSI, Yellow Springs, Ohio, USA) was used to monitor body temperature, and/or mucosal blood flow was measured with a laser Doppler flow meter (model BLF21; Transonic Systems, Ithaca, New York, USA), with the probe placed on the exposed gastric mucosa. All experimental procedures were approved by the appropriate Institutional Animal Care and Use Committee.
In vivo confocal pH imaging.
All imaging was performed with coverslip-corrected water immersion objectives (Zeiss 40× C-Apo or 10× C-Apo) to permit quantitative imaging in aqueous solutions (13) in a Zeiss LSM410 confocal microscope. To measure extracellular pH in an acid environment, we used 0.01 mM Cl-NERF added to all superfusate solutions. This small fluorescent dye (452 molmolecular weight) has a pKa of 4 (Molecular Probes Inc., Eugene, Oregon, USA). To provide an internal reference for every measurement, all superfusates also contained 0.5 mM Lucifer yellow, which has a similar molecular weight (457), and pH-insensitive fluorescence (13). In response to 488-nm Ar laser illumination, the LSM410 separately but simultaneously measured confocal fluorescence at 550–600 nm (Cl-NERF) and 620–680 nm (Lucifer yellow) and confocal reflectance of 488 nm light (tissue and mucus architecture). The fluorescence intensity ratio of 550–600 nm to 620–680 nm was calibrated daily versus a pH 4 solution on the confocal microscope stage to compensate for differences in instrument settings. Experimental emission ratio images were converted to pH values (Metamorph software; Universal Imaging, West Chester, Pennsylvania, USA) as described previously (13, 14). Before ratio formation, image masking was used to exclude from calculation any off-scale pixel values (0 or 255) in the raw images. For calibration, droplets of dye mixture were imaged on the confocal microscope stage, and the ratio of fluorescence emissions was a predictable function of droplet pH measured by a pH electrode (Ross electrode; Orion Research) (Fig. 1). As shown, the ratio was useful from pH 2–6 but most sensitive between pH 3–5. If values of pH > 6 or pH < 2 were calculated in experiments, they were assigned values of 6 or 2, respectively, to more conservatively estimate pH near the edges of the pH calibration range.
Figure 1.

Calibration curve of fluorescence emission ratio versus pH. Superfusate fluid containing 0.01 mM Cl-NERF and 0.5 mM Lucifer yellow was titrated to the indicated values. Droplets of fluid were placed in the microscope chamber and imaged as described in Methods. Ratio values were calculated pixel by pixel after background subtraction from raw images (using images of regions without dye). Average values of three experiments are presented versus solution pH. Standard deviations were smaller than the symbols. NERF.
Spatial resolution.
Using resident Zeiss software in the microscope that calculates spatial resolution based on standard equations (15), we estimated resolution based on our prevailing light wavelengths, confocal pinhole diameters, and the refractive index of water. Images collected in the focal plane of the microscope (x–y plane) had calculated spatial resolution of 0.3 μm or 0.7 μm, depending on whether the 40× or 10× objective lens was used. The calculated optical plane thickness was 2 μm for the 40× lens and 20 μm for the 10× lens. Images collected directly along the focal axis of the microscope (x–z plane) had the same spatial resolution as the optical plane thickness in x–y images. During experiments, either x–z or x–y images were collected without averaging, taking approximately 1 s per image.
Image analysis.
For all analyses of surface pH and mucus gel thickness, images were collected in a plane that was roughly perpendicular to the mucosal surface, and the region above and below the image plane was clear of protruding tissue. Postacquisition image analysis was performed using either the Zeiss LSM operating system software or Metamorph software. Results are presented as mean ± SEM. Depending on the comparison being made, the number of observations used for statistical comparisons was the number of animals or the number of single-point measurements, and this is always noted. When the number of observations was derived from single-point measurements, compiled results included observations from at least three animals, and the number of animals was indicated. Single-point measurements were compiled only when comparisons were made between two variables in each image, e.g., pH versus gel thickness, gastric pit pH versus surface pH, or heterogeneity of mucus gel thickness in each image. In this case, each value was an independent determination that was used to measure the representative response from a defined set of structures and correlate variables that were linked via their physical location in tissue. Mucus gel thickness was estimated from confocal images by identifying a spot at the tissue surface and measuring the minimal distance from that point to the interface between the mucus gel and the superfusate. The areas assumed to be within the mucus gel were those in which suspended debris are visible (see Results). Therefore, we assumed that when the suspended debris were no longer visible, we had come to the edge of the gel. In preliminary experiments, microspheres (10 μm in diameter) were used to test this assumption, because small particles dropped on the exposed mucosa are known to stick at the solution–gel interface (16–18), and the debris edge precisely matched the location to which the microspheres settled when dropped onto tissue (data not shown). In any given image, 20–35 surface locations were analyzed to correlate pH with mucus gel thickness. In all statistical comparisons, an unpaired two-tailed Student's t test was used for determination of statistical significance.
Results
To establish the method of in vivo confocal microscopy, it was first necessary to define the stability of the animal preparation. Gastric mucosal blood flow was measured with a laser Doppler flow meter. Results were uncalibrated versus absolute flow rate and were used solely to semiquantitatively measure the stability of blood flow, which was similar before (35.6 ± 1.3 arbitrary units) versus after (35.1 ± 1.4 arbitrary units) three to four hours of experimentation on the confocal stage (mean ± SEM, n = 9 animals). Body temperature was also measured using a rectal thermister probe in another series of nine animals before (36.0 ± 0.3°C) and after (35.3 ± 0.3°C) three to four hours on the confocal stage. Both measurements indicated that the surgical preparation was stable.
A major goal was to determine gastric surface pH under physiological conditions of luminal pH, so the pH of rat stomach contents was measured with a conventional pH electrode. Stomach contents were collected during surgery to evert the stomach. After dilution with distilled water, the gastric contents from fed rats was pH 4.5 ± 0.2 (n = 10 animals; unused fresh rat chow = pH 6.1) and in overnight-fasted rats was pH 2.7 ± 0.2 (n = 4 animals). Diluted gastric contents were well buffered, and pH values were not affected by varying dilution (data not shown). Based on these results, pH 5 or pH 3 superfusates were used to model fed or fasted intragastric pH, respectively. As shown in Fig. 1, this pH range is suitable for pH measurement using the Cl-NERF dye having a pKa of 4.
It was essential that the imaging protocol provided the ability to recognize tissue architecture and location. Therefore, confocal laser reflectance was used to identify essential physical landmarks in the tissue. As shown in the x–y image of Fig. 2a, taken tangential to the mucosal surface, the resolution of the optical method (see Methods) was sufficient to view individual surface epithelial cells and the openings of gastric pits. In an x–z image taken perpendicular to the surface (Fig. 2b), the gastric mucus layer covering the epithelial surface was detectable by virtue of debris that remained suspended in the gel. As shown, the mucus gel was of variable thickness even within local regions (< 1 mm) of the mucosa, such that the maximum gel thickness was 3.4 ± 0.2-fold greater than the minimum (mean ± SEM, n = 106 images). A frequency histogram of mucus gel thickness (Fig. 2c) confirmed that the measured thickness was virtually identical to that reported in fresh sections (19). This suggests that the superfused preparation had no detectable loss or enhancement of the gel layer versus conventional preparations.
Figure 2.

In vivo imaging of rat gastric mucosal surface with confocal microscopy. The mucosa was imaged in a Zeiss LSM410 confocal microscope using a C-Apo 40× objective, during continuous superfusion with Krebs saline containing Cl-NERF and Lucifer yellow, as described in Methods. Images were collected in 1 s. (a) x–y focal plane image of confocal reflectance. Epithelial surface and openings of gastric pits (p) were seen at single-cell resolution. (b) x–z focal plane perpendicular to the x–y plane. Confocal reflectance imaging from the superfusate (sf) into the mucus layer (m) adjacent to the epithelial surface (e), with evident pits (p). (c) Quantitative measurement of surface mucus layer was performed on 106 reflectance images from 28 rats in which the mucus gel layer was measurable throughout the image. Maximum and minimum gel thickness was measured in each image. The resulting frequency histogram of the 212 gel thickness values was plotted. (d) Confocal fluorescence image of 550–600 nm emission. Dye penetrates into gastric pit lumens (p) from the superfusate (sf), but does not permeate beyond the epithelial boundary (e).
When imaging the dyes in the superfusate, all extracellular spaces adjacent to the epithelial surface were fluorescent. Because tissue did not take up the dye, all spaces that became fluorescent were presumed to mix with the superfusates. Fig. 2d shows a fluorescence image collected tangential to the mucosal surface, and extending beyond the edge of tissue to image the adjacent superfusate as well. As shown in Fig. 2d, it was possible to image dyes in the gastric pit lumen. In contrast, fluorescence was not observed in the gastric gland lumen (which originates at the base of gastric pits) despite being able to image such structures by confocal reflectance when focusing within tissue (data not shown). The presence of dye in gastric pits suggested that these surface invaginations must contain a mixture of luminal and gland fluids.
Experiments were used to determine if the NERF/ Lucifer yellow dye mixture could accurately measure pH within gastric mucus gels. Adherent mucus was scraped from the gastric mucosal surface to isolate the gel from the influence of gastric secretions. A bolus of mucus was placed in a microscope chamber and immersed in a fixed amount of solution of varying pH. Fig. 3 compares the pH that was reported by the dye mixture within the isolated mucus gel with that reported in adjacent solution. Results in Fig. 3 show that mucus gel pH was linearly correlated with solution pH (least squares fit r2-0.904 n =16 measurements from 3 animals) with a slope of 0.83 ± 0.07. This nonideal response suggests that over the range of pH 3–5, the maximum error is 0.2 pH units between mucus gel and perfusate values. As shown in subsequent results, this is a slight difference compared with observed physiological pH gradients, and therefore results were not corrected for this error.
Figure 3.

Comparison of pH values reported by NERF/Lucifer yellow in isolated gastric mucus gel versus adjacent solution. A fixed volume of superfusate solution of different pH value was placed in a microscope chamber with a bolus of mucus scraped from the surface of rat gastric mucosa. The chamber was not continuously superfused, and solutions were static for 5–15 min before analysis. Confocal reflectance then defined the location of mucus gel in the chamber, and confocal fluorescence emission ratio was averaged separately from regions within and outside mucus in the same chamber. Each data point averages results from a single chamber, with separate data collected from mucus of three animals. The solid line is the linear least squares fit of the data, and the dotted lines indicate the 95% confidence intervals on the fit (Prism software; GraphPad San Diego, California, USA).
Relatively alkaline surface pH at fasted luminal pH.
In vivo confocal microscopy was performed using pH 3 superfusion to mimic the intragastric pH of overnight-fasted rats. With pH 3 superfusion, gastric surface pH was relatively alkaline compared with the superfusate (Fig. 4a). In the 25 μm directly adjacent to the surface, pH 4.12 ± 0.09 was observed under continuous superfusion (n = 11 animals). Under pH 3 superfusion, there was no significant difference (P = 0.34) between the surface pH of fasted rats (pH 4.08 ± 0.18, n = 3 animals) versus fed rats (pH 4.31 ± .12, n = 8 animals), so results from both groups of animals have been combined in further analyses.
Figure 4.

Base secretion at luminal pH 3. Tissue was imaged with a C-Apo 10× objective during superfusion with NERF/Lucifer yellow–containing Krebs saline at pH 3. Emission ratio fluorescence images were calculated from a time course experiment using a single tissue and calibrated versus pH as described in Methods. Dark spots above the mucosal surface were regions masked out during image analysis because they had off-scale fluorescence due to suspended gel debris that bound dye. Correspondence of pseudocolor to pH is shown in the bar. (a) There was a relative alkaline surface pH on gastric mucosa during pH 3 superfusion. After collecting this image, superfusion was stopped and images were collected after (b) 10 s (c) 20 s, and (d) 60 s to show active secretion of base from the surface. When superfusion was turned on again directly after (e), accumulated base in the chamber was washed out over the same time course (f–h), and surface alkaline layer returned to thinner dimensions. Similar results were obtained in five experiments.
If superfusion flow was stopped transiently (Fig. 4, b–d), the alkaline region expanded from the surface to raise pH in regions >300 μm from the surface, and surface pH would increase to values that were off scale for our optical measurements (> pH 6). Observations qualitatively matched prior microprobe studies, which were predominantly performed with nonperfused preparations (2, 4–6). Stop-flow effects were rapidly reversed by restarting flow (Fig. 4, e–h). It should be noted that with the micrometer resolution of confocal imaging (see Methods), it was usually impossible to obtain multiple images from precisely the same region because tissue moved a few microns during animal breathing and slight contractions of the stomach. Based on these results, we conclude the mucosa continually secreted net base equivalents during pH 3 superfusion.
Prostaglandin E2 (PGE2) is a potent stimulator of gastric bicarbonate secretion (20). If 10 μg/ml topical dimethyl PGE2 (dm-PGE2) was added to the tissue, the gastric surface pH alkalinized (from pH 4.12 ± 0.09 to pH 4.78 ± 0.19, P = 0.006; n = 11 or 3 animals, respectively), the thickness of the gel layer tended to increase, albeit not significantly (control 52 ± 9 μm, n = 11 animals; after dm-PGE2 69 ± 15 μm, n = 3 animals), and the thickness of the alkaline layer increased (shown qualitatively in Fig. 5, a and b). During pH 3 superfusion, the pH within gastric pits (pH 5.28 ± 0.08, n = 71 pits, 4 animals) was higher than the pH on the adjacent surface epithelium (pH 4.33 ± 0.07, n = 71 measurements in the same images; P < 0.0001), suggesting that gastric pits were one site for production of alkali. After a three-minute treatment with dm-PGE2 in the same animals, pH was significantly increased (P < 0.0001) in the pits (pH 5.80 ± 0.05, n = 71 pits) and on the adjacent surface (pH 4.86 ± 0.09, n = 71 measurements in the same images). Results show that the alkaline surface pH was maintained by regulated base secretion from the mucosa.
Figure 5.

Relationship between surface pH and mucus gel thickness during pH 3 superfusion in the absence or presence of PGE2. (a) Confocal fluorescence ratio image, with correspondence of pseudocolor to pH shown in the bar. In the absence of any addition to superfusate, surface pH was alkaline and gastric pits (p) were more alkaline than surface. (b) The same tissue imaged 3 min after topical 10 μg/ml dm-PGE2. (c) Surface pH was averaged from the space 25 μm adjacent to the mucosal surface and correlated versus gel thickness at the pH measurement site in the same image. Scatter plot of individual measurements of surface pH and gel thickness in absence of any addition (open triangles) (n = 574 measurements, 11 animals) and 2–5 min after addition of 10 μg/ml topical dm-PGE2 (closed circles; n = 325 measurements, 3 animals). (d) Compilation of results from pH 3 superfusion without (gray bars) or with (blue bars) dm-PGE2 treatment. Gel thickness was grouped in values of 25 μm. Surface pH values are mean ± SEM (n = 6–197 measurements in different groups). dm-PGE2, dimethyl PGE2; PGE2, prostaglandin2.
The thickness of the mucus gel layer has been proposed as an important determinant of surface pH via sequestering secreted bicarbonate (2). The observed local variability in gel thickness (shown in Fig. 2) is therefore predicted to affect the ability of the gel to protect surface pH, but has not been addressed previously. To determine more precisely the role of the mucus layer, measurements directly correlated local surface pH versus local mucus gel thickness measured simultaneously at the identical site, in either the absence or presence of dm-PGE2. Raw results are shown as a scatter plot of individual results (Fig. 5c) and after grouping mucus gel thickness in 25-μm increments to compile results (Fig. 5d). Results show that surface pH was distinct from superfusate pH at all values of mucus gel thickness and that a local gel thickness of 25–75 μm provided the most alkaline surface environment. Gels > 100 μm clearly provided no greater surface pH protection than 25–75 μm gels. Results show that an alkaline surface pH generated by mucosal base secretion is available to protect the epithelium from acidic gastric pH observed in the fasted condition, but that the surface pH is only partially determined by the thickness of the mucus gel layer.
Relatively acidic surface pH at fed luminal pH.
To mimic the intragastric pH changes that occur in response to a meal, superfusion was rapidly switched from pH 3 to pH 5. Surprisingly, the pH gradient reversed (Fig. 6, compare a with b) such that surface pH became more acidic than the pH 5 superfusate over 15–30 minutes. After equilibration under pH 5 superfusion, there was no significant difference (P = 0.29) between the surface pH of fed animals (4.02 ± 0.08, n = 3 animals) versus fasted animals (3.69 ± 0.24, n = 4 animals), so results of further analyses have combined results from both groups.
Figure 6.

Surface pH regulation during switch from pH 3 to pH 5 superfusion. (a) Alkaline surface pH during pH 3 superfusion. (b) The gastric mucosa in a was exposed to pH 5 superfusion and imaged 30 min later. The surface pH became acidic relative to superfusate. Similar results were observed in five experiments. (c) Quantification of superfusate pH as a function of distance from the gastric surface. Results are mean ± SEM from three rats during tissue superfusion with pH 5. Results from the same tissues before (open circles) or 30 min after intravenous injection with 8 mg/kg omeprazole (closed circles).
We questioned whether the acidic surface was the result of continuous acid secretion during pH 5 superfusion. To test involvement of parietal cell H,K-ATPase (the molecule primarily responsible for gastric acid secretion), pH was quantified in the same animals before and after intravenous injection with 8 mg/kg omeprazole (17) (a covalent inhibitor o f H,K-ATPase; ref. 21). Before omeprazole treatment, gastric pit pH (3.55 ± 0.04, n = 100 measurements) was more acidic than adjacent surface pH (3.89 ± 0.02, n = 55 measurements) in the same images (data from four animals, P < 0.0001). Both gastric pit pH and surface pH alkalinized (P < 0.0001) 30 minutes after omeprazole injection (pH 3.94 ± 0.04, n = 60 measurements; and pH 4.66 ± 0.04, n = 60 measurements, respectively; each mean compiled from four animals). Omeprazole eliminated the pH gradient near the surface (Fig. 6c). This suggested that the secreted acid could potentially originate from gastric pits and showed that surface pH control was dependent on H,K-ATPase activity. In addition, transiently halting flow of the pH 5 superfusate (Fig. 7, a and b) led to expansion of the acid region from the surface. Results confirm the continual secretion of net acid from the mucosa by the H,K-ATPase during pH 5 superfusion. However, as shown in Figs. 6 and 7, despite the documented presence of acid secretion, there was no indication of channels carrying streams of primary gastric gland fluid (having pH <2).
Figure 7.
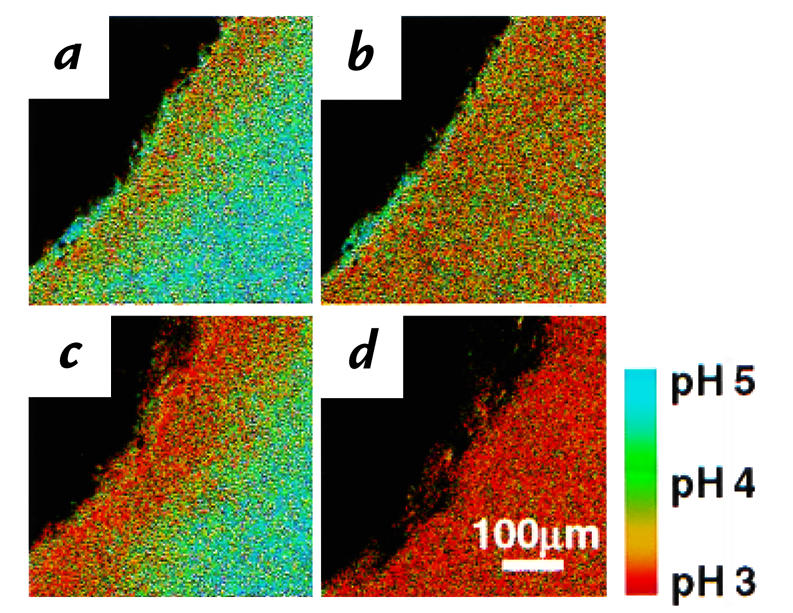
Continuous acid secretion during pH 5 superfusion is regulated by gastrin. Confocal images were collected during a time course exposing a single tissue. Dark spots near the mucosal surface were regions masked out during image analysis because they had off-scale fluorescence due to suspended gel debris that bound dye. The correspondence of pseudocolor to pH is shown in the bar. (a) A relatively acidic surface pH was observed on the unstimulated gastric mucosa during pH 5 superfusion. After collecting this image, superfusion was stopped, and (b) an image was collected after 3 min to show acid accumulation in the chamber. After restarting superfusion (c), an image was collected 5 min after pentagastrin injection (50 μg/kg intravenously). (d) Superfusion was again turned off for 3 min, demonstrating greater acid accumulation in the chamber after gastrin stimulation. Similar results obtained in four experiments.
To test the effects of a physiologic regulator of acid secretion, we applied a known acid secretagogue (pentagastrin; 50 μg/kg intravenously) during pH 5 superfusion. As shown qualitatively by comparing Fig. 7a with c, pentagastrin acidified the surface pH (pH 3.50 ± 0.22, n = 4 animals) compared with control conditions (pH 4.15 ± 0.19 μm, n = 9 animals), although the effect only approached significance in this unpaired whole animal comparison (P = 0.06). If superfusion was stopped after gastrin administration (Fig. 7d), the stronger acidification compared with control (compare Fig. 7, d with b) supported the presence of increased net acid secretion. Under pH 5 superfusion, the average mucus gel thickness (48 ± 12 μm, n = 10 animals) was increased by pentagastrin (112 ± 24 μm, n = 4 animals) (P < 0.02), as observed by other investigators using different methods (16).
The gastric mucus is believed to protect surface pH protection from secreted acid (2). To question this role during pH 5 superfusion, measurements directly correlated local surface pH versus local mucus gel thickness in either the presence or absence of pentagastrin. Results are either presented as a raw scatter plot of individual measurements (Fig. 8a) or compiled after grouping values of mucus gel thickness (Fig. 8b). In the absence of pentagastrin, surface pH tended to approach superfusate pH 5 when gels were >150 μm thick. Surface pH was independent of mucus gel thickness in the presence of pentagastrin. Statistical comparisons of results in Fig. 8b show pentagastrin caused significant acidification of surface pH (P < 0.0038) at every range of mucus gel thickness.
Figure 8.

Relationship between surface pH and mucus gel thickness during pH 5 superfusion, in the absence or presence of gastrin. Gastric mucosa was superfused with pH 5 Krebs solution during confocal imaging. (a) Surface pH averaged from the space 25 μm adjacent to the mucosal surface versus gel thickness at the pH measurement site in the same image. Scatter plot of individual measurements of surface pH and gel thickness in absence of any addition (open triangles; n = 664 measurements, 9 animals) and 10–15 min after addition of pentagastrin (closed circles; n = 701 measurements, 4 animals). (b) Compilation of results from pH 5 superfusion without (gray bars) and with (red bars) pentagastrin. Gel thickness was grouped in values of 25 μm. Surface pH values are mean ± SEM (n = 14–151 measurements in individual groups).
Discussion
Confocal microscopy allowed the simultaneous measurement of gastric surface pH and mucus gel layer thickness using a noninvasive method. In contrast to microprobe work, it was not necessary to physically disturb the gel in order to measure surface pH, and the technique used has well-defined spatial resolution. While the new method cannot accurately report some pH values of importance to gastric physiology (e.g., pH 0.7–2), there are a number of questions whose answers fall within the range of the method. The unusual aspects of the new method are the use of perfusion and the use of optical pH measurements, which are considered below.
Results were qualitatively similar, whether made under continuous superfusion or when superfusion flow was transiently stopped. The static condition tended to exaggerate surface pH gradients and more closely resembled experimental conditions applied in most microprobe work. Conversely, superfusion does not allow gastric secretions to regulate bulk luminal pH, and so this condition may underestimate the physiologic influence of secretions on surface pH values. It is reassuring that confocal results were similar in both static or flow conditions, because it is unclear which case most closely resembles conditions in native tissue. The stomach is constantly moving to mix luminal contents, so it is certainly not fully static.
The optical pH measurement reported nonideal behavior (83% of ideal response) for pH in isolated gastric mucus, for unknown reasons. One explanation is that mucin glycoproteins could have altered pH in an ocean of solution if they mediated enzymatic activity independent of tissue and any provided energy supply. However, pH in the mucus tended to be reported as alkaline, and pH in the static (nonperfused) chamber was constant over the measurement interval (data not shown), making metabolism an unlikely explanation of our results. A more attractive alternative is the presence of fixed charges in the mucin that could lead to a net realignment of protons via electrostatic forces. However, we have no compelling rationale to accept or reject either hypothesis. When considering whether a dye artifact is the explanation for the systematic difference, we note that the relationship between solution pH and mucin pH is linear form pH 3–5 (more precisely, statistics say that the fit is “not nonlinear” with a P = 0.2). Linearity suggests that results are unlikely to be explained by a simple change in dye pKa. Based on the uncertainty, it is best to view results from the worst-case scenario assumption of dye artifact, which leads to an error of 0.2 pH units or less.
Even from this pessimistic viewpoint, there are many reasons to believe that systematic differences in measurement of mucus pH have not obscured physiologically relevant results and conclusions. First, the stop-flow experiments show that sites of nonequilibrium pH near the surface can rapidly and reversibly change position in a way that does not correlate with mucin structure. For example, in Fig. 4, the debris in the gel (dark spots) did not move, suggesting no change in mucus gel structure over these two minutes. Second, although the predicted artifact is <0.2 pH units in the range from pH 3–5, much larger pH differences between the superfusate and the surface are routinely measured over this same pH range. The pH difference at the surface is often 2 pH units away from the superfusate in individual measurements, and average values of surface pH can be more than 1 pH unit away from the superfusate. Third, increases in mucus gel thickness (presumably from increasing mucus secretion) can be dissociated from qualitatively opposite effects on overall surface pH, depending on whether the increase is caused by dm-PGE2 or gastrin. Finally, omeprazole eliminates surface pH gradients in pH 5 superfusate. This suggests that the putative error is even likely to be within the noise of our native tissue measurements (because we cannot average images to lower pixel-to-pixel variation as we could in the static mucin calibration of Fig. 3).
Our results have implications for the acid-tunneling (viscous fingering) hypothesis of gastric defense (9). Using a 4–25× stereo microscope, other investigators have used Congo red to see 15-μm-diameter patches of acidity near the mucosa that have been suggested to be channels carrying gastric gland fluid to the surface (10). No such channels were observed using in vivo confocal microscopy, which has greater spatial resolution and a demonstrated ability to resolve pH differences between pit and surface regions. Given the observed approximate pH of 4 in the mucus gel and our ability to localize the openings of single gastric pits, we should have easily resolved viscous fingers of primary acid secretion by gastric glands (having pH <2). Although the gastric gland effluent has a pH beyond the calibration range of Cl-NERF, such a low pH would have been readily detected by its contrast against the higher mucus gel pH. However, channels of acidic pH within the gastric pits or juxtamucosal mucus gel layer were never observed during active acid secretion or active base secretion. We suggest that mixing between superfusate and gland secretions must occur within pits, because during acid secretion, gastric pit pH did not approach the lower limits of our pH-reporter dye, and luminal dye was present in the pit lumen. None of these observations can be easily reconciled with the concept that secreted acid leaves the gastric gland and traverses the gastric pit in an undiluted stream that penetrates through the mucus gel. It should be noted that the observed diameter of the putative channels (10) is comparable to the diameter of gastric pit openings (see Fig. 2) and that a stereo microscope has poor ability to localize sites of fluorescence along the focal axis of a thick specimen. For these reasons, we hypothesize that prior observations with Congo red may have reported pH from within gastric pits, not within the gel layer (4, 10). While the phenomenon of viscous fingering through mucus is certainly possible (9), we conclude that it is not physiologically abundant when luminal pH is between 3 and 5.
Gastric pit lumens were found to have divergent pH values compared with the space directly adjacent to surface epithelium. When acid secretion was demonstrably active (pH 5 superfusion), gastric pits had lower pH than at the surface. When base secretion predominated (pH 3 superfusion), gastric pits had higher pH than at the surface. Assuming that surface cells did not secrete a fluid that traveled into pits more efficiently than mixing with directly adjacent fluid, this suggests that gastric pits and/or their associated gastric glands were a site mediating both acid and base secretion. However, it was not possible to estimate whether the pits/glands made a larger quantitative contribution to the secretions than did the surface cells.
In our analyses, we could not identify a major role for the thickness of the mucus gel in facilitating surface pH control at the steady state. Surface pH under 100–150-μm gels was similar to values under the thinnest (or unmeasurable) gels. This was observed in the presence of resting acid secretion, stimulated acid secretion, resting base secretion, or stimulated base secretion. During either pH 3 or pH 5 superfusion, gels >100 μm were associated with a surface pH that approached the pH of the superfusate. One potential explanation for these results is that different properties (e.g., density or hydration) of thick versus thin gels led to enhanced mixing between luminal and mucus environments under the thick gels. In the case of pH 3 superfusion (Fig. 5d), results directly suggest a diminished ability of thick mucus to help maintain an alkaline surface pH. However, interpretation of the response to pH 5 superfusion (Fig. 8b) was less clear-cut, because an acidic surface approached pH 5 in thicker gels (at least in the absence of gastrin). In this case, an alternative explanation could be better retention of base equivalents near the surface under thick gels, i.e., enhanced, not diminished, surface protection. This explanation would seem to be in conflict with observations at pH 3. However, even if thick gels were protective of surface pH at luminal pH 5, such protection would probably have minor physiologic impact, because only 10% of the local mucus thickness values were >150 μm in this condition. It should be noted that because of the known ability of mucins to retard proton diffusion (11, 22), there may be an important role of the mucus gel to dampen the kinetics of pH change (18), which would not have been detected in our experiments.
We observe that luminal pH can qualitatively alter regulation of gastric surface pH. Results confirmed prior observations that base (presumably bicarbonate) secretion determines surface pH when luminal pH is acidic, as in the fasted state (4–6). However, a new model emerged after exposure to more alkaline pH in which the parietal cell H,K-ATPase was the predominant regulator of surface pH. Results can be explained by observations that bicarbonate secretion is activated at luminal pH < 3.5 (23) and acid secretion activated at luminal pH > 3 (24). Our results are consistent with one report that the juxtamucosal alkaline layer is absent when gastric acid secretion is active (3), but conflicts with another report that the surface is alkaline in the presence of gastrin (4). Despite changing luminal pH by 2 pH units, the average steady-state surface pH was maintained at pH 3.9–4.5 (compare results in Figs. 5 and 8 in the absence of added agonists), raising the possibility that parietal cell H,K-ATPase is an active participant in surface pH regulation rather than an antagonist of surface pH control.
We hypothesize that the model of bicarbonate secretion protecting the gastric surface may be relevant for the fasted, but not fed, stomach. A meal contains many constituents (e.g., amino acids, calcium) that have the potential to regulate gastric acid and bicarbonate secretion. However, even in the setting of a meal, the postprandial rise in luminal pH is an important stimulant of gastrin release and gastric acid secretion (25–27). Therefore, we interpret our observations to suggest that the epithelium will be directly exposed to gastric acid, albeit partially diluted with luminal contents, in response to a meal. If the first line of defense in the gastric barrier is at the epithelium under some physiological conditions, we must readdress the pathogenesis of acid-induced gastric damage and reconsider the microenvironment favorable to H. pylori colonization of the stomach. Independent of this hypothesis, it will be valuable to unravel the cellular and molecular mechanisms that control the dramatic transition in surface pH regulation during the fasted-to-fed transition of intragastric pH.
References
- 1.Baron JH. The discovery of gastric acid. Gastroenterology. 1979;76:1056–1064. [PubMed] [Google Scholar]
- 2.Allen A, Flemstrom G, Garner A, Kivilaakso E. Gastroduodenal mucosal protection. Physiol Rev. 1993;73:823–857. doi: 10.1152/physrev.1993.73.4.823. [DOI] [PubMed] [Google Scholar]
- 3.Nagano F, et al. Effects of H+ and HCO3- secretion on mucus gel pH in isolated antral mucosa of bullfrog stomach. Bull Osaka Med Coll. 1990;36:13–25. [PubMed] [Google Scholar]
- 4.Schade C, Flemstrom G, Holm L. Hydrogen ion concentration in the mucus layer on top of acid-stimulated and -inhibited rat gastric mucosa. Gastroenterology. 1994;107:180–188. doi: 10.1016/0016-5085(94)90075-2. [DOI] [PubMed] [Google Scholar]
- 5.Ross IN, Turnberg LA. Studies of the “mucus-bicarbonate” barrier on rat fundic mucosa: the effects of luminal pH and a stable prostaglandin analogue. Gut. 1983;24:1030–1033. doi: 10.1136/gut.24.11.1030. [DOI] [PMC free article] [PubMed] [Google Scholar]
- 6.Turnberg LA, Ross IN. Studies of the pH gradient across gastric mucus. Scand J Gastroenterol Suppl. 1984;92:48–50. [PubMed] [Google Scholar]
- 7.Holm L, Agren J, Persson AE. Stimulation of acid secretion increases the gastric gland luminal pressure in the rat. Gastroenterology. 1992;103:1797–1803. doi: 10.1016/0016-5085(92)91437-9. [DOI] [PubMed] [Google Scholar]
- 8.Waisbren SJ, Geibel JP, Modlin IM, Boron WF. Unusual permeability properties of gastric gland cells. Nature. 1994;368:332–335. doi: 10.1038/368332a0. [DOI] [PubMed] [Google Scholar]
- 9.Bhaskar KR, et al. Viscous fingering of HCl through gastric mucin. Nature. 1992;360:458–461. doi: 10.1038/360458a0. [DOI] [PubMed] [Google Scholar]
- 10.Holm L, Flemstrom G. Microscopy of acid transport at the gastric surface in vivo. J Int Med Res. 1990;228(Suppl. 1):91–95. doi: 10.1111/j.1365-2796.1990.tb01478.x. [DOI] [PubMed] [Google Scholar]
- 11.Schreiber S, Scheid P. Gastric mucus of the guinea pig: proton carrier and diffusion barrier. Am J Physiol. 1997;272:G63–G70. doi: 10.1152/ajpgi.1997.272.1.G63. [DOI] [PubMed] [Google Scholar]
- 12.Kaneko K, Guth PH, Kaunitz JD. In vivo measurement of rat gastric surface cell intracellular pH. Am J Physiol. 1991;261:G548–G552. doi: 10.1152/ajpgi.1991.261.3.G548. [DOI] [PubMed] [Google Scholar]
- 13.Chu S, Brownell WE, Montrose MH. Quantitative confocal imaging along the crypt-to-surface axis of colonic crypts. Am J Physiol. 1995;269:C1557–C1564. doi: 10.1152/ajpcell.1995.269.6.C1557. [DOI] [PubMed] [Google Scholar]
- 14.Chu S, Montrose MH. Extracellular pH regulation in microdomains of colonic crypts: Effects of short-chain fatty acids. Proc Natl Acad Sci USA. 1995;92:3303–3307. doi: 10.1073/pnas.92.8.3303. [DOI] [PMC free article] [PubMed] [Google Scholar]
- 15.Pawley, J.B. 1995. Handbook of biological confocal microscopy. Plenum Press. New York, NY.
- 16.Tanaka S, Kaunitz JD. Indomethacin does not alter the effect of pentagastrin on rat gastric defense mechanisms. Peptides. 1996;17:155–159. doi: 10.1016/0196-9781(95)02056-x. [DOI] [PubMed] [Google Scholar]
- 17.Tanaka S, Tache Y, Kaneko H, Guth P, Kaunitz J. Central vagal activation increases mucus gel thickness and surface cell intracellular pH in rat stomach. Gastroenterology. 1997;112:409–417. doi: 10.1053/gast.1997.v112.pm9024294. [DOI] [PubMed] [Google Scholar]
- 18.Engel E, Guth P, Nishizaki Y, Kaunitz J. Barrier function of the gastric mucus gel. Am J Physiol. 1995;269:G994–G999. doi: 10.1152/ajpgi.1995.269.6.G994. [DOI] [PubMed] [Google Scholar]
- 19.Allen A, Hutton D, McQueen S, Garner A. Dimensions of gastroduodenal surface pH gradients exceed those of adherent mucus gel layers. Gastroenterology. 1983;85:463–465. [PubMed] [Google Scholar]
- 20.Flemstrom, G. 1994. Gastric and duodenal mucosal secretion of bicarbonate. In Physiology of the gastrointestinal tract. L.R. Johnson, editor. Raven Press. New York, NY. 1285–1309.
- 21.Sachs G, Shin JM, Briving C, Wallmark B, Hersey S. The pharmacology of the gastric acid pump: the H+,K+ ATPase. Annu Rev Pharmacol Toxicol. 1995;35:277–305. doi: 10.1146/annurev.pa.35.040195.001425. [DOI] [PubMed] [Google Scholar]
- 22.Livingston EH, Engel E. Modeling of the gastric gel mucus layer: application to the measured pH gradient. J Clin Gastroenterol. 1995;21(Suppl. 1):S120–S124. [PubMed] [Google Scholar]
- 23.Matsueda K, et al. Effect of the luminal hydrogen ion on alkali and mucus secretion in the rat stomach. Scand J Gastroenterol. 1989;162(Suppl.):35–38. doi: 10.3109/00365528909091119. [DOI] [PubMed] [Google Scholar]
- 24.Walsh, J.H. 1989. Gastrointestinal peptide hormones. In Gastrointestinal disease: pathophysiology, diagnosis, management. M. Sleisenger and J.S. Fordtran, editors. W.B. Saunders. Philadelphia, PA. 78.
- 25.Walsh J, Richardson C, Fordtran J. pH dependence of acid secretion and gastrin release in normal and ulcer patients. J Clin Invest. 1975;55:462–468. doi: 10.1172/JCI107952. [DOI] [PMC free article] [PubMed] [Google Scholar]
- 26.Konturek JW, Konturek SJ, Domschke W. Cholecystokinin in the control of gastric acid secretion and gastrin release in response to a meal at low and high pH in healthy subjects and duodenal ulcer patients. Scand J Gastroenterol. 1995;30:738–744. doi: 10.3109/00365529509096321. [DOI] [PubMed] [Google Scholar]
- 27.Itoh Z, Takeuchi S, Aizawa I, Honda R. The negative feedback mechanism of gastric acid secretion: significance of acid in the gastric juice in man and dog. Surgery. 1975;77:648–660. [PubMed] [Google Scholar]