

Functional disruption of tyrosylprotein sulfotransferase in Arabidopsis activates photosynthetic gene expression in roots and enhances inhibition of root growth under phosphate deficiency.
Abstract
Plants cope with inorganic phosphate (Pi) deficiencies in their environment by adjusting their developmental programs and metabolic activities. For Arabidopsis (Arabidopsis thaliana), the developmental responses include the inhibition of primary root growth and the enhanced formation of lateral roots and root hairs. Pi deficiency also inhibits photosynthesis by suppressing the expression of photosynthetic genes. Early studies showed that photosynthetic gene expression was also suppressed in Pi-deficient roots, a nonphotosynthetic organ; however, the biological relevance of this phenomenon remains unknown. In this work, we characterized an Arabidopsis mutant, hypersensitive to Pi starvation7 (hps7), that is hypersensitive to Pi deficiency; the hypersensitivity includes an increased inhibition of root growth. HPS7 encodes a tyrosylprotein sulfotransferase. Accumulation of HPS7 proteins in root tips is enhanced by Pi deficiency. Comparative RNA sequencing analyses indicated that the expression of many photosynthetic genes is activated in roots of hps7. Under Pi deficiency, the expression of photosynthetic genes in hps7 is further increased, which leads to enhanced accumulation of chlorophyll, starch, and sucrose. Pi-deficient hps7 roots also produce a high level of reactive oxygen species. Previous research showed that the overexpression of GOLDEN-like (GLK) transcription factors in transgenic Arabidopsis activates photosynthesis in roots. The GLK overexpressing (GLK OX) lines also exhibit increased inhibition of root growth under Pi deficiency. The increased inhibition of root growth in hps7 and GLK OX lines by Pi deficiency was completely reversed by growing the plants in the dark. Based on these results, we propose that suppression of photosynthetic gene expression is required for sustained root growth under Pi deficiency.
Phosphorus is one of 17 essential nutrients required for plant growth and development. In many soils, the availability of inorganic phosphate (Pi), the major form of P that plants uptake, is extremely low (Raghothama, 1999). Consequently, plants have evolved sophisticated strategies to cope with low Pi stress. These strategies fall into two broad categories: those used to enhance Pi acquisition and those directed toward conservation of Pi use (Vance et al., 2003). The strategies in the first category include the remodeling of root system architecture (RSA) and the increase of Pi transporter activities on the root surface. The strategies in the second category include the induction and secretion of acid phosphatases (APases), the accumulation of starch and anthocyanin, the increase in the enzymatic activities involved in the bypass of glycolysis, and the inhibition of photosynthesis.
Under Pi deficiency, Arabidopsis (Arabidopsis thaliana) plants typically exhibit inhibition of primary root growth and stimulation of lateral root and root hair formation. Such remodeling of RSA results in an increased root surface area for Pi absorption. The remodeling process begins with a reduction of cell elongation followed by the progressive loss of meristematic cells (Sánchez-Calderón et al., 2005). At later stages, cell proliferation is arrested, and cell differentiation takes place at the former meristematic and elongation regions of the primary root.
In recent decades, significant progress has been made in our understanding of the intrinsic pathways that control root development. The plant hormone auxin plays a critical role in regulating both primary and lateral root growth (Sabatini et al., 1999; Casimiro et al., 2001). PLETHORA1 (PLT1) and PLT2 are two members of the AP2 family of transcription factors, which are required for the maintenance of the root stem cell niche (Aida et al., 2004). Recently, Zhou et al. (2010) showed that the tyrosylprotein sulfotransferase (TPST) acts upstream of PLT1/PLT2 in maintaining the root stem cell niche in an auxin-dependent manner. The loss-of-function mutant of TPST exhibits stunted root growth.
While our understanding of the intrinsic pathways that regulate root growth has increased greatly, only a few of the key components involved in the regulation of Pi deficiency-induced remodeling of RSA have been identified. The characterization of the low phosphate root1 (lpr1) mutant revealed a role for multicopper oxidase in Pi sensing at the root tip (Svistoonoff et al., 2007). Functional disruption of LPR1 results in an impaired inhibition of primary root growth under Pi deficiency. By contrast, the phosphate deficiency responses2 (pdr2) mutant displays a hypersensitive response of root meristems to Pi deficiency (Ticconi et al., 2004). The PDR2 gene encodes a P5-type ATPase that is localized in the endoplasmic reticulum and interacts with LPR1 genetically in mediating primary root growth under Pi deficiency (Ticconi et al., 2009). Auxin (López-Bucio et al., 2002; Nacry et al., 2005; Pérez-Torres et al., 2008), GAs (Jiang et al., 2007), and ethylene (Borch et al., 1999; Ma et al., 2003; Yu et al., 2012) are also involved in the control of Pi deficiency-mediated remodeling of RSA. Our understanding of the molecular mechanisms that regulate this remodeling process, however, is still in its infancy.
Inhibition of photosynthesis has long been observed for Pi-deficient (P–) plants (Dietz and Foyer, 1986; Sivak, 1986; Jacob and Lawlor, 1992; Rao and Terry, 1995). Severe Pi deficiency damages the energy-transducing system in the thylakoids and inhibits the activities of several key enzymes of the Calvin cycle (Preiss, 1984; Natr, 1992). Pi deficiency also inhibits the export of triose-P from stroma to cytosol by the Pi translocators (Natr, 1992). Under Pi deficiency, most of this photosynthate is converted into starch in chloroplasts. The increased partitioning of photosynthates to starch makes them unavailable to support plant growth. Because the conversion of triose-P to starch also liberates Pi and the light reaction of photosynthesis consumes a large amount of Pi for synthesis of ATP, the inhibition of photosynthesis under Pi deficiency is believed to conserve the use of Pi. Several microarray analyses indicated that the expression of photosynthetic genes was down-regulated in the P– plants (Wu et al., 2003; Misson et al., 2005; Morcuende et al., 2007; Li et al., 2010; O’Rourke et al., 2013). Interestingly, the reduced expression of photosynthetic genes was also observed in roots (Wu et al., 2003; Li et al., 2010). Because root is thought to be a nonphotosynthetic organ, the biological relevance of this phenomenon has received little attention.
In this work, we show that the functional disruption of the TPST activates the expression of many photosynthetic genes in roots. We further demonstrate that suppression of photosynthetic gene expression in roots is essential for sustained root growth under Pi deficiency.
RESULTS
hps7 Exhibits Exaggerated Alteration of RSA under Pi Deficiency
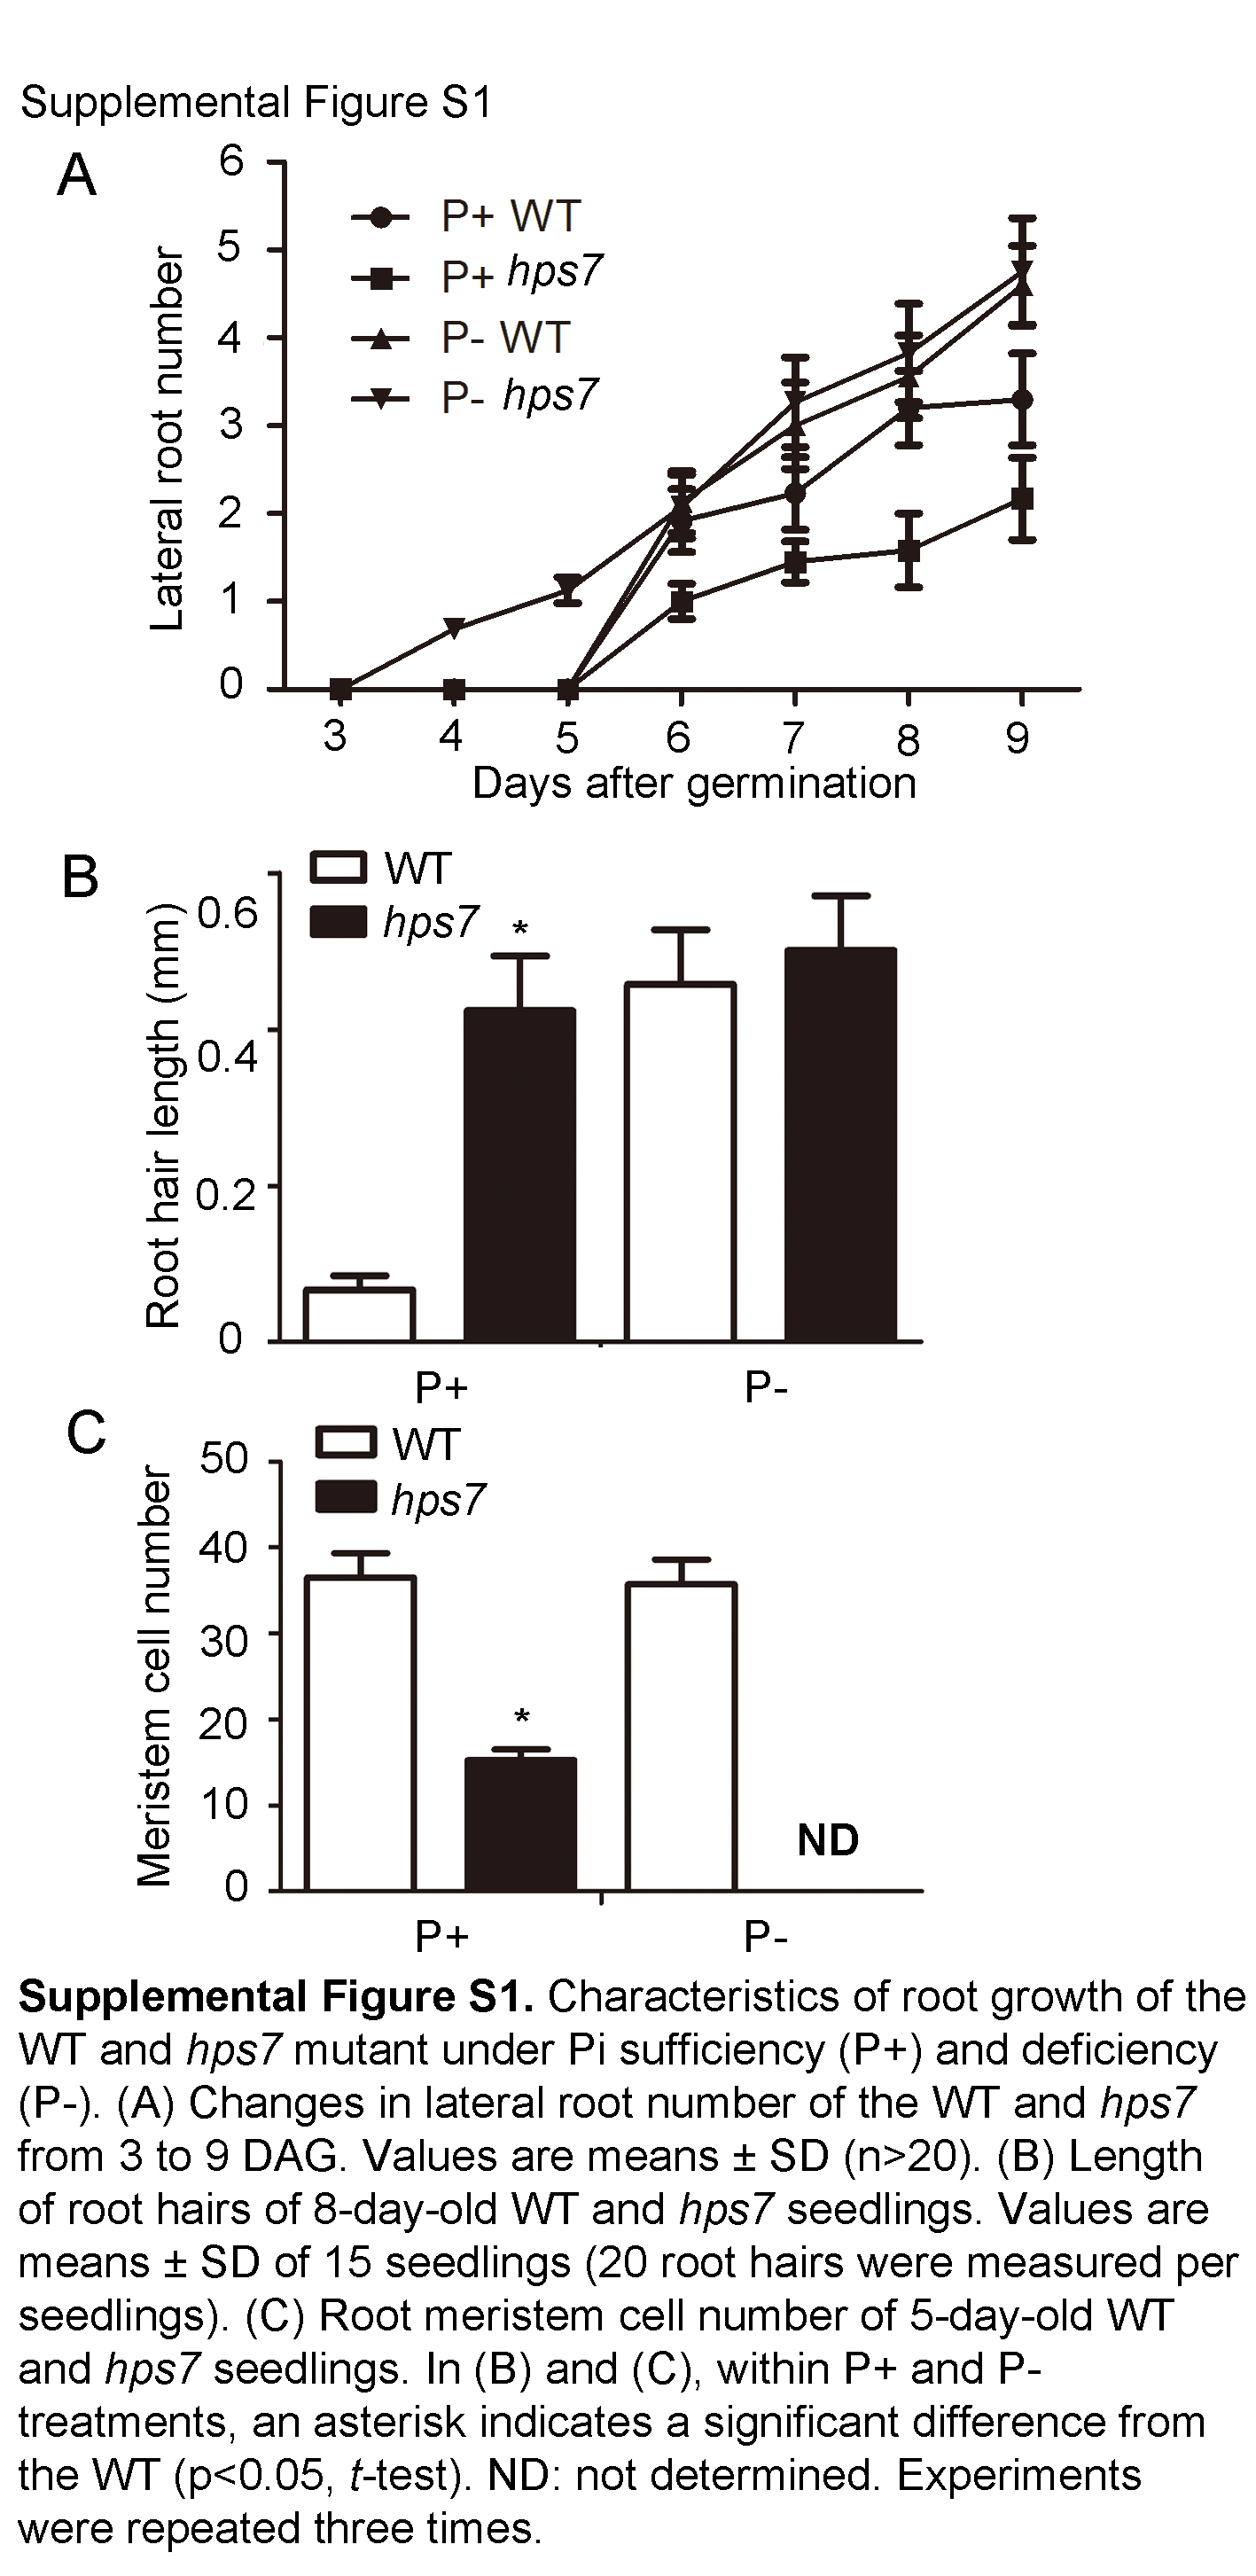
To identify molecular components involved in the Pi deficiency-induced remodeling of RSA, we screened for Arabidopsis mutants with altered Pi sensitivity. M2 seeds from ethyl methanesulfonate-mutagenized M1 plants were directly sown on P– medium. Eight days after germination (DAG), the root morphologies of the seedlings were visually assessed. One mutant, hypersensitive to Pi starvation7 (hps7), exhibited increased inhibition of primary root growth when grown on P– medium (Fig. 1A). At 8 DAG on P– medium, the length of the primary root of hps7 was about 12% of that of the wild type (Fig. 1C). For hps7, the growth arrest of the primary root occurred at 3 DAG, and lateral roots became visible at 4 DAG. For the wild type, by contrast, primary roots stopped growing at 6 DAG (Fig. 1C), where also lateral roots appeared (Supplemental Fig. S1A). The position of the first lateral root was much closer to the root tip, and the distance between lateral roots was much shorter for hps7 than for the wild type (Fig. 1B). In addition, root hairs grew nearly perpendicular to the primary root for the wild type but grew somewhat downward for hps7 (Fig. 1B). Root hair length, however, was similar for hps7 and the wild type under Pi deficiency (Supplemental Fig. S1B).
Figure 1.

Growth characteristics of the wild type (WT) and the hps7 mutant as affected by Pi availability. A, Morphology of 8-d-old wild-type and hps7 seedlings grown on a P+ and a P– medium. B, Close view of the morphology of the first 3-mm segments of the primary roots of the seedlings shown in A. C, Changes in primary root length of the wild type and hps7 from 3 to 8 DAG. Values are means ± sd (n > 20). The experiments were repeated three times.
On Pi-sufficient (P+) medium at 8 DAG, the length of the primary root of hps7 was about one-half of that of the wild type (Fig. 1A). Both the wild type and hps7 developed fewer lateral roots on P+ medium than on P– medium; however, hps7 produced more and longer root hairs than the wild type on P+ medium (Fig. 1B; Supplemental Fig. S1B).
To determine the cellular basis for the enhanced root sensitivity of hps7 to Pi deficiency, we compared the structure of the root apical meristem in the wild type and hps7. On P+ medium at 3 and 5 DAG, the meristem of the wild type had a well-defined cellular organization (Fig. 2, A and B). For hps7, the size of its apical meristem (as defined by the number of cells from the cortical initial cell to the first elongated cell in the cortex layer) was only one-half of that of the wild type, but the overall cellular organization of the meristem was still maintained. On P– medium at 3 DAG, the structure of the hps7 meristem was similar to its structure on P+ medium (Fig. 2A). At 5 DAG, however, the root tip of hps7 became swollen (Fig. 2B). Its meristem became disorganized, and the meristem cells were highly vacuolated. These cells appeared to lose their identities and undergo premature differentiation, as manifested by the formation of root hairs at the edge of the meristem (Fig. 2B).
Figure 2.

Root apical meristem of the wild type (WT) and hps7 as affected by Pi availability. Root tips of wild-type and hps7 mutant seedlings at 3 DAG (A) and 5 DAG (B) on P+ and P– media. White lines indicate the boundary between the root meristematic and elongation zones.
hps7 Is Hypersensitive in Multiple Responses to Pi Deficiency and Has Perturbed Pi Homeostasis
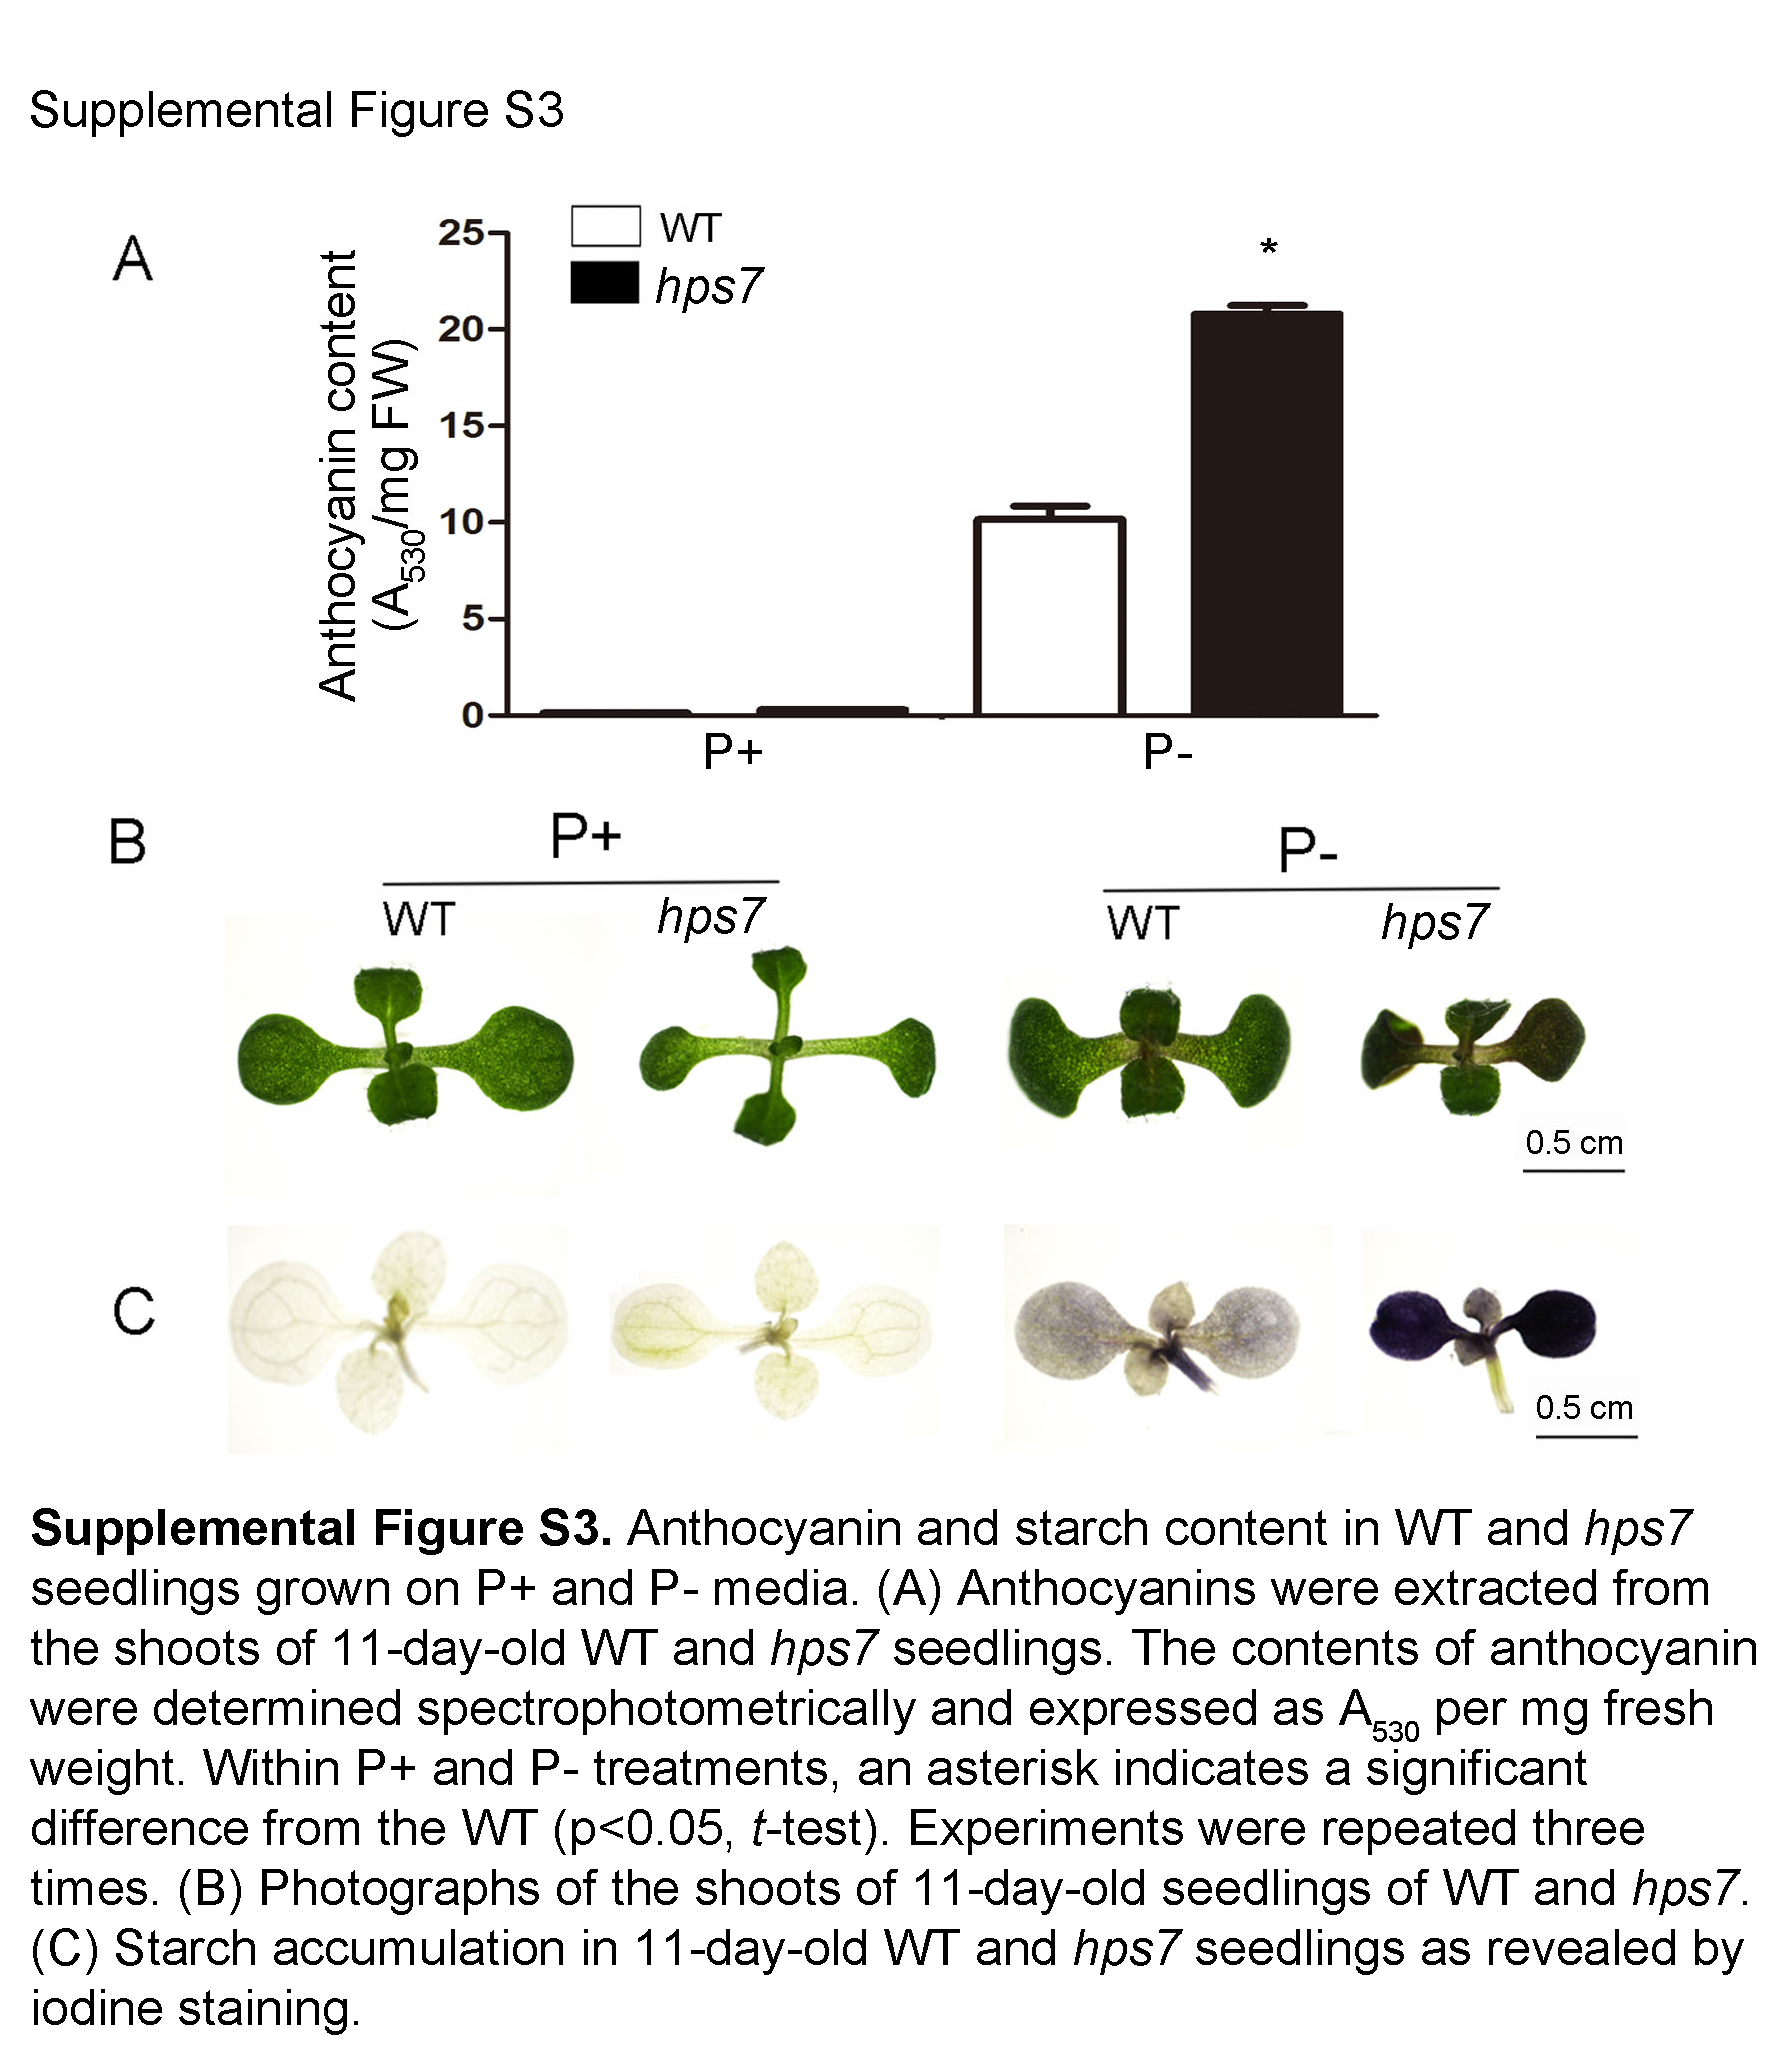
We further examined whether the mutation in HPS7 affected other plant responses to Pi deficiency. One of the typical plant responses to Pi starvation is the induction and secretion of APases. The Pi starvation-induced intracellular APases are likely involved in the remobilization and recycling of Pi from intracellular P monoesters and anhydrides of older tissues. The function of secreted APases is believed to scavenge Pi from organophosphate compounds in the external environment, thus increasing the availability of Pi for plant uptake. On P– medium, 8-d-old hps7 seedlings exhibited enhanced APase activity on their root surface (Supplemental Fig. S2A). The intracellular APase activities of shoots and roots were also higher for hps7 than for the wild type on P– medium (Supplemental Fig. S2B). Under Pi deficiency, plant leaves accumulate high levels of anthocyanin and starch. Accumulation of anthocyanin is thought to protect the chloroplast membranes from nutritional stress, and enhanced starch biosynthesis can bypass glycolytic pathways to conserve the use of Pi for other biochemical reactions. P– hps7 seedlings (i.e. hps7 seedlings grown on P– medium) also accumulated more anthocyanin (Supplemental Fig. S3, A and B) and starch (Supplemental Fig. S3C) than P– wild-type seedlings. We also compared the expression levels of six Pi starvation-induced genes in hps7 and the wild type. The Pi starvation-induced genes examined encode a high-affinity Pi transporter, Pht1;4 (Muchhal et al., 1996), an APase, ACP5 (del Pozo et al., 1999), two noncoding transcripts, At4 and AtIPS1 (Burleigh and Harrison, 1999; Martín et al., 2000), a microRNA, miRNA399D (Fujii et al., 2005), and a ribonuclease, RNS1 (Bariola et al., 1994). As expected, the expression of all these Pi starvation-induced genes was enhanced by Pi starvation in the wild type (Supplemental Fig. S4); however, the level of induction was much higher in hps7 than in the wild type. Taken together, these results indicate that hps7 is hypersensitive in multiple responses to Pi deficiency.
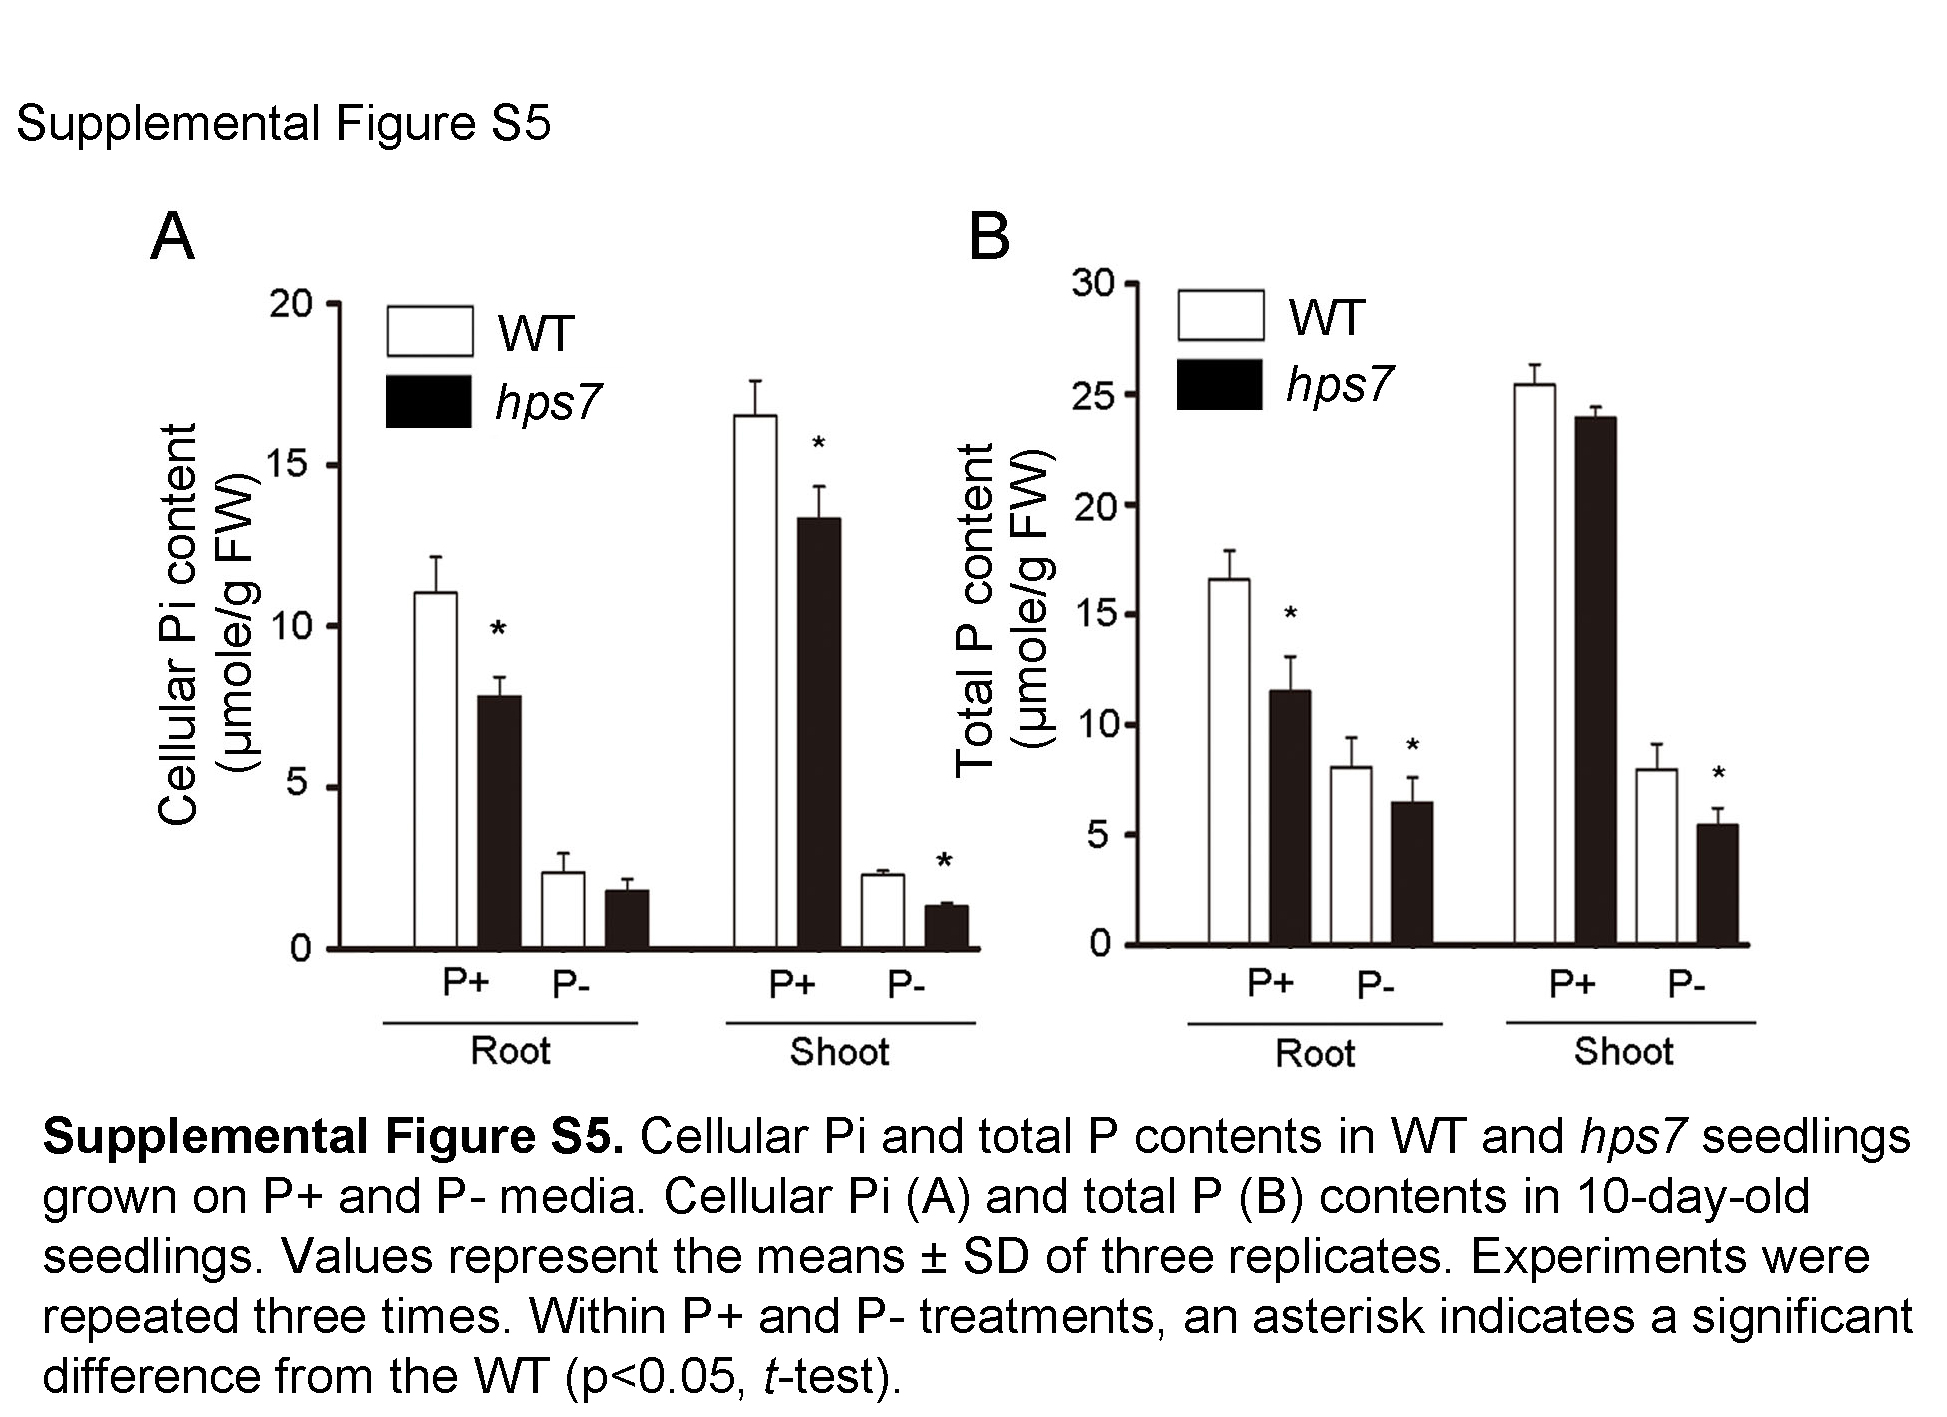
To sustain growth and development, plants must tightly maintain their Pi homeostasis. Quantitative analyses indicated that hps7 had significantly lower cellular Pi content and total P content than the wild type under both P+ and P– conditions (Supplemental Fig. S5). These results indicated that Pi homeostasis was perturbed in hps7.
HPS7 Encodes a TPST
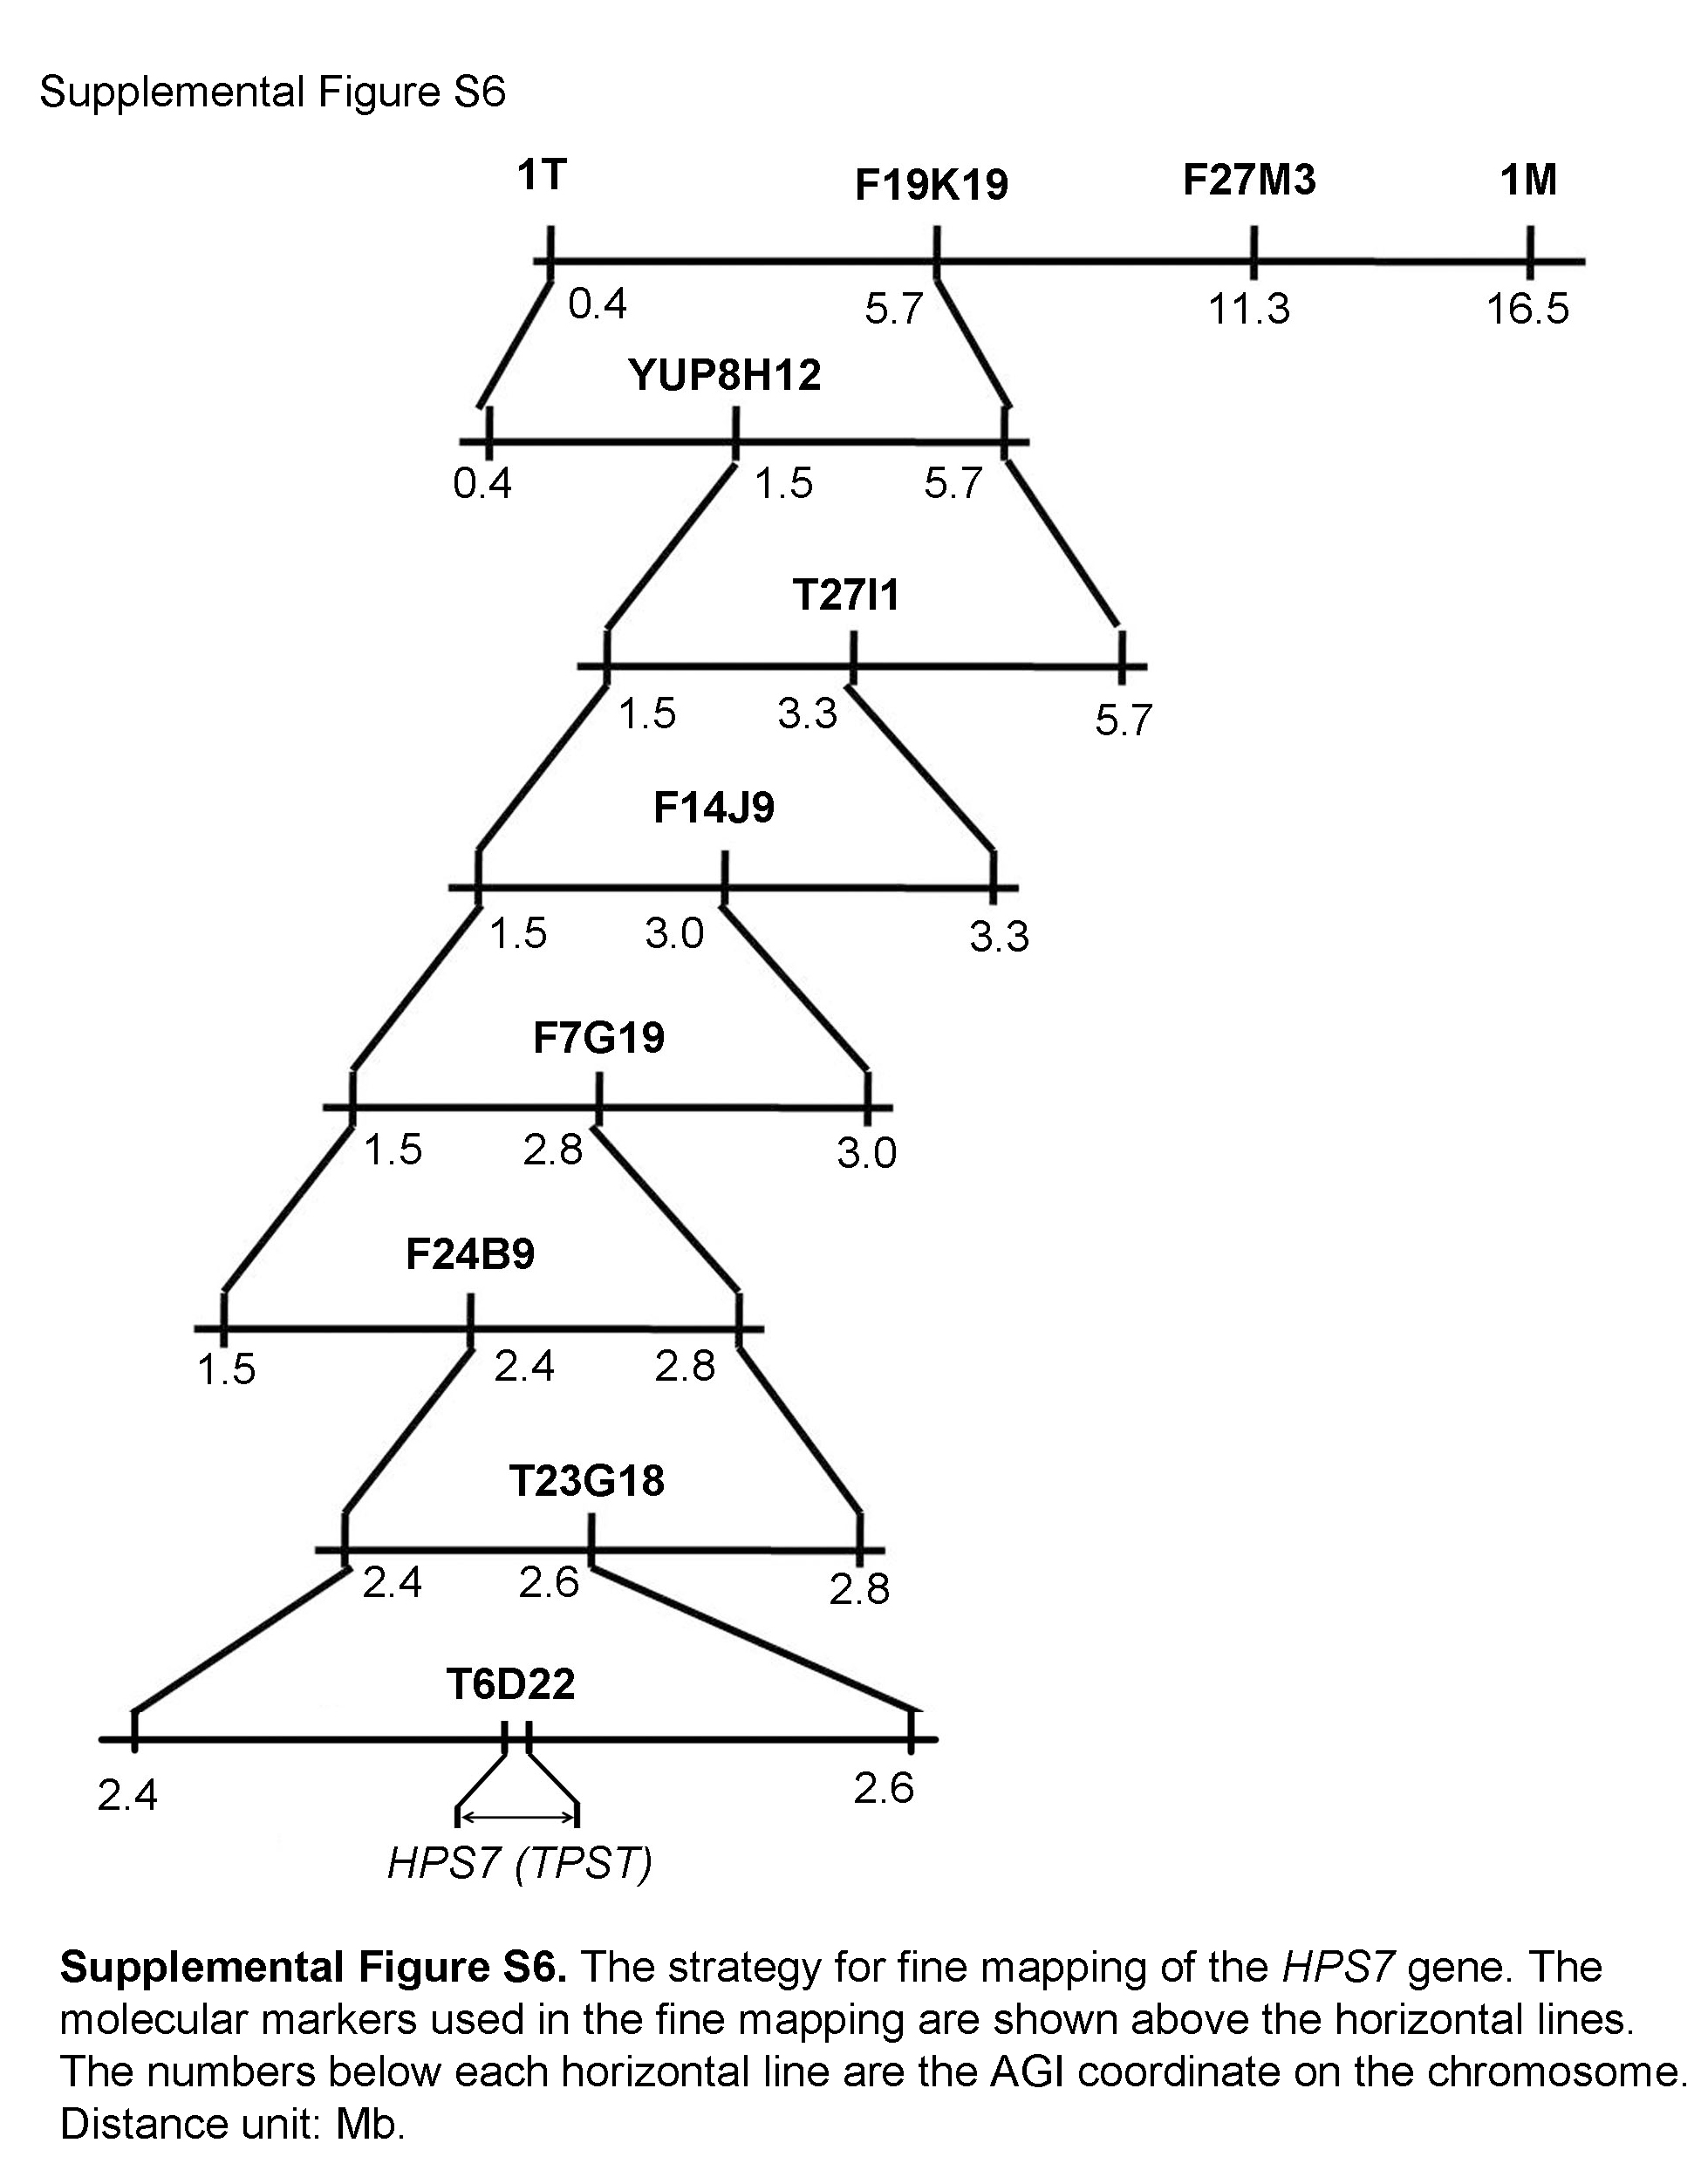
To identify the molecular lesion in hps7, we backcrossed hps7 to the wild type. All F1 plants showed wild-type phenotypes, and the F2 progeny derived from selfed F1 plants segregated into mutant and wild-type phenotypes in a ratio of 1:3 (46:147), indicating that hps7 mutant phenotypes were caused by a single recessive mutation. A positional cloning approach was used to map the HPS7 gene to a 150-kb region on chromosome 1 (Supplemental Fig. S6). After examining all the genes in this region, we considered AT1G08030, which encodes a TPST, as the potential candidate for HPS7 because our previous study had shown that the tpst mutants had a similar root phenotype as hps7 (Zhou et al., 2010). Therefore, we sequenced the TPST gene in hps7 and found a mutation of G to A in its 10th exon, which converted a Gly to an Asp at position 371 (Fig. 3A).
Figure 3.

Molecular identification of the HPS7 gene. A, A diagram showing the structure of the HPS7 gene and the positions of the transfer DNA insertions in three aqc-1 alleles and the point mutation in hps7. The black box, white box, and horizontal line represent the coding regions, untranslated regions, and introns, respectively. The positions of start (ATG) and stop (TGA) codons are shown. B, Morphologies of 8-d-old seedlings of the wild type (WT), three aqc1 alleles, hps7, and complementation line (35S:AQC) grown on P+ and P– media (top), and 5-bromo-4-chloro-3-indolyl phosphate staining of APase activity (shown in blue) on the root surface of the seedlings shown on top (bottom).
We previously showed that the loss-of-function mutation in TPST caused an active quiescent center1 (aqc1) phenotype that included the production of extra cells of the root quiescent center, decreased meristematic activity, and defective maintenance of the root stem cell niche. Together, these defects resulted in a stunted root growth (Zhou et al., 2010). Three tpst mutant alleles, aqc1-1, aqc1-2, and aqc1-3, and a complementation line, i.e. the aqc1-1 mutant transformed with a wild-type TPST gene under the control of the Cauliflower mosaic virus 35S promoter, were tested along with hps7 for their growth phenotypes. On both P+ and P– media, root growth of these three tpst alleles was similar to that of hps7, and root growth of the complementation line was similar to that of the wild type (Fig. 3B). Like hps7, the three tpst mutant alleles also exhibited enhanced APase activity on their root surface. This enhanced APase activity was restored to the level of the wild type in the complementation line (Fig. 3B). These results demonstrated that hps7 was a new mutant allele of the TPST gene. We therefore refer to HPS7 as TPST hereafter.
Accumulation of TPST Protein But Not mRNA Is Enhanced by Pi Deficiency
Previously, we showed that TPST mRNA is specifically expressed in the quiescent center and its surrounding cells (Zhou et al., 2010). To investigate whether the expression of the TPST gene was affected by Pi starvation, we isolated total RNAs from 5-d-old seedlings and performed a quantitative real-time PCR (qPCR) analysis. The results showed that the levels of TPST mRNA did not significantly differ between P– hps7 and P+ hps7 (Fig. 4A).
Figure 4.

Expression patterns of HPS7 mRNA and protein in P+ and P– wild-type roots. A, The relative expression level of HPS7 mRNA in the root tips of 5-d-old P+ and P– wild-type seedlings as determined by qPCR. The expression in the P+ wild type was set at 1.0. Values are means ± sd with three replicates. B, Western-blot analysis of HPS7 protein (GFP:TPST) levels in the root tips of 5-d-old P+ and P– seedlings. C, Confocal image analysis of HPS7 protein (GFP:TPST) accumulation in the root tips of 5-d-old P+ and P– wild-type seedlings.
To determine the effect of Pi deficiency on the accumulation of TPST proteins, we analyzed a transgenic line that harbored a TPSTpro:GFP:TPST construct in the wild-type background (Zhou et al., 2010). Total proteins extracted from the first 5-mm segment of the root tips of 5-d-old seedlings were subjected to western blot. The levels of TPST proteins were enhanced by Pi deficiency (Fig. 4B). The enhanced accumulation of TPST proteins under Pi deficiency was confirmed by confocal microscopy (Fig. 4C).
Accumulation of PLT1/PLT2 Proteins Is Enhanced by Pi Deficiency
PLT1 and PLT2 are two key transcription factors required for specification and maintenance of the stem cell niche in the root meristem (Aida et al., 2004). We previously showed that TPST acts upstream of PLT1/PLT2 to maintain the root stem cell niche (Zhou et al., 2010). Using the transgenic lines carrying a PLT1pro:PLT1:Yellow Fluorescent Protein (YFP) or PL2pro:PLT2:YFP construct in wild-type background (Zhou et al., 2010), we examined the effects of Pi deficiency on the accumulation of PLT1/PLT2 proteins. The root apex of 5-d-old seedlings of these two lines was subjected to confocal microscopy. The yellow fluorescence signals representing the PLT1 or PLT2 proteins were greatly enhanced under the P– condition (Fig. 5A). We then examined the effect of TPST mutation on the protein levels of PLT1/PLT2 under Pi deficiency. For this purpose, transgenic lines harboring the PLT1pro:PLT1:YFP or PL2pro:PLT2:YFP construct in the acq1-1 background were used for western blot. As reported previously (Zhou et al., 2010), the accumulation of PLT1:YFP and PLT2:YFP proteins was greatly reduced in aqc1-1 background under the normal growth condition (Fig. 5B). The mutation of TPST, however, did not impair the induction of PLT1/PLT2 by Pi deficiency.
Figure 5.

Effect of hps7 mutation and Pi deficiency on accumulation of PLT1/PLT2 proteins. A, Confocal images of the expression of PLT1/PLT2:YFP fusion proteins in 5-d-old seedlings. B, Western-blot analysis using anti-GFP antibodies of expression of PLT1/PLT2:YFP fusion proteins in 5-d-old seedlings.
RNA-seq Analyses of the Root Tip Transcriptomes
To elucidate the molecular mechanism by which the TPST mutation affects plant responses to Pi deficiency, we performed a comparative RNA sequencing (RNA-seq) analysis of the root tip transcriptomes. Complementary DNA libraries were constructed using the total RNAs isolated from the root tips of 3-d-old seedlings growing on P+ or P– medium. The reason that we used the root tips of 3-d-old seedlings was to investigate the change of gene expression profile before the exaggerated root phenotype of P– hps7 became evident at 5 DAG (Fig. 2B). For each combination of genotype or Pi treatment, two biological replicates were used. Using an Illumina HiSeq2000 sequencer, we generated a total of 347,865,577 EST reads from the eight complementary DNA libraries. After filtering low-quality reads and removing reads that aligned to ribosomal RNA or transfer RNA, we selected 279,263,207 reads for further analysis (Supplemental Table S1). The raw data of Illumina reads are available at the National Center for Biotechnology Information Sequence Read Archive browser (http://ncbi.nlm.nih.gov/sra; accession no. SRP040597). For each sample, approximately 93% of reads could be mapped to The Arabidopsis Information Resource (TAIR) reference genome TAIR10; of these mapped reads, approximately 92% were aligned with unique genes without ambiguity. The gross comparisons of the RNA expression profiles against P+ wild-type seedlings are shown in Figure 6, A to C. The difference of expression level between two samples (fold change) is expressed as log2-transformed ratio. The log2 value of at least 1 was used as a cutoff to select differentially expressed transcripts.
Figure 6.

RNA-seq analyses of differentially expressed transcripts in the root tips of 3-d-old wild-type (WT) and hps7 seedlings grown on P+ and P– media. A and B, Diagrams showing the number of genes up- or down-regulated by Pi deficiency and hps7 mutation. C to F, Heat maps for cluster analysis of the differentially expressed transcripts. Yellow indicates up-regulated genes. Cyan indicates down-regulated genes. C, Cluster display of all differentially expressed transcripts. D to F, Cluster display of differentially expressed transcription factors (D), cell wall proteins (E), and photosynthetic proteins (F). All comparisons were made relative to the gene expression level of the wild type grown on P+ medium.
We first compared the transcriptomes of the root tips of wild-type seedlings grown under P+ and P– conditions. In the P– wild-type seedlings, the expression was induced for 110 genes and was repressed for 418 genes (Fig. 6, A and B; Supplemental Table S2). The induced genes included five Pi starvation-induced marker genes (At4, AtIPS, Pht1;4, ACP5, and RNS1) that had been analyzed by qPCR during the characterization of hps7 (Supplemental Fig. S4). The fold change in the induction of these five Pi starvation-induced genes was 3.7, 10.4, 1.3, 3.2, and 2.1, respectively (Supplemental Table S2). Although the fold changes of induction of these five Pi starvation-induced genes in the RNA-seq experiment were not exactly the same as those observed in qPCR (Supplemental Fig. S3), the trends of expression in these two experiments were similar. The discrepancy in the level of induction between the qPCR and RNA-seq analysis was probably due to differences in the type and age of the plant materials used. The induction of these five Pi starvation-induced genes in P– root tips indicated that the experimental conditions for RNA-seq analysis were appropriate. Many other known Pi starvation-induced genes (Wu et al., 2003; Misson et al., 2005; Morcuende et al., 2007) were also found among the genes induced in the P– wild type (Supplemental Table S2). These Pi starvation-induced genes included the following: the Pi-signaling components SPX1, SPX2, and PHO1; the Pi transporters PHT1;2 and PHT1;9; a protein that facilitates Pi transporter traffic, PHF1; and the enzymes involved in biosynthesis of sulfolipids, SQD1, SQD2, and MGD3. The induction of the genes encoding ferric reduction oxidase FRO4 and FRO5, the sulfate transporter SULTR2;1, sulfite exporter (AT4G21250), a low sulfur-responsive protein LSU2, copper transporter COPT1, and aluminum-activated malate transporter ALMT1 indicated a cross-talk among different nutrients for their uptake and metabolism. Increased expression of the genes that encode the enzymes IPMI1, IPMI2, IMS2, IMD1, BCAT4, MAM1, and MGL suggested an enhanced biosynthesis of glucosinolates and branch-chained amino acids (Binder, 2010; Sønderby et al., 2010).
Among the down-regulated genes in the P– wild-type seedlings, the genes of three functional groups were particularly enriched. One group contained transcription factors. Among the 177 transcription factors whose expression was altered under Pi deficiency, 129 were down-regulated (Fig. 6D; Supplemental Table S3). The second group contained cell wall proteins that included 10 arabinogalactan proteins, seven expansins, seven xyloglucan endotransglucosylase/hydrolases, and several others (Fig. 6E; Supplemental Table S4). The third group contained photosynthesis-related genes, including six genes encoding chlorophyll-binding proteins, 18 genes encoding subunits of PSI, 19 genes encoding subunits of PSII, and five genes encoding enzymes involved in the Calvin cycle (Fig. 6F; Supplemental Table S5). No photosynthetic genes were found to be up-regulated in the wild type under Pi deficiency.
We then compared the transcriptome in P+ hps7 relative to the P+ wild type. In P+ hps7, expression was induced for 1,144 genes and was repressed for 425 genes (Fig. 6, A and B; Supplemental Table S6). Among transcription factor-encoding genes, 137 were up-regulated and 177 were down-regulated (Fig. 5D; Supplemental Table S3). CPC and GL2 are transcription factors that negatively regulate root hair formation (Schiefelbein et al., 2009). The down-regulation of these transcription factors in hps7 was consistent with its enhanced root hair formation. The transcription factors SHR (Helariutta et al., 2000), WOX4 (Ji et al., 2010), and WOX7 (Hirakawa et al., 2010) are involved in the maintenance of the stem cell niche. The altered expression of these transcription factors might account for the defective maintenance of the root stem cell niche. CLE41 and CLE44 are two CLAVATA3-like peptides that are also involved in regulating the root stem cell niche (Strabala et al., 2006). The expression of these two peptides was up-regulated in hps7, which was consistent with the overexpression of CLE41 and CLE44 causing arrest of root growth (Strabala et al., 2006). The induced genes also included ACC synthase (ACS6 and ACS9) and ACC oxidase (ACO1, ACO2, and ACO4), suggesting that ethylene biosynthesis is enhanced in hps7 (Bleecker and Kende, 2000). In addition, the expression of two groups of auxin-inducible genes (12 genes of the auxin-responsive protein family and three genes of the GH3 family, GH3.3, GH3.5, and GH3.6) was greatly enhanced.
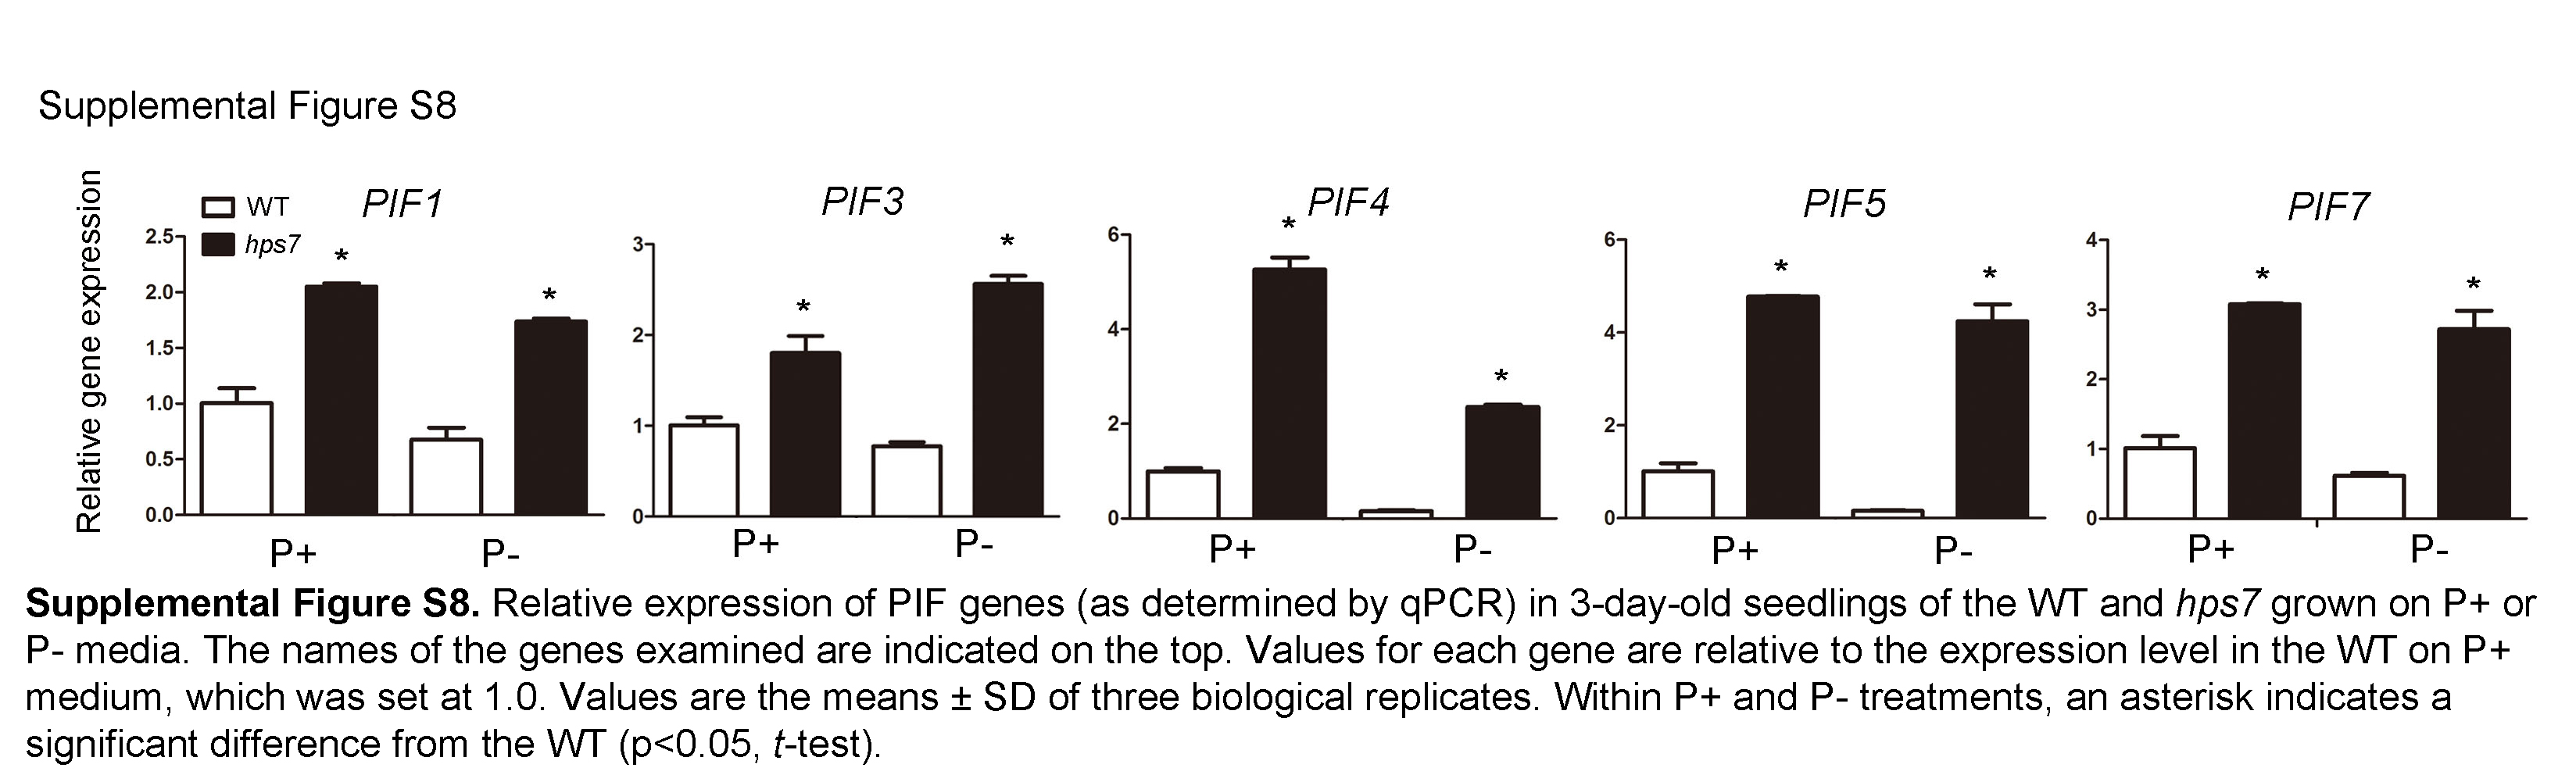
In contrast to that in the P– wild type, the expression of 118 photosynthetic genes was up-regulated in P+ hps7 relative to the P+ wild type, including the genes encoding subunits of PSI and PSII, chlorophyll-binding proteins, and enzymes involved in chlorophyll biosynthesis and the Calvin cycle (Supplemental Table S5). The expression of only five photosynthetic genes was down-regulated. Five phytochrome-interacting factors, PIF1, PIF3, PIF4, PIF5, and PIF7 (Leivar and Quail, 2011), were up-regulated (Supplemental Tables S5 and S6). In hps7, the expression of the same cell wall proteins observed in P– wild-type seedlings was down-regulated, but a new set of 33 cell wall proteins was up-regulated (Fig. 6E; Supplemental Table S4).
Finally, we compared the transcriptomes of hps7 grown on P+ and P– medium to determine the effects of Pi deficiency on the gene expression profiles in hps7. Compared with P+ hps7 seedlings, expression of 274 genes in P– hps7 seedlings was up-regulated and that of 26 genes was down-regulated (Fig. 6, A and B; Supplemental Table S7). Again, the genes belonging to the categories of photosynthetic proteins, transcription factors, and cell wall proteins were the most enriched. Expression of 37 photosynthetic genes was higher in P– hps7 than in P+ hps7 (Fig. 6F; Supplemental Table S8). Among the transcription factors, expression of 19 genes was increased and that of five genes was decreased in P– hps7 relative to P+ hps7 (Supplemental Table S9). The largest increase in induction (a 10.5-fold increase) among transcription factors in P– hps7 was for cryptochrome-interacting basic-helix-loop-helix. Cryptochrome-interacting basic-helix-loop-helix interacts with CRY2, a blue light receptor, to promote floral initiation (Liu et al., 2008), but its role in regulating photosynthetic gene expression is not yet clear. No further increase in expression was found for any of the PIF genes. For cell wall proteins, expression was further increased for eight genes and was decreased for two genes in P– hps7 relative to P+ hps7 (Fig. 6E; Supplemental Table S4). The altered expression of cell wall proteins may account for the large increase of volume of root meristem cells of P– hps7.
Verification of Enhanced mRNA and Protein Accumulation of Photosynthetic Genes in hps7
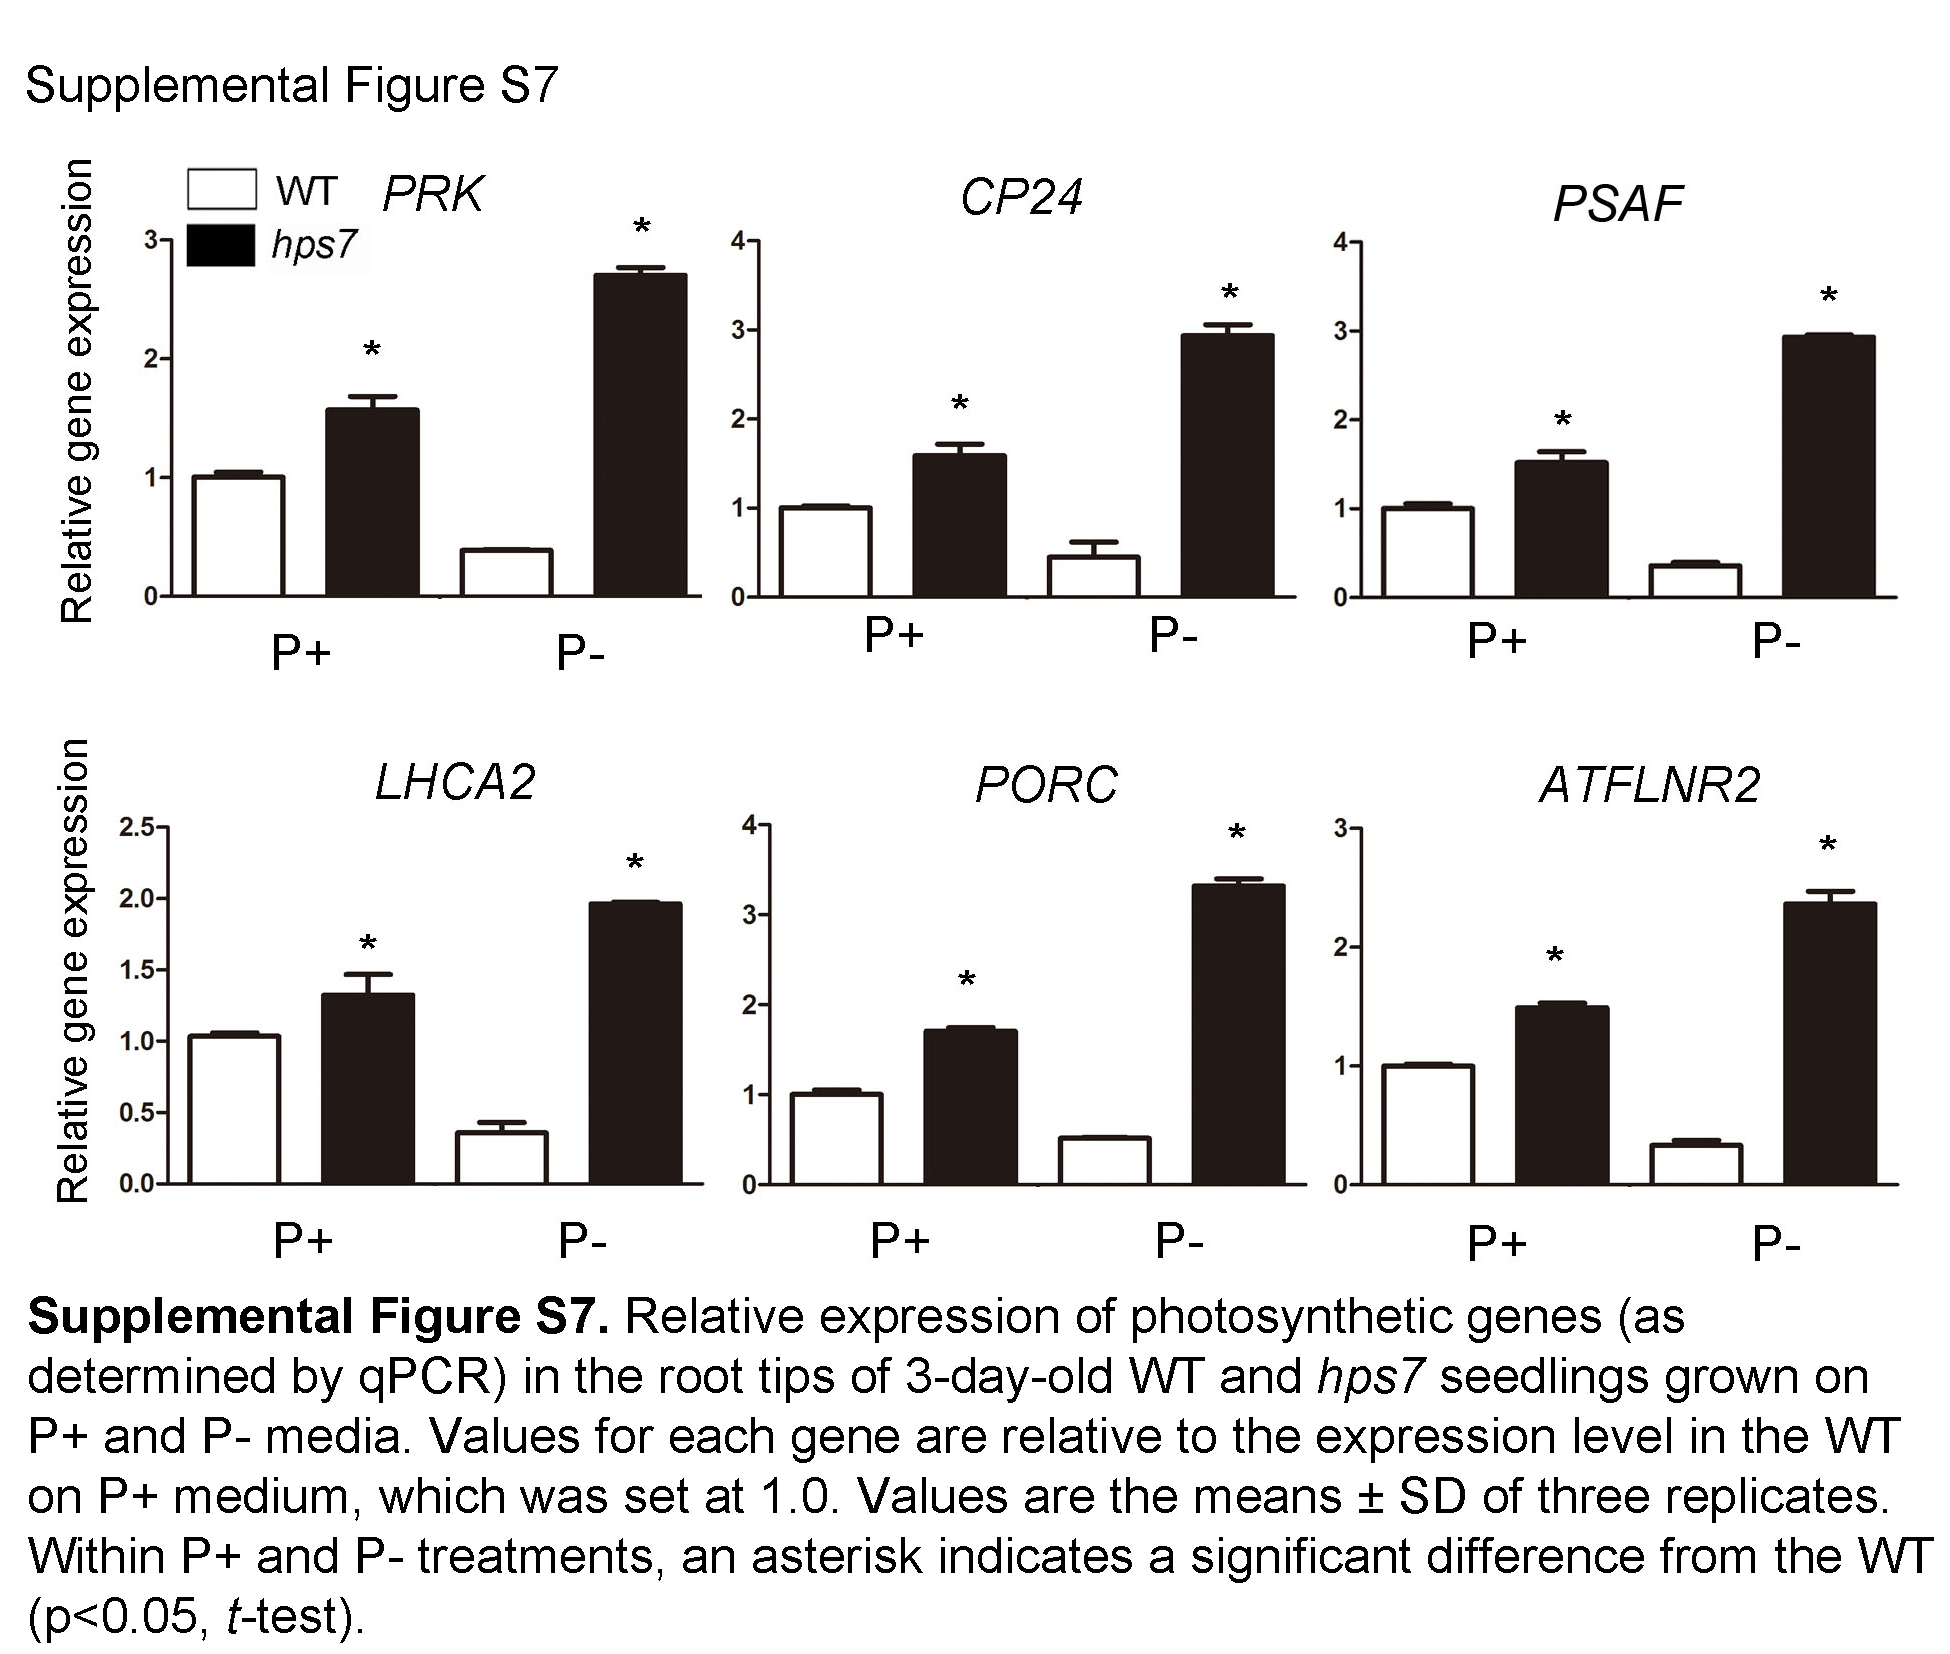
To verify the mRNA expression of the photosynthetic genes in roots, we performed qPCR using the RNAs extracted from the root tips of the 3-d-old seedlings. Six photosynthetic genes were analyzed for their expression in the wild type and hps7 grown under different Pi conditions. These six genes encode PORC (AT1G03630), an enzyme that converts protochlorophyllide to chlorophyllide, LHCA2 (AT3G61470), a chlorophyll-binding protein, PSAF (AT1G31330), a subunit of PSI, CP24 (AT1G15820), a subunit of PSII, PRK (AT1G32060), a phosphoribulokinase, and ATFLNR2 (AT1G20020), a ferredoxin:NADP(H) oxidoreductase. The expression of these six genes was repressed in the P– wild-type seedlings (Supplemental Fig. S7). By contrast, their expression in hps7 was up-regulated on P+ medium and was up-regulated even more on P– medium. The enhanced expression of five PIF genes in hps7 was also validated by qPCR (Supplemental Fig. S8).
Next, we examined the levels of five photosynthetic proteins in the wild type and hps7. Total proteins extracted from roots and shoots of 5-d-old seedlings were subjected to western blot. The proteins analyzed included PRK, PSAG (AT1G55670), a subunit of PSI, and CP47 (ATCG00680) and D1 (ATCG00020), two subunits of PSII. In the roots, only PRK and CP47 were detected by western blot (Fig. 7A). The levels of PRK were increased in both the P– wild type and P– hps7 and were higher in P– hps7 than in the P– wild type. hps7 accumulated more CP47 than the wild type under both P+ and P– conditions. The levels of CP47 were also higher in P– hps7 than in P+ hps7. In the shoots, expression of three proteins was detected (Fig. 7B). PRK and PSAG levels were higher in hps7 than in the wild type under both P+ and P– conditions. The D1 level was similar among the P+ wild type, the P– wild type, and P+ hps7 but significantly increased in P– hps7.
Figure 7.

Western-blot analysis of photosynthetic proteins in wild-type (WT) and hps7 seedlings grown on P+ and P– media. Total proteins extracted from roots (A) and shoots (B) of 5-d-old seedlings were subjected to western-blot analysis. The names of the proteins probed by specific antibodies are indicated on the left.
hps7 Has Enhanced Photosynthesis-Related Phenotypes under Pi Deficiency
To determine whether the increased expression of photosynthetic genes resulted in the photosynthesis-related phenotypes, we first analyzed the chlorophyll contents in the roots. At 4 and 5 DAG, the patterns of chlorophyll autofluorescence of the wild type were similar, i.e. the signal intensity was lower under Pi deficiency than under Pi sufficiency and florescence was restricted to stele (Fig. 8, A and B). At 4 DAG, the signal intensity was greater in hps7 than in the wild type under both Pi conditions. At 5 DAG in P– hps7, the signal intensity was extremely high and the florescence had extended to the outer layers of the roots (Fig. 8B).
Figure 8.

Chlorophyll accumulation in the roots of wild-type (WT) and hps7 seedlings grown on P+ and P– media. Primary roots excised from 4-d-old seedlings (A) and 5-d-old seedlings (B) were photographed by confocal laser microscopy. In each panel, the top row shows chlorophyll autofluorescence (red) and the bottom row shows the bright field images. C, Relative intensity of fluorescence in the roots of 4- and 5-d-old wild-type and hps7 seedlings grown in P+ and P– conditions. Values are means ± sd (n = 15) with three replicates. Asterisks indicate a significant difference from the wild type (P < 0.05, Student’s t test).
Next, we examined plastid development in roots of the wild type and hps7 using transmission electron microscopy. While the number of plastids per cell did not statistically differ among the four combinations of genotype and medium (Fig. 9A), plastid morphology was quite different for P– hps7 than for P+ hps7 or for the wild type regardless of the medium (Fig. 9B). At 4 DAG for the P+ wild type, the P– wild type, and P+ hps7, the plastids contained a few well-developed thylakoids but usually lacked starch granules. The plastids of P– hps7, however, frequently contained starch granules. About 75% of the plastids in P– hps7 contained three to five starch granules, while only about 10% of plastids in the plastids of the P+ wild type, the P– wild type, and P+ hps7 contained starch granules. In addition, P– hps7 seedlings accumulated more Suc than the P– wild type (Fig. 9C). These results suggested that photosynthesis might occur in P– hps7 roots even though the roots were not visibly green.
Figure 9.

Root plastid and Suc contents of wild-type (WT) and hps7 seedlings grown on P+ and P– media. Root samples at 4 DAG were analyzed by transmission electron microscopy. Number of plastids (A) and transmission electron microscopy micrographs of plastids (B) in the outer cells of the stele of primary root cells. In A, values are means of 30 cells ± sd. Bars = 500 nm. C, Suc contents in 8-d-old whole seedlings of the wild type and hps7. Values are means ± sd. The experiments were repeated three times. The asterisk indicates a significant difference from the wild type (P < 0.05, Student’s t test).
The elevated photosynthetic activity could result in an increased production of reactive oxygen species (ROS), leading to photooxidative damage (Li et al., 2009). The dye nitroblue tetrazolium (NBT) stains superoxide. The NBT staining indicated that more superoxide accumulated in the meristem of hps7 roots than of wild-type roots, especially under Pi deficiency (Fig. 10A). 2′,7′-Dichlorodihydrofluorescein diacetate (H2DCFDA) was used to detect hydrogen peroxide (H2O2), and H2DCFDA staining indicated that H2O2 mainly accumulated at the edge of root meristem in the P+ wild type, the P– wild type, and P+ hps7 and at similar levels in these three combinations; in P– hps7, however, high levels of H2O2 accumulated in the intercellular space of the entire meristematic region (Fig. 10B). The high accumulation of H2O2 in P– hps7 was further confirmed by quantitative analysis (Fig. 10C).
Figure 10.

Accumulation of ROS in the roots of wild-type (WT) and hps7 seedlings grown on P+ and P– media. Root tips of 5-d-old seedlings stained with NBT (A) and H2DCFDA (B). The top rows contain confocal images showing the fluorescence signals (green) of ROS, and the bottom rows contain bright field images. C, Relative H2O2 contents in roots of 5-d-old seedlings. Values are means ± sd. The experiments were repeated three times. The asterisk indicates a significant difference from the wild type (P < 0.05, Student’s t test).
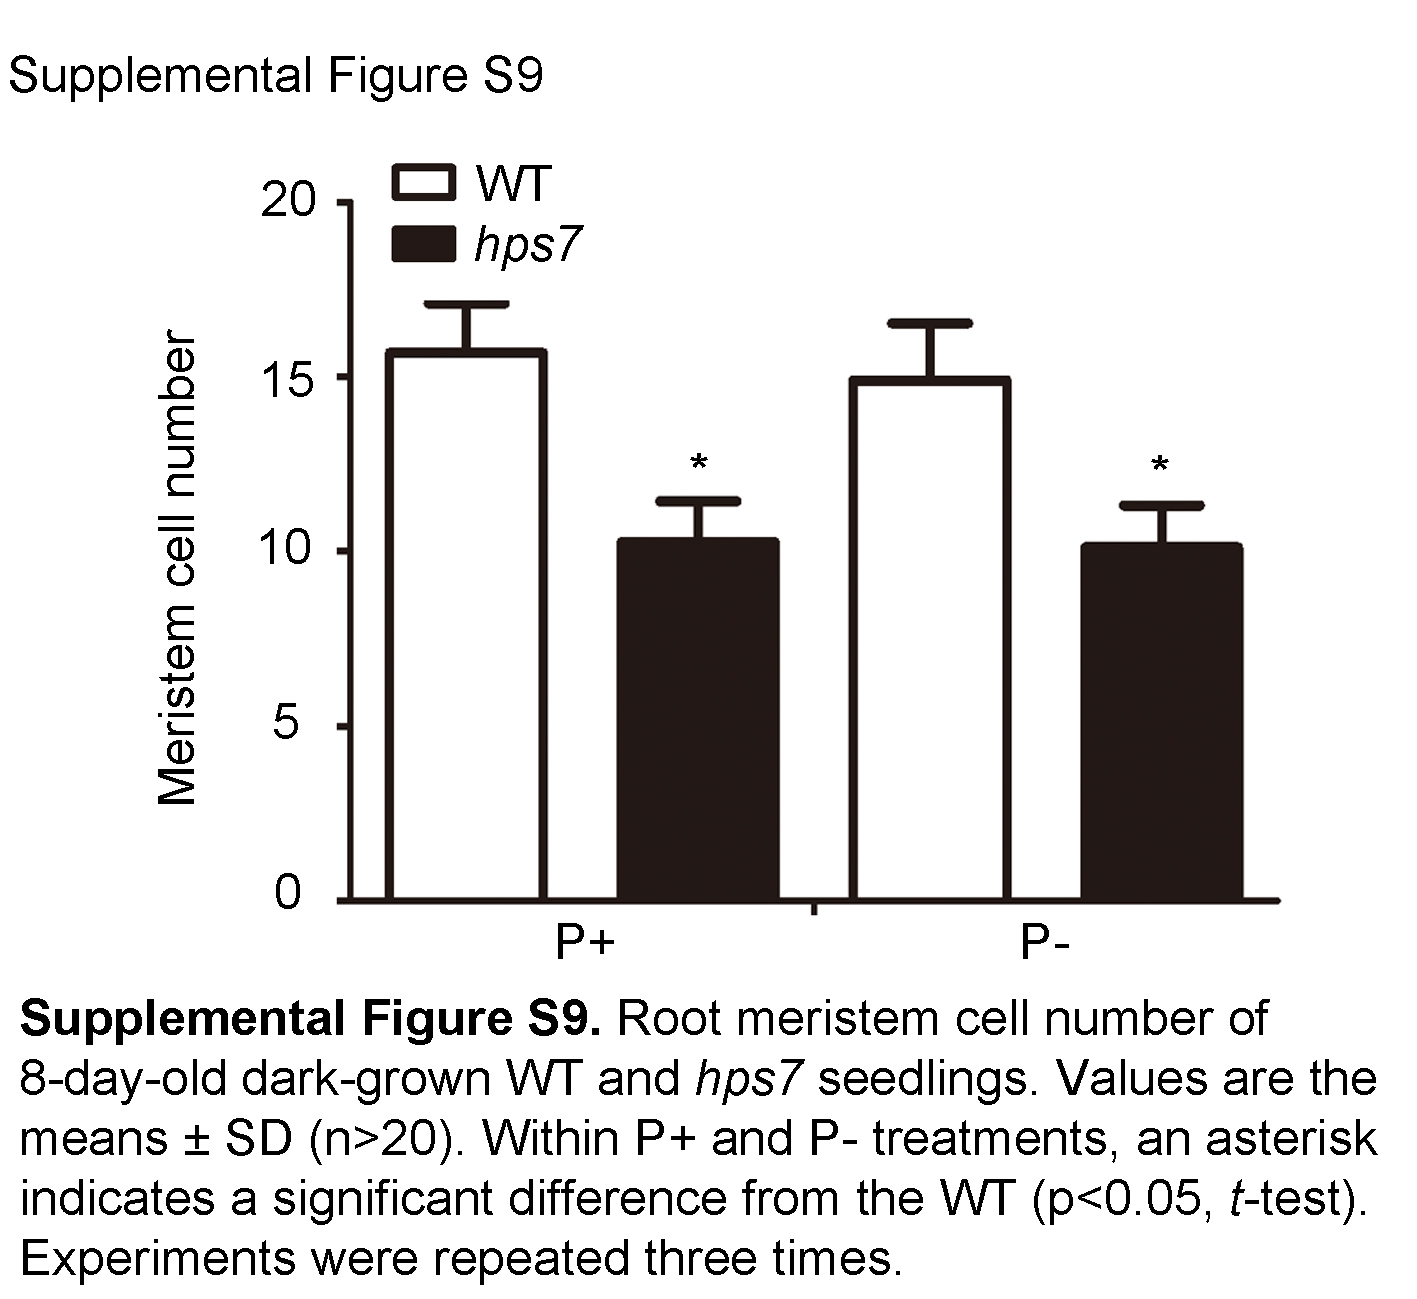
We speculated that the high accumulation of ROS might be responsible for the exaggerated defects in root development in P– hps7. If this hypothesis is correct, then the root phenotypes of P– hps7 would be suppressed when hps7 is grown in the dark. The root morphologies were similar for 8-d-old dark-grown P– hps7 seedlings versus dark-grown P+ hps7 seedlings (Fig. 11A); the P+ hps7 and P– hps7 seedlings were similar in terms of hypocotyl length (Fig. 11B), primary root length (Fig. 11C), and cellular organization of the meristem (Fig. 11D; Supplemental Fig. S9).
Figure 11.

Morphologies of 8-d-old dark-grown wild-type (WT) and hps7 seedlings under P+ and P– conditions. A, Whole seedlings. B, Hypocotyl length. C, Primary root length. D, Structure of the meristem of the primary root. White lines indicate the boundary between the root meristematic and elongation zones. In B and C, values are means ± sd of 20 seedlings. The experiments were repeated three times. Asterisks indicate a significant difference from the wild type (P < 0.05, Student’s t test).
GLK OX Lines Show Enhanced Inhibition of Root Growth in Response to Pi Deficiency
Researchers previously reported that the overexpression of the transcription factors GOLDEN1-like (GLK1) or GLK2 activates photosynthetic gene expression in roots in Arabidopsis lines (Waters et al., 2009). In both GLK overexpressing (OX) lines, the thylakoid membrane network develops in root plastids, and photosynthesis is activated in the roots (Kobayashi et al., 2013). We grew the two GLK OX lines on P+ and P– medium. At 8 DAG on P+ medium, the seedling morphologies of two GLK OX lines did not differ from that of the wild type (Fig. 12A); on P– medium, however, the shoots were smaller and primary roots were shorter for the GLK OX lines than for the wild type (Fig. 12B; Supplemental Fig. S10A). As was the case with hps7, when the GLK OX lines were grown in the dark, their root morphologies were similar to that of the wild type (Fig. 12C; Supplemental Fig. S10B).
Figure 12.

Growth characteristics of 8-d-old seedlings of the wild-type (WT) and GLK OX lines grown on P+ and P– medium. A and B, Morphology of the wild type, GLK1 OX, and GLK2 OX grown on P+ and P– medium under a normal photoperiod. C, Morphology of the wild type, GLK1 OX, and GLK2 OX grown on P– medium in the dark.
DISCUSSION
Plants have evolved the ability to adapt to Pi deficiency by displaying an array of biochemical, physiological, and developmental responses. These adaptive responses help plants acquire and utilize Pi under limiting conditions. One profound developmental response is the remodeling of RSA to increase root surface area for Pi uptake. Pi deficiency also triggers the reprogramming of plant metabolism, including the inhibition of photosynthesis. Active photosynthesis uses a large amount of Pi to produce ATP for carbon fixation. Therefore, a decrease in photosynthesis under Pi deficiency is believed to be an adaptive strategy that conserves the use of Pi. Interestingly, some previous works (Wu et al., 2003; Li et al., 2010) and this study showed that expression of photosynthetic genes was also suppressed in the P– roots. Because root cells are thought to be photosynthetically inactive, the biological relevance of the suppression of photosynthetic gene expression in roots under Pi deficiency has not been explored.
In this work, we identified an Arabidopsis mutant, hps7, that is hypersensitive in multiple responses to Pi deficiency. The hypersensitive responses include accelerated remodelling of RSA, increased expression of Pi starvation-induced genes, enhanced induction of APase activity, and overproduction of starch and anthocyanin (Fig. 1; Supplemental Figs. S1–S4). These results indicated that the mutation had a global impact on plant responses to Pi deficiency. We previously demonstrated that Suc is a global regulator for plant responses to Pi deficiency (Lei et al., 2011). Enhanced accumulation of Suc (Fig. 9C) in hps7 is consistent with its multiple hypersensitive phenotypes (Fig. 1; Supplemental Fig. S1–S5).
We are particularly interested in why the hps7 mutant exhibited the exaggerated root phenotype under Pi deficiency. hps7 carries a point mutation in the TPST. Our comparative RNA-seq analysis of the root transcriptomes showed that under normal growth condition, the mutation of the TPST gene caused many transcription factors to be up-regulated or down-regulated. Some of these transcription factors have been shown to be directly involved in the maintenance of stem cell niche and root hair development. The altered expression of these transcription factors, therefore, is consistent with the observed defects in hps7 root development. Furthermore, we found that mRNA levels of five genes involved in ethylene biosynthesis were greatly elevated. Ethylene influences root growth by affecting auxin biosynthesis and polar transport (Růzicka et al., 2007). We found that the expression of many auxin-responsive proteins was highly induced. Based on these results, we hypothesize that the mutation in TPST first increases ethylene biosynthesis, which, in turn, enhances auxin signaling. Enhanced auxin signaling then causes the enhanced expression of stem cell transcription factor PLTs, which further affects the expression of a large number of transcription factors. Relative to the wild type, the expression of 214 transcription factors (i.e. 20% of all transcription factors in the Arabidopsis genome) was altered in the roots of hps7. Such massive changes in the expression profiles of transcription factors may greatly change the transcriptional network that controls root growth.
The dramatic changes in the expression of many photosynthesis-related genes (118 were up-regulated and five were down-regulated) in hps7 seems especially significant. The coordinated induction of photosynthetic gene expression in hps7 suggests an activation of positive regulators or a suppression of negative regulators for these genes. What drew our attention was the increased expression of a group of proteins called PIFs. PIFs are a small subset of basic helix-loop-helix transcription factors (Leivar and Quail, 2011). They repress seed germination, promote seedling skotomorphogenesis, and control biosynthesis of chlorophyll and anthocyanin by regulating the expression of over 1,000 genes. Under our experimental conditions (16-h light/8-h dark), these PIFs seemed to act as positive regulators of photosynthetic gene expression. Notably, the expression of three genes (PORA, PORB, and PORC) encoding the rate-limiting enzyme for chlorophyll biosynthesis, protochlorophyllide oxidoreductase, was greatly increased in hps7 (Supplemental Table S6). This might account for the higher accumulation of chlorophyll in hps7 than in the wild type.
When comparing the transcriptomes of hps7 roots grown on P+ and P– media, we found that expression of 37 photosynthetic genes was further increased under Pi deficiency (Supplemental Table S5). This was also reflected at the protein levels (Fig. 7). Accordingly, we found an extremely high accumulation of chlorophyll in the roots of P– hps7 (Fig. 8). In addition, the majority of the plastids in P– hps7 roots contained three to four starch granules, whereas most plastids in P+ hps7 or the wild-type roots (both P+ and P–) lacked starch granules (Fig. 9). These results suggest that photosynthesis might occur in P– hps7. Elevated or aberrant photosynthetic activity can lead to the excess production of ROS (Li et al., 2009). We found that hps7 grown under Pi deficiency accumulated significantly increased amounts of ROS. Excess ROS can damage cell membranes and interfere with many cellular processes, including cell signaling and metabolism. Thus, it is likely that the exaggerated root phenotype of P– hps7 is caused by ectopically activated photosynthesis, which leads to increased production of ROS in the root cells. In support of this notion, the roots of dark-grown P– hps7 were morphologically identical to those of P+ hps7 (Fig. 11). A similar phenomenonwas observed for Arabidopsis GLK OX lines in whose roots photosynthesis is activated (Waters et al., 2009; Kobayashi et al., 2013). When these lines grew under normal conditions, their root growth did not differ from that of the wild type (Fig. 12). Inhibition of root growth by Pi deficiency, however, was more enhanced in the GLK OX lines than in the wild type, and this morphological difference was eliminated by growing the plants in the dark.
This raises the question of why the exaggerated defects of hps7 root growth occur only under Pi deficiency. Our results show that although the mutation of TPST triggered (induced or derepressed) the expression of many photosynthetic genes, significant increase of ROS production only occurred under Pi deficiency. The enhanced photosynthesis requires a large amount of Pi to produce ATP for carbon fixation. The Pi deficiency of the growth medium might force the photosynthetic apparatus to produce high amounts of ROS instead of generation of ATP. The high accumulation of ROS at the root tips thus causes severe damage on root meristem cells, which ultimately results in inhibition of primary root growth.
Arabidopsis contains a single TPST gene, but TPST orthologs exist in many plant species. The targets of TPST were recently identified as a group of Tyr-sulfated peptides called root growth factors (RGFs; Matsuzaki et al., 2010). Exogenous application of RGFs can restore the defects of the stem cell niche of the tpst-1 mutant. RGFs maintain the root stem cell niche by affecting the expression of stem cell transcription factor PLTs (Matsuzaki et al., 2010; Zhou et al., 2010). We speculate that the knockout of TPST may also cause defects in sulfation of some master regulators for photosynthetic gene expression. This defect derepresses the expression of photosynthetic genes in roots. Currently, however, it is not known what the target proteins of TPST are in the context of regulation of photosynthetic gene expression. The next challenge will be to identify the direct targets of TPST that serve as the master switches in the regulation of photosynthetic gene expression in roots.
In summary, through molecular and genetic studies combined with RNA-seq analysis, we discovered a new adaptive strategy that plants use to sustain their root growth under Pi deficiency. Inhibition of photosynthesis in plants is well known to be an adaptive response that conserves Pi. The biological relevance of the suppression of photosynthetic gene expression in roots, however, has long been overlooked. To our knowledge, this work is the first to reveal that suppression of photosynthesis in roots is an active cellular process that enables plants to sustain their root growth under Pi deficiency.
MATERIALS AND METHODS
Plant Materials and Growth Media
All plants used in this study were of Columbia ecotype background. The P+ medium was one-half-strength Murashige and Skoog medium with 1% (w/v) Suc and 1.1% (w/v) agar (Sigma catalog no. A1296). The P– medium was made by replacing 0.625 mm KH2PO4 in the P+ medium with 0.625 mm K2SO4. Seeds were surface sterilized with 20% (v/v) bleach for 15 min. After four washes in sterile-distilled water, seeds were sown on petri plates containing P+ or P– medium. After the seeds were stratified at 4°C for 2 d, the agar plates were placed vertically in a growth room with a 16-h-light/8h-dark photoperiod at 22°C to 24°C. The light intensity was 100 μmol m–2 s–1.
Mutant Isolation
About 100,000 ethyl methanesulfonate-mutagenized M2 seeds representing about 6,000 M1 plant lines were used for mutant screening. The roots of seedlings that had grown on P– medium for 7 d were visually examined. The seedlings with extremely short roots were identified as putative mutants and were transferred to soil. The plants were self-pollinated, and the mutant phenotypes were confirmed in the next generation. The mutants were backcrossed to the wild-type plants three times before further characterization.
Quantitative Analyses of Anthocyanin, Cellular Pi, and Total P
Anthocyanin, cellular Pi, and total P were quantified as described by Wang et al. (2011).
Quantitative Analysis of APase Activity
Intracellular and root surface-associated APase activities were quantified as described by Wang et al. (2011).
qPCR Analysis
Total RNAs were extracted from the seedlings with the Tiangen RNAprep pure plant kit with on-column DNase I digestion. qPCR analysis was carried out on the Applied Biosystems 7500 real-time PCR detection system as described by Yu et al. (2012). The primers used for detection of the mRNA expression are listed in Supplemental Table S10.
Genetic Mapping of the HPS7 Gene
The mapping population was generated by crossing the mutant hps7 to a plant of the Landsberg erecta ecotype. The F2 progeny that displayed the short root phenotype were selected, and DNAs from these seedlings were isolated for molecular mapping. A set of simple sequence length polymorphism and cleaved-amplified polymorphic sequence markers was used to map the HPS7 gene. The sequences and chromosomal positions of the molecular markers are listed in Supplemental Table S11.
Western-Blot Analysis
Western-blot analysis of GFP:TPST proteins in the roots of the wild-type and hps7 seedlings was performed as described in Zhou et al., 2010. The polyclonal antibodies against five photosynthetic genes were purchased from Agrisera. The western-blot analyses of these five proteins were performed according to the manufacturer’s instructions.
Transmission Electron Microscopy of Root Plastids
The roots of 5-d-old seedlings of the wild type and hps7 were fixed in 2.5% (v/v) glutaraldehyde for more than 2 h. After three washes with phosphate buffer (10 min for each wash), the roots were treated with 3.1% (v/v) osmium tetroxide for 1 h. The roots were then rinsed with phosphate buffer three times (10 min for each rinse). The samples were further dehydrated with a graded ethanol series (50%, 70%, 80%, 90%, and 100% [v/v], each for 10 min). Subsequently, 100% ethanol was replaced by 100% (v/v) alcohol:acetone (1:1) for 10 min and then by 100% acetone for 10 min. The dehydrated samples were embedded in graded resins (1:1, 1:2, 1:3, and pure). The embedded samples in pure resin were hardened at 45°C for 12 h and at 60°C for 24 h. Ultrathin sections (70 nm) were made. The sections were stained with 2% (v/v) uranyl acetate for 20 min and lead citrate for 10 min. The stained sections were analyzed with a transmission electron microscope (H-7650B; Hitachi).
Quantification of Suc Content
Soluble sugar was extracted twice from shoots and roots of the seedlings in 80% (v/v) methanol at room temperature. The extracted were centrifuged at 12,000 rpm for 10 min, and the supernatant was dried under a nitrogen gas flow. Suc in the samples was quantified with an Agilent 1290 liquid chromatographer equipped with a triple-quadrupole tandem mass spectrometer (Agilent 6460). A UK-Amino column (150 × 4.6 mm, 3 µm) was used for liquid chromatography separation. Suc purchased from Sigma (catalog no. 84097) was used as the standard for quantification.
Detection of Chlorophyll Autofluorescence
Roots of 4- or 5-d-old seedlings were excised and examined using a confocal laser scanning microscope (LSM710; Carl Zeiss). Chlorophyll autofluorescence between 660 and 700 nm was detected with an excitation wavelength of 488 nm.
Quantification of H2O2 Contents in Roots
H2O2 in roots was quantified using the OxiSelect Hydrogen Peroxide Assay Kit (CELL BioLABS; catalog no. STA-343.), according to manufacturer’s instruction. Basically, root samples of 5-d-old seedlings were extracted in 1× phosphate-buffered saline solution. The samples were centrifuged at 10,000g for 5 min to remove debris and repeated three times. Twenty-five microliters of supernatants were then transferred to the microtiter plate wells. Two hundred and fifty microliters of Lipid Working Reagent were added to each well and mixed with the supernatants thoroughly. After incubation at room temperature for 30 min, the plates were read at 595 nm, and the relative values were calculated for the contents of H2O2.
Preparation of RNA-Seq Libraries
Total RNAs were isolated from the root tips of 3-d-old seedlings using the RNeasy Plant Mini Kit (Qiagen). RNA samples were quantified using a NanoDrop 2000c Spectrophotometer (Thermo) and a Qubit Fluorometer (Life Technology). Poly(A+) RNAs were purified by two rounds of hybridization to oligo(dT)-coated Dynal magnetic beads (Life Technology). Sequencing libraries were prepared from poly(A+) RNA as described previously (Jiao and Meyerowitz, 2010). The libraries were sequenced as 50-mers using HiSeq2000 (Illumina) with standard settings. The raw data of Illumina reads are available at the National Center for Biotechnology Information Sequence Read Archive browser (http://ncbi.nlm.nih.gov/sra; accession no. SPR040597).
Analysis of RNA-Seq Data
After the primer/adaptor contaminated reads, the low-quality reads (PHRED quality score < 20) and ambiguous base-containing reads were filtered, and the remaining reads were mapped to the Arabidopsis (Arabidopsis thaliana) TAIR10 reference genome using TopHat2 (version 2.0.8), allowing up to two mismatches (Kim et al., 2013). Minimum and maximum intron lengths were set at 60 and 6,000 nucleotides respectively. After reads that aligned to ribosomal RNA or transfer RNA were removed, the expression counts of gene locus were calculated based on mapping outputs by Cuffdiff2 (version 2.1.1) and were normalized to reads per kilobase per million mapped read using edgeR (Robinson et al., 2010). The cutoff value for significant expression was 0.5 reads per kilobase per million mapped read according to previous control experiments (Jiao and Meyerowitz, 2010). Differential expression was also assessed using edgeR (Robinson et al., 2010). The cutoff value for differential expression was a greater than 2-fold change in expression with a P value ≤ 0.01 (their corresponding adjusted P values by Benjamini-Hochberg procedure ranged from 0.11 to 0.20).
The clustering of differentially expressed genes was performed based on all detected transcripts or individual functional subgroups. All the ratio values were subjected to a log2 transformation followed by centroid linkage hierarchical clustering using Cluster and Treeview (Eisen et al., 1998).
Sequence data from this article can be found in the TAIR database under the following accession numbers: TPST (At1g08030), ACP5 (At5g27200), At4 (At5g03545), AtIPS1 (At3g09922), AtPAP10 (At6g16430), miRNA399D (At2g34202), and RNS1 (At2g02990).
Supplemental Data
The following materials are available in the online version of this article.
Supplemental Figure S1. Characteristics of root growth of the wild type and hps7 mutant.
Supplemental Figure S2. APase activity in the wild type and hps7.
Supplemental Figure S3. Anthocyanin and starch content in the wild type and hps7.
Supplemental Figure S4. Pi starvation-induced gene expression in the wild type and hps7.
Supplemental Figure S5. Cellular Pi and total P contents in the wild type and hps7.
Supplemental Figure S6. The strategy for fine mapping of the HPS7 gene.
Supplemental Figure S7. qPCR analyses of photosynthetic gene expression in the wild type and hps7.
Supplemental Figure S8. qPCR analyses of PIF gene expression in the wild type and hps7.
Supplemental Figure S9. Root meristem cell number of 8-d-old dark-grown wild-type and hps7 seedlings.
Supplemental Figure S10. Primary root length of 8-d-old wild-type and GLK OX lines.
Supplemental Table S1. Summary of mapped RNA reads.
Supplemental Table S2. All transcripts that were differentially expressed in P– wild-type versus P+ wild-type plants.
Supplemental Table S3. Transcription factors that were differentially expressed in P– wild-type, P+ hps7, and P– hps7 plants compared with P+ wild-type plants.
Supplemental Table S4. The cell wall proteins that were differentially expressed in P– wild-type, P+ hps7, and P– hps7 plants compared with P+ wild-type plants.
Supplemental Table S5. The photosynthetic genes that were differentially expressed in P– wild-type, P+ hps7, and P– hps7 plants compared with P+ wild-type plants.
Supplemental Table S6. All transcripts that were differentially expressed in P+ hps7 plants versus P+ wild-type plants.
Supplemental Table S7. All transcripts that were differentially expressed in P+ hps7 plants versus P– hps7 plants.
Supplemental Table S8. The photosynthetic genes that were differentially expressed in P– hps7 plants versus P+ hps7 plants.
Supplemental Table S9. Transcription factors that were differentially expressed in P– hps7 plants versus P+ hps7 plants.
Supplemental Table S10. Sequences of the primers used for qPCR.
Supplemental Table S11. Sequences and chromosomal positions of the primers used for molecular mapping of the HPS7 gene.
Supplementary Material
Acknowledgments
We thank Drs. Shunong Bai, Hongwei Guo, Rongcheng Lin and Congming Lu for helpful discussions, Dr. Jane A. Langdale for providing the seeds of GLK OX lines, Dr. Congming Lu for providing the antibodies for D1 protein, Dr. Sodmergen for advice, Ying Li and Shanshan Du for technical assistance in transmission electron microscopy, and Dr. Jun He for assistance with RNA-seq.
Glossary
- Pi
inorganic phosphate
- RNA-seq
RNA sequencing
- RSA
root system architecture
- APase
acid phosphatase
- P–
inorganic phosphate-deficient
- DAG
days after germination
- P+
inorganic phosphate-sufficient
- qPCR
quantitative real-time PCR
- ROS
reactive oxygen species
- NBT
nitroblue tetrazolium
- H2DCFDA
2′,7′-dichlorodihydrofluorescein diacetate
- H2O2
hydrogen peroxide
- TAIR
The Arabidopsis Information Resource Center
Footnotes
This work was supported by the National Natural Science Foundation of China (grant no. 31170238) and the Ministry of Agriculture of China (grant no. 2014ZX0800932B).
The online version of this article contains Web-only data.
Articles can be viewed online without a subscription.
References
- Aida M, Beis D, Heidstra R, Willemsen V, Blilou I, Galinha C, Nussaume L, Noh YS, Amasino R, Scheres B. (2004) The PLETHORA genes mediate patterning of the Arabidopsis root stem cell niche. Cell 119: 109–120 [DOI] [PubMed] [Google Scholar]
- Bariola PA, Howard CJ, Taylor CB, Verburg MT, Jaglan VD, Green PJ. (1994) The Arabidopsis ribonuclease gene RNS1 is tightly controlled in response to phosphate limitation. Plant J 6: 673–685 [DOI] [PubMed] [Google Scholar]
- Binder S. (2010) Branched-chain amino acid metabolism in Arabidopsis thaliana. Arabidopsis Book 8: e0137. [DOI] [PMC free article] [PubMed] [Google Scholar]
- Bleecker AB, Kende H. (2000) Ethylene: a gaseous signal molecule in plants. Annu Rev Cell Dev Biol 16: 1–18 [DOI] [PubMed] [Google Scholar]
- Borch K, Bouma TJ, Lynch JP, Brown KM. (1999) Ethylene: a regulator of root architectural responses to soil phosphorus availability. Plant Cell Environ 22: 425–431 [Google Scholar]
- Burleigh SH, Harrison MJ. (1999) The down-regulation of Mt4-like genes by phosphate fertilization occurs systemically and involves phosphate translocation to the shoots. Plant Physiol 119: 241–248 [DOI] [PMC free article] [PubMed] [Google Scholar]
- Casimiro I, Marchant A, Bhalerao RP, Beeckman T, Dhooge S, Swarup R, Graham N, Inzé D, Sandberg G, Casero PJ, et al. (2001) Auxin transport promotes Arabidopsis lateral root initiation. Plant Cell 13: 843–852 [DOI] [PMC free article] [PubMed] [Google Scholar]
- del Pozo JC, Allona I, Rubio V, Leyva A, de la Peña A, Aragoncillo C, Paz-Ares J. (1999) A type 5 acid phosphatase gene from Arabidopsis thaliana is induced by phosphate starvation and by some other types of phosphate mobilising/oxidative stress conditions. Plant J 19: 579–589 [DOI] [PubMed] [Google Scholar]
- Dietz KJ, Foyer C. (1986) The relationship between phosphate status and photosynthesis in leaves : reversibility of the effects of phosphate deficiency on photosynthesis. Planta 167: 376–381 [DOI] [PubMed] [Google Scholar]
- Eisen MB, Spellman PT, Brown PO, Botstein D. (1998) Cluster analysis and display of genome-wide expression patterns. Proc Natl Acad Sci USA 95: 14863–14868 [DOI] [PMC free article] [PubMed] [Google Scholar]
- Fujii H, Chiou TJ, Lin SI, Aung K, Zhu JK. (2005) A miRNA involved in phosphate-starvation response in Arabidopsis. Curr Biol 15: 2038–2043 [DOI] [PubMed] [Google Scholar]
- Helariutta Y, Fukaki H, Wysocka-Diller J, Nakajima K, Jung J, Sena G, Hauser MT, Benfey PN. (2000) The SHORT-ROOT gene controls radial patterning of the Arabidopsis root through radial signaling. Cell 101: 555–567 [DOI] [PubMed] [Google Scholar]
- Hirakawa Y, Kondo Y, Fukuda H. (2010) TDIF peptide signaling regulates vascular stem cell proliferation via the WOX4 homeobox gene in Arabidopsis. Plant Cell 22: 2618–2629 [DOI] [PMC free article] [PubMed] [Google Scholar]
- Jacob J, Lawlor DW. (1992) Dependence of photosynthesis of sunflower and maize leaves on phosphate supply, ribulose-1,5-bisphosphate carboxylase/oxygenase activity, and ribulose-1,5-bisphosphate pool size. Plant Physiol 98: 801–807 [DOI] [PMC free article] [PubMed] [Google Scholar]
- Ji J, Strable J, Shimizu R, Koenig D, Sinha N, Scanlon MJ. (2010) WOX4 promotes procambial development. Plant Physiol 152: 1346–1356 [DOI] [PMC free article] [PubMed] [Google Scholar]
- Jiang C, Gao X, Liao L, Harberd NP, Fu X. (2007) Phosphate starvation root architecture and anthocyanin accumulation responses are modulated by the gibberellin-DELLA signaling pathway in Arabidopsis. Plant Physiol 145: 1460–1470 [DOI] [PMC free article] [PubMed] [Google Scholar]
- Jiao Y, Meyerowitz EM. (2010) Cell-type specific analysis of translating RNAs in developing flowers reveals new levels of control. Mol Syst Biol 6: 419. [DOI] [PMC free article] [PubMed] [Google Scholar]
- Kim D, Pertea G, Trapnell C, Pimentel H, Kelley R, Salzberg SL. (2013) TopHat2: accurate alignment of transcriptomes in the presence of insertions, deletions and gene fusions. Genome Biol 14: R36. [DOI] [PMC free article] [PubMed] [Google Scholar]
- Kobayashi K, Sasaki D, Noguchi K, Fujinuma D, Komatsu H, Kobayashi M, Sato M, Toyooka K, Sugimoto K, Niyogi KK, et al. (2013) Photosynthesis of root chloroplasts developed in Arabidopsis lines overexpressing GOLDEN2-LIKE transcription factors. Plant Cell Physiol 54: 1365–1377 [DOI] [PMC free article] [PubMed] [Google Scholar]
- Lei M, Liu Y, Zhang B, Zhao Y, Wang X, Zhou Y, Raghothama KG, Liu D. (2011) Genetic and genomic evidence that sucrose is a global regulator of plant responses to phosphate starvation in Arabidopsis. Plant Physiol 156: 1116–1130 [DOI] [PMC free article] [PubMed] [Google Scholar]
- Leivar P, Quail PH. (2011) PIFs: pivotal components in a cellular signaling hub. Trends Plant Sci 16: 19–28 [DOI] [PMC free article] [PubMed] [Google Scholar]
- Li L, Qiu X, Li X, Wang S, Zhang Q, Lian X. (2010) Transcriptomic analysis of rice responses to low phosphorus stress. Chin Sci Bull 55: 251–258 [Google Scholar]
- Li Z, Wakao S, Fischer BB, Niyogi KK. (2009) Sensing and responding to excess light. Annu Rev Plant Biol 60: 239–260 [DOI] [PubMed] [Google Scholar]
- Liu H, Yu X, Li K, Klejnot J, Yang H, Lisiero D, Lin C. (2008) Photoexcited CRY2 interacts with CIB1 to regulate transcription and floral initiation in Arabidopsis. Science 322: 1535–1539 [DOI] [PubMed] [Google Scholar]
- López-Bucio J, Hernández-Abreu E, Sánchez-Calderón L, Nieto-Jacobo MF, Simpson J, Herrera-Estrella L. (2002) Phosphate availability alters architecture and causes changes in hormone sensitivity in the Arabidopsis root system. Plant Physiol 129: 244–256 [DOI] [PMC free article] [PubMed] [Google Scholar]
- Ma Z, Baskin TI, Brown KM, Lynch JP. (2003) Regulation of root elongation under phosphorus stress involves changes in ethylene responsiveness. Plant Physiol 131: 1381–1390 [DOI] [PMC free article] [PubMed] [Google Scholar]
- Martín AC, del Pozo JC, Iglesias J, Rubio V, Solano R, de La Peña A, Leyva A, Paz-Ares J. (2000) Influence of cytokinins on the expression of phosphate starvation responsive genes in Arabidopsis. Plant J 24: 559–567 [DOI] [PubMed] [Google Scholar]
- Matsuzaki Y, Ogawa-Ohnishi M, Mori A, Matsubayashi Y. (2010) Secreted peptide signals required for maintenance of root stem cell niche in Arabidopsis. Science 329: 1065–1067 [DOI] [PubMed] [Google Scholar]
- Misson J, Raghothama KG, Jain A, Jouhet J, Block MA, Bligny R, Ortet P, Creff A, Somerville S, Rolland N, et al. (2005) A genome-wide transcriptional analysis using Arabidopsis thaliana Affymetrix gene chips determined plant responses to phosphate deprivation. Proc Natl Acad Sci USA 102: 11934–11939 [DOI] [PMC free article] [PubMed] [Google Scholar]
- Morcuende R, Bari R, Gibon Y, Zheng W, Pant BD, Bläsing O, Usadel B, Czechowski T, Udvardi MK, Stitt M, et al. (2007) Genome-wide reprogramming of metabolism and regulatory networks of Arabidopsis in response to phosphorus. Plant Cell Environ 30: 85–112 [DOI] [PubMed] [Google Scholar]
- Muchhal US, Pardo JM, Raghothama KG. (1996) Phosphate transporters from the higher plant Arabidopsis thaliana. Proc Natl Acad Sci USA 93: 10519–10523 [DOI] [PMC free article] [PubMed] [Google Scholar]
- Nacry P, Canivenc G, Muller B, Azmi A, Van Onckelen H, Rossignol M, Doumas P. (2005) A role for auxin redistribution in the responses of the root system architecture to phosphate starvation in Arabidopsis. Plant Physiol 138: 2061–2074 [DOI] [PMC free article] [PubMed] [Google Scholar]
- Natr L. (1992) Mineral nutrients: a ubiquitous stress factor for photosynthesis. Photosynthetica 27: 271–294 [Google Scholar]
- O’Rourke JA, Yang SS, Miller SS, Bucciarelli B, Liu J, Rydeen A, Bozsoki Z, Uhde-Stone C, Tu ZJ, Allan D, et al. (2013) An RNA-Seq transcriptome analysis of orthophosphate-deficient white lupin reveals novel insights into phosphorus acclimation in plants. Plant Physiol 161: 705–724 [DOI] [PMC free article] [PubMed] [Google Scholar]
- Pérez-Torres CA, López-Bucio J, Cruz-Ramírez A, Ibarra-Laclette E, Dharmasiri S, Estelle M, Herrera-Estrella L. (2008) Phosphate availability alters lateral root development in Arabidopsis by modulating auxin sensitivity via a mechanism involving the TIR1 auxin receptor. Plant Cell 20: 3258–3272 [DOI] [PMC free article] [PubMed] [Google Scholar]
- Preiss J. (1984) Starch, sucrose biosynthesis and partition of carbon in plants are regulated by orthophosphate and triosephosphates. Trends Biochem Sci 9: 24–27 [Google Scholar]
- Raghothama KG. (1999) Phosphate acquisition. Annu Rev Plant Physiol Plant Mol Biol 50: 665–693 [DOI] [PubMed] [Google Scholar]
- Rao IM, Terry N. (1995) Leaf phosphate status, photosynthesis, and carbon partitioning in sugar beet: IV. Changes with time following increased supply of phosphate to low-phosphate plants. Plant Physiol 107: 1313–1321 [DOI] [PMC free article] [PubMed] [Google Scholar]
- Robinson MD, McCarthy DJ, Smyth GK. (2010) edgeR: a Bioconductor package for differential expression analysis of digital gene expression data. Bioinformatics 26: 139–140 [DOI] [PMC free article] [PubMed] [Google Scholar]
- Růzicka K, Ljung K, Vanneste S, Podhorská R, Beeckman T, Friml J, Benková E. (2007) Ethylene regulates root growth through effects on auxin biosynthesis and transport-dependent auxin distribution. Plant Cell 19: 2197–2212 [DOI] [PMC free article] [PubMed] [Google Scholar]
- Sabatini S, Beis D, Wolkenfelt H, Murfett J, Guilfoyle T, Malamy J, Benfey P, Leyser O, Bechtold N, Weisbeek P, et al. (1999) An auxin-dependent distal organizer of pattern and polarity in the Arabidopsis root. Cell 99: 463–472 [DOI] [PubMed] [Google Scholar]
- Sánchez-Calderón L, López-Bucio J, Chacón-López A, Cruz-Ramírez A, Nieto-Jacobo F, Dubrovsky JG, Herrera-Estrella L. (2005) Phosphate starvation induces a determinate developmental program in the roots of Arabidopsis thaliana. Plant Cell Physiol 46: 174–184 [DOI] [PubMed] [Google Scholar]
- Schiefelbein J, Kwak SH, Wieckowski Y, Barron C, Bruex A. (2009) The gene regulatory network for root epidermal cell-type pattern formation in Arabidopsis. J Exp Bot 60: 1515–1521 [DOI] [PMC free article] [PubMed] [Google Scholar]
- Sivak W. (1986) Photosynthesis in vivo can be limited by phosphate supply. New Phytol 102: 499–512 [Google Scholar]
- Sønderby IE, Geu-Flores F, Halkier BA. (2010) Biosynthesis of glucosinolates: gene discovery and beyond. Trends Plant Sci 15: 283–290 [DOI] [PubMed] [Google Scholar]
- Strabala TJ, O’donnell PJ, Smit AM, Ampomah-Dwamena C, Martin EJ, Netzler N, Nieuwenhuizen NJ, Quinn BD, Foote HC, Hudson KR. (2006) Gain-of-function phenotypes of many CLAVATA3/ESR genes, including four new family members, correlate with tandem variations in the conserved CLAVATA3/ESR domain. Plant Physiol 140: 1331–1344 [DOI] [PMC free article] [PubMed] [Google Scholar]
- Svistoonoff S, Creff A, Reymond M, Sigoillot-Claude C, Ricaud L, Blanchet A, Nussaume L, Desnos T. (2007) Root tip contact with low-phosphate media reprograms plant root architecture. Nat Genet 39: 792–796 [DOI] [PubMed] [Google Scholar]
- Ticconi CA, Delatorre CA, Lahner B, Salt DE, Abel S. (2004) Arabidopsis pdr2 reveals a phosphate-sensitive checkpoint in root development. Plant J 37: 801–814 [DOI] [PubMed] [Google Scholar]
- Ticconi CA, Lucero RD, Sakhonwasee S, Adamson AW, Creff A, Nussaume L, Desnos T, Abel S. (2009) ER-resident proteins PDR2 and LPR1 mediate the developmental response of root meristems to phosphate availability. Proc Natl Acad Sci USA 106: 14174–14179 [DOI] [PMC free article] [PubMed] [Google Scholar]
- Vance CP, Uhde-Stone C, Allan DL. (2003) Phosphorus acquisition and use: critical adaptations by plants for securing a nonrenewable resource. New Phytol 157: 423–447 [DOI] [PubMed] [Google Scholar]
- Wang L, Li Z, Qian W, Guo W, Gao X, Huang L, Wang H, Zhu H, Wu JW, Wang D, et al. (2011) The Arabidopsis purple acid phosphatase AtPAP10 is predominantly associated with the root surface and plays an important role in plant tolerance to phosphate limitation. Plant Physiol 157: 1283–1299 [DOI] [PMC free article] [PubMed] [Google Scholar]
- Waters MT, Wang P, Korkaric M, Capper RG, Saunders NJ, Langdale JA. (2009) GLK transcription factors coordinate expression of the photosynthetic apparatus in Arabidopsis. Plant Cell 21: 1109–1128 [DOI] [PMC free article] [PubMed] [Google Scholar]
- Wu P, Ma L, Hou X, Wang M, Wu Y, Liu F, Deng XW. (2003) Phosphate starvation triggers distinct alterations of genome expression in Arabidopsis roots and leaves. Plant Physiol 132: 1260–1271 [DOI] [PMC free article] [PubMed] [Google Scholar]
- Yu H, Luo N, Sun L, Liu D. (2012) HPS4/SABRE regulates plant responses to phosphate starvation through antagonistic interaction with ethylene signalling. J Exp Bot 63: 4527–4538 [DOI] [PMC free article] [PubMed] [Google Scholar]
- Zhou W, Wei L, Xu J, Zhai Q, Jiang H, Chen R, Chen Q, Sun J, Chu J, Zhu L, et al. (2010) Arabidopsis tyrosylprotein sulfotransferase acts in the auxin/PLETHORA pathway in regulating postembryonic maintenance of the root stem cell niche. Plant Cell 22: 3692–3709 [DOI] [PMC free article] [PubMed] [Google Scholar]
Associated Data
This section collects any data citations, data availability statements, or supplementary materials included in this article.