

Abstract
Foxn1 is essential for thymic organogenesis and T lymphopoiesis. While reduced Foxn1 expression results in a decline in T lymphopoiesis, overexpression of Foxn1 in the thymus of a transgenic mouse model (Foxn1Tg) attenuates the age-associated decline in T lymphopoiesis. T lymphopoiesis begins with ETP, derived from MPP in the BM. A decline in MPP and ETP numbers with age is thought to contribute to reduced T lymphopoiesis. Previously, we showed that reduced ETP number with age is attenuated in Foxn1Tg; whether the effect is initiated in the BM with MPP is not known. Here, we report that Foxn1 is expressed in Wt BM and over-expressed in Foxn1Tg. With age, the number of MPP in Foxn1Tg was not reduced, and Foxn1Tg also have a larger pool of HSC. Furthermore, the Foxn1Tg BM is more efficient in generating MPP. In contrast to MPP, CLP and B lineage cell numbers were significantly lower in both young and aged Foxn1Tg compared to Wt. We identified a novel population of lineageneg/low, CD45pos EpCAMpos, SCA1pos, CD117neg, CD138neg, MHCIIneg cells as Foxn1-expressing BM cells that also express Delta-like 4. Thus, Foxn1 affects both T lymphopoiesis and hematopoiesis, and the Foxn1 BM niche may function in skewing MPP development toward T lineage progenitors.
Introduction
The gene encoding the forkhead boxn1 (Foxn1) transcription factor is the essential single gene responsible for thymic organogenesis and consequently T lymphopoiesis (1). Foxn1 was discovered in nude mice carrying a spontaneous mutation that results in the athymic and hairless phenotypes (2). Previously, we demonstrated that the decline of Foxn1 expression in the thymic stroma with age correlates with the decline in thymocyte number, suggesting a role for Foxn1 in thymic involution (3). Others found that deletion of Foxn1 in the postnatal thymus results in premature thymic involution (4, 5).
Naïve T cells develop from early T cell progenitors (ETP) in the thymus (6, 7). The decline in the frequency and number of ETP with age contributes to decreased T lymphopoiesis (8). ETP are non-self-renewing and therefore the thymus relies on the BM for a continuous supply of progenitors to maintain T lymphopoiesis (9, 10). The multipotent progenitor (MPP) population in the BM is thought to contain the precursor to thymic ETP (11, 12). With age, the number of MPP declines, suggesting that thymic involution is initiated in the BM (13).
Using a Foxn1 transgenic mouse (Foxn1Tg) model, we demonstrated that age-associated thymic involution is attenuated (14). In aged Foxn1Tg, the frequency of ETP is not reduced, and the number of ETP is higher than in aged Wt, resulting in a higher number of thymocytes (14). Since over-expression of Foxn1 attenuates the decline in ETP number with age, we were compelled to interrogate a potential function of Foxn1 in maintaining the ETP precursors, which are the MPP in the BM.
Here, we report that Foxn1 is expressed in the BM of Wt mice and over-expressed in the BM of Foxn1Tg. Foxn1-expressing cells were found within a novel population of Linneg/low, CD45pos EpCAMpos, SCA1pos, CD117neg, CD138neg , MHCIIneg BM cells that also express the Notch ligand Delta-like 4 (Dl4). While the total number of MPP decreased with age in Wt, the MPP population remained unchanged in aged Foxn1Tg. Despite preventing the decline in MPP number with age, the number of CLP was reduced in Foxn1Tg; furthermore, over-expression of Foxn1 did not prevent the decline in CLP with age. In adoptive transfer experiments, we showed that the aged Foxn1Tg BM microenvironment/niche is more efficient in promoting the generation of MPP. Thus, our data suggest that Foxn1-expressing BM cells contribute to hematopoiesis and generation of T cell progenitors within the BM.
Materials and Methods
Mice
Generation of Foxn1Tg mice (C57BL/6) was previously described (14). Mouse Foxn1 is expressed under the human keratin 14 promoter. Two Foxn1Tg colonies, line 5 with 10-12 copies and line 60 with 4-5 copies of the transgene, were maintained at Loyola University Medical Center vivarium. Since we have shown in the previous study that both lines display identical phenotypes, both Foxn1Tg lines were used in the current study and the data were pooled (14). Young and aged Wt C57BL/6 mice were from Harlan through the NIA. BM cells from Foxn1cre-Rosa26-lacZ mice, which were previously described (15), were generously provided by Dr. Vishwa Deep Dixit (Pennington Biomedical Research Center, Baton Rouge, LA). The H2-SVEX mice were on C57BL/6, CD45.1 background and were used to track cells with RAG activities (16).
Flow cytometry
Table I lists monoclonal antibodies used to identify HSC, MPP, CLP, CTP, CIP, and B lineage cells. Samples were analyzed on FACSCanto II or sorted using a FACSAria (BD San Jose, CA). Analysis was performed using FlowJo 7.6.1 (Treestar Ashland, OR).
Table I.
List of monoclonal antibodies used in the study
| Antibody | Clone | Fluorochrome | Source |
|---|---|---|---|
| CD16/32 | 2.4G2 | Purified | eBioscience |
| CD3* | 145-2c11 | Biotin | eBioscience |
| CD8* | 53-6.7 | Biotin | eBioscience |
| B220* | RA3-6B2 | Biotin | eBioscience |
| CD49b* | DX5 | Biotin | eBioscience |
| CD11b* | Mi/70 | Biotin | eBioscience |
| Gr-1* | RB6-8C5 | Biotin | eBioscience |
| Ter119* | Ter119 | Biotin | eBioscience |
| Sca-1 | D7 | PECy5 | eBioscience |
| CD117 | 2B8 | APC | eBioscience |
| CD135 | A2F10 | PE | eBioscience |
| CD127 | A7R34 | PECy7 | eBioscience |
| CD90.2 | 53-2.1 | PECy5 | eBioscience |
| CD2 | RM2-5 | PE | eBioscience |
| B220 | RA3-6B2 | FITC | eBioscience |
| CD19 | 1D3 | PE | eBioscience |
| EpCAM | G8.8 | APC | BD Pharmingen |
| CD138 | 281-2 | PE | eBioscience |
| CD45.1 | A20 | AF780 | eBioscience |
| CD45.2 | 104 | Percp | BD Pharmingen |
| CD45 | 30-F11 | Percp | BD Pharmingen |
| MHCII | M5/114.15.2 | AF780 | eBioscience |
List of flow cytometry antibodies. All staining included a blocking step with CD16/32. Asterisk (*) denotes biotinylated antibodies used with strepavidin-FITC to identify lineage positive cells. Sca-1, CD117, CD127, and CD135 were used to identify HSC, MPP, and CLP. CTP and CIP were identified within the lineage negative (linneg) subset using CD90.2 and CD2. B220-FITC and CD19PE were used to determine the number of B lineage cells in the BM. EpCAM and CD138 were used to identify Foxn1 expressing cells in the BM. Antibodies to CD45.1 and CD45.2 were used to identify donor and host cells in adaptive transfers.
Cell cycle
Eight to twenty five thousand (8-25 × 103) FACS-sorted progenitors (HSC, MPP, CTP, and CIP) from an individual mouse or pooled from 2-6 mice were washed in PBS and fixed overnight in PBS with 70% ethanol and 15% FBS. Fixed cells were washed twice in PBS and re-suspended in 250μl of 0.05mg/mL propidium iodine, 0.1mM EDTA, plus 0.05mg/mL RNase A at 25°C for one hour.
Bone marrow adoptive transfers
FACS-sorted LSK cells (8-16 × 103) from CD45.1pos H2-SVEX BM were intravenously injected into non-irradiated 17-21 mo CD45.2 Wt and Foxn1Tg hosts. After 10 weeks, the frequency of donor HSC, MPP, CTP, and CIP were determined using flow cytometry.
Methylcellulose bone marrow colony assay
BM cells (104) from Wt and Foxn1Tg (1-4 and 19-25 mo) were cultured in MethoCult methylcellulose (Stem Cell Technologies, Vancouver Canada) at 37°C with 5% CO2. After 9 days, the total number and type of colonies were counted.
RT-PCR
Total RNA from BM cells was isolated using Qiagen's RNeasy and cDNA was synthesized as previously described (14). Expression of endogenous Foxn1, and transgene Foxn1 was determined by quantitative RT-PCR and calculated as previously published (14). RT-PCR was used to determine expression of Dl1 and Dl4 in sorted cells; primers are listed in Table II. Expression of Hprt was used as control.
Table II.
List of primers used in the study
| Primer Name | Forward Sequence | Reverse Sequence |
|---|---|---|
| Dl1 | CTTCTTTCGCGTATGCCTCAA | AGGCGGCTGATGAGTCTTTCT |
| Dl4 | CGCCAGGAAACTCTCTCATCA | GCTCATGACAGCCAGAAAGACA |
| Hprt | AGCAGTACAGCCCCAAAATGG | TGCGCTCATCTTAGGCTTTGT |
Forward and reverse sequences of primers used to measure gene expression.
Immunohistochemistry
Sternums were fixed for 48 hours in Zamboni solution (4% paraformaledehyde with picric acid) and decalcified in 15% sucrose containing 2% acetic acid for 72 hours. For staining, 5μm sections were de-paraffinized and antigen retrieval was performed using Dako's Target Retrieval Citrate Buffer pH 6 (Carpinteria, CA) with steam at 89°C for one hour. Sections were treated with 3% hydrogen peroxide and blocked sequentially with human serum (Invitrogen), Superblock (ScyTek Laboratories Inc., Logan ,UT), anti-mouse CD16/32 (5ng/ml eBioscience, San Diego, CA) and finally with 2% BSA in PBS. Sections were incubated with rabbit anti-mouse Foxn1 (2μg/mL) (H-270 Santa Cruz Technologies, Santa Cruz, CA) overnight at 4°C. Primary antibodies were detected using a cocktail of biotinylated antibody-HRP (Dako's LSAB, Carpinteria, CA) or with biotinylated donkey anti-rabbit IgG (6μg/mL Jackson ImmunoResearch Labratories, West Grove PA) followed by streptavidin-HRP, and visualized with 3-Amino-9-ethylcarbazole (AEC). Electronically sorted BM cells were cyto-centrifuged on to slides (500 cells/slide), fixed in acetone at −20°C, and permeabilized in 0.1% NP-40 at 25°C. Cells were then blocked and stained with rabbit anti-mouse Foxn1 (2μg/mL) or rabbit anti-E. coli β-galactosidase antibodies (Immunology Consultant Laboratory, Portland OR) at 4 μg/mL and developed as described above. Purified rabbit IgG was used as control.
Statistical analysis
Student t-test and Mann-Whitney U test was used for comparisons. For multiple comparisons, a two way ANOVA was used. All statistical tests were performed using Sigma Stat 2.03. Ps ≤ 0.05 are statistically significant.
Results
MPP number does not decline with age in Foxn1Tg
The MPP population is thought to be BM precursors to ETP (8, 11, 12). With age, both ETP and MPP populations decline (8, 13). We demonstrated that the number of thymic ETP in aged Foxn1Tg was higher than aged Wt mice (14). Thus, we determined if the number of MPP in the BM is also higher in aged Foxn1Tg. The total number of MPP in Wt BM decreased 3.7-fold by 20-21 months (p=0.126) and 9.7-fold by 24-25 months (#p<0.001) of age compared to Wt 1-2 mo (Fig. 1A). In young Foxn1Tg, the numbers of MPP were not different than young Wt. The total MPP number in the Foxn1Tg 20-21 and 24-25 mo groups was higher than age matched Wt (§p=0.002, 20-21 mo; ##p=0.03, 24-25 mo). Furthermore, the sizes of the MPP pool in Foxn1Tg were maintained since their numbers were not different among the three age groups or compared to Foxn1Tg that were 26-35 months old (Fig. 1A). Thus, over-expression of Foxn1in the BM prevented the decline and maintained MPP number with age.
Figure 1. Changes in HSC and MPP number with age in Wt and Foxn1Tg mice.

One to two million (1-2 × 10⁶) BM nucleated cells from Wt and Foxn1Tg were analyzed using flow cytometry to determine percentages which were then used to calculate the total number of MPP and HSC per two tibias and two femurs. HSC were defined as Linneg Sca1pos CD117pos CD135neg and MPP as Linneg Sca1pos CD117pos CD135pos. A) Total number of MPP in Wt and Foxn1Tg from three age groups. P values were from t-test; #p<0.001 Wt 24-25 mo vs. Wt 1-4 mo; §p=0.002 Wt 20-21 mo vs. Foxn1Tg 20-21 mo; ##p=0.03 Foxn1Tg 24-25 mo vs. Wt 24-25 mo. B) Total number of HSC in Wt and Foxn1Tg; *p=0.004 Wt 20-21 mo vs. Wt 1-2 mo; #p=0.036 Wt 24-25 mo vs. Wt 1-4 mo; ‡ p=0.036 Foxn1Tg 1-4 mo vs. Wt 1-4 mo; †p<0.001 Foxn1Tg 20-21 mo vs. Foxn1Tg 1-4 mo; ¶p=0.01 Foxn1Tg 20-21 mo vs. Wt 20-21 mo; §p=0.01 Foxn1Tg 24-25 mo vs. Wt 24-25 mo. C) Representative flow cytometry profiles showing changes with age in the frequencies of LSK in Wt and Foxn1Tg. LSK cells were identified as Linneg Sca1pos and CD117pos. Numbers represent the average plus or minus SD. Numbers in parenthesis denote the number of mice.
Foxn1Tg have a larger HSC pool
In Wt BM, it was suggested that the decline in MPP with age is due to a developmental block in differentiation of HSC to MPP, as HSC are the immediate precursors to MPP and HSC number increases with age (13). We determined HSC number in young and aged Wt and Foxn1Tg to assess if over-expression of Foxn1 affects age-associated changes in HSC. HSC number in Wt increased 2.1-fold by 20-21 mo compared to 1-4 mo (Fig. 1B *p=0.004). However, Wt that were 24-25 mo showed a 5.4- fold reduction compared to 20-21 mo (p<0.001) and a 2.6 fold reduction compared to 1-4 mo (#p=0.036) (Fig. 1B). Compared to Wt, HSC number in 1-4 mo Foxn1Tg was significantly higher (1.3-fold) (Fig. 1B, ‡p=0.036). As in Wt, there was an increase in HSC number in the 20-21 mo Foxn1Tg that was higher than age matched Wt (Fig. 1B, †p<0.001 Foxn1Tg 20-21 mo vs. 1-4 mo; ¶p=0.01 Foxn1Tg 20-21 vs. Wt 20-21). More importantly, HSC number in the 24-25 mo Foxn1Tg was only reduced to the level found in 1-4 mo; whereas, Wt HSC levels in the 24-25 mo group were about 1/3 of those in the 1-4 mo groups (Fig. 1B). Overall, HSC number in the 24-25 mo Foxn1Tg was 3.9-fold higher than age matched Wt (Fig. 1B, §p=0.01). Furthermore, HSC number in Foxn1Tg BM 26-35 mo was not statistically different than Foxn1Tg mice 24-25 mo (p=0.800). Although the age-associated changes in the fluctuation of HSC were present in Foxn1Tg as in Wt mice, Foxn1Tg at each age group had a higher number of HSC compared to age matched Wt, suggesting that over-expression of Foxn1 resulted in the maintenance of a larger HSC pool with age. Figure 1C depicts the flow cytometric profiles for LSK, HSC and MPP in Wt and Foxn1Tg mice.
To rule out the possible contribution of a Foxn1-mediated increase in BM cellularity, we determined the total number of BM nucleated cells of Wt and Foxn1Tg mice. No significant difference was observed between total cell numbers in Wt and Foxn1Tg mice 2-4 mo (Supplemental Fig. 1A). The number of BM nucleated cells in Wt significantly increased with age as previously reported (Supplemental Fig A. 1 #p=0.01) (17). However, the age-associated increases were not observed in aged Foxn1Tg although this group included mice that were up to 35 mo old (Supplemental Fig. 1A). These data demonstrated that the higher numbers of HSC and MPP in Foxn1Tg were not due to increases in BM cellularity but rather the maintenance of the HSC and MPP compartments with age.
The age-associated changes in HSC and MPP populations in Wt and Foxn1Tg were also reflected in the frequency of the LSK. In Wt 1-4 to 20-21 mo, the LSK frequency remained unchanged as the number of HSC increased and MPP decreased (Fig. 1A-C). However, from 20-21 to 24-25 mo, the LSK frequency declined as did the numbers of MPP and HSC (Fig. 1A-C). Foxn1Tg showed an increase in the frequency of LSK from 1-4 to 20-21 mo, resulting from the maintenance of MPP and the increases in HSC. At 24-25 mo, the frequencies of LSK populations were comparable to that of mice 1-4 mo relatively to the changes observed in HSC populations. These data demonstrated that in mice 24-25 mo old, over-expression of Foxn1 resulted in a larger LSK population through the maintenance of the HSC and MPP populations.
HSC and MPP in Foxn1Tg are resistant to age-associated cell death
Cell cycle analysis was performed to elucidate a cellular mechanism explaining a larger HSC pool and the prevention of the decline in MPP with age. Electronically sorted HSC and MPP from young (2-5 mo) and aged (20-29 mo) Wt and Foxn1Tg were analyzed. We found no increase with age in the percentage of HSC in S,G2/M phase in Wt (Fig. 2A). In contrast, aged Foxn1Tg had a 1.7-fold increase in the percentage of HSC in S,G2/M compared with young Foxn1Tg (§p=0.005) and the levels were significantly higher than in aged Wt (Fig. 2A,*p=0.001). No changes were observed in the MPP frequency of S,G2/M within MPP with age in either Wt or Foxn1Tg (Fig. 2B). When cell death was determined based on the percent of cells in sub G0, a significant increase in the percentage of HSC in the sub G0 fraction occurred with age in Wt mice (Fig. 2C, #p=0.04). While there was a similar trend in MPP from Wt, the increase was not significant (Fig. 2D). In contrast, the percentages of HSC and MPP in subG0 were not significantly different between young and aged Foxn1Tg. Strikingly, the fractions of HSC and MPP in sub G0 in Foxn1Tg (20-29 mo) were 3.5-fold less (Fig. 2C **p=0.03) and 3.7-fold less (Fig. 2D ##p=0.005) compared to Wt, respectively. Thus, with age, over-expression of Foxn1 results in increased HSC proliferation and reduced cell death of both HSC and MPP.
Figure 2. Changes in cell cycle activity in HSC and MPP with age.

FACS-sorted HSC and MPP were analyzed for cell cycle activity using propidium iodine. A, B) Percentages of HSC and MPP in S,G2/M. P values were from t-test; §p=0.005 Foxn1Tg 20-29 mo vs. Foxn1Tg 2-5 mo; *p=0.001 Foxn1Tg 20-29 mo vs. Wt 20 mo. C, D) Percentages of HSC and MPP in sub G0. #p=0.04 Wt 20 mo vs. Wt 2 mo; **p=0.03 Foxn1Tg 20-29 mo vs. Wt 20 mo; ##p=0.005 Foxn1Tg 20-29 mo vs. Wt 20 mo. Numbers in parentheses denote the number of mice in each age group. Error bars are SD.
Foxn1 is expressed in the BM of Wt and Foxn1Tg mice
It is well established that Foxn1 is expressed in epithelial cells of the thymus and skin and plays a critical role in thymic organogenesis and hair follicle development, respectively (2). However, expression of Foxn1 in the BM has not been previously interrogated. The differences in the numbers of HSC and MPP between Foxn1Tg and Wt mice provide a functional basis to investigate if Foxn1 is indeed expressed in BM. Figure 3A revealed that Foxn1 was expressed in the BM of Foxn1Tg mice and that expression of Foxn1 did not decline significantly with age. As we have previously shown in the thymus (14), both the transgene and endogenous Foxn1 were expressed in the BM of Foxn1Tg mice. Foxn1 was also expressed in the BM of Wt mice. Young and aged Wt mice expressed Foxn1 in the BM at low levels (average 414 copies/μg of total RNA) (Fig. 3B). Foxn1Tg had a 98-fold higher Foxn1 level compared to age matched Wt (Fig. 3A-B). Contrary to the thymus, expression of the endogenous Foxn1 did not change significantly with age (3, 14). When the endogenous level of Foxn1 was compared between Foxn1Tg and Wt, expression of the transgene increased the endogenous Foxn1 levels as seen in the thymus (14). The endogenous Foxn1 levels were 18-24 fold higher in young and aged Foxn1Tg mice compared to age matched Wt (Fig. 3B compared to Fig. 3A, young p=0.036; aged p=0.024), supporting the previous observation that expression of Foxn1 is self-regulated (14).
Figure 3. Expression of Foxn1 in the bone marrow.

Nucleated BM cells were used to prepared total RNA and cDNA synthesis for quantitative RT-PCR analysis. Data are presented as copy number of transcripts/μg of total RNA extrapolated from a standard curve (10-100,000 copies/μL). All samples were run in triplicate. A) Expression of endogenous and transgene Foxn1 in Foxn1Tg 2 mo and 23-28 mo. Specific primer sets that detect only transgene transcripts or both forms of transcript were used to calculate endogenous Foxn1 expression levels. B) Expression of Foxn1 in Wt BM 2 mo and 20-24 mo. Numbers in parenthesis denote the number of mice in each age group. Error bars are SD. C) Foxn1 expressing cells in the BM as determined by immunohistochemistry assay. Sternums from Wt and Foxn1Tg mice were fixed, embedded in paraffin blocks, and sectioned at 5 μm. Antigen retrieval was performed on rehydrated tissue sections prior to staining with either rabbit anti-mouse Foxn1 or rabbit IgG at 2μg/ml. Primary antibodies were incubated overnight at 4°C. Dako Universal LSAB biotinylated antibody cocktail t or Donkey anti-rabbit biotin (6 μg/ml) followed by streptavidin-HRP was used for detection of primary antibody. Sections were developed with AEC for 1.5 minutes and counterstained with hematoxylin. Pictures were taken using a Leitz Diaplan microscope with Retiga 2000R camera. Arrows point to Foxn1 positive cells. S denotes sinusoid (dashed lines).
Foxn1pos cells are present in the BM of Wt and Foxn1Tg
We next determined if Foxn1-expressing cells are present and detectable in BM of Wt mice, and if that is the case, whether Foxn1-expressing cells are associated with the endosteal or the vascular niches (18). Foxn1pos cells appeared as single cells in the central marrow cavity with proximity to sinusoids of young Wt mice. On the average, 1-3 cells per 5 individual 5μm thickness BM sections were detected (Fig. 3C), consistent with the low copy number of transcripts determined in Wt marrow (Fig. 3B). In BM of young Foxn1Tg, Foxn1pos cells were readily detectable within the vicinity of sinusoids, averaging 3-6 cells per 5μm section (Fig. 3C). Morphologically, the Foxn1-expressing cells were round with an abundant cytoplasm and a centrally-located nucleus (Fig. 3C). In aged Wt and Foxn1Tg, the Foxn1pos cell number per section increased; however, there were more Foxn1-expressing cells in aged Foxn1Tg compared to aged Wt (Fig. 3C). We also detected K14pos cells with an identical morphology to the Foxn1pos cells in both Wt and Foxn1Tg mice (Supplemental Fig. 2 A-C, E).
Medullary thymic epithelial cells (mTEC) are the predominant TEC expressing Foxn1(5). The mTEC are identified as TEC that express the epithelial adhesion cell molecule EpCAM (19). To identify the phenotype of Foxn1pos cells in the BM of Wt and Foxn1Tg mice, BM cells were analyzed by flow cytometry for EpCAMpos. EpCAMpos cells were present in both Wt and Foxn1Tg BM among the Linneg/low cells (Fig. 4A). Both Wt and Foxn1Tg Linneg/low EpCAMpos cells also expressed CD45 and SCA1; however, these cells were negative for CD117 and MHC II. In agreement with this observation, we detected Foxn1 transcripts by RT-PCR in sorted CD45pos but not in the CD45neg BM cell fraction (Supplemental Fig. 3A). Sorted HSC and MPP from Wt and Foxn1Tg mice did not express Foxn1 (Supplemental Fig. 3B).
Figure 4. Phenotypic characterization of Foxn1 expressing BM cells and their frequencies in Wt and Foxn1Tg mice.

A) Total BM cells were analyzed by flow cytometry; the gating of Linneg/low EpCAMpos BM cells in 3-4 mo and 18-23 mo Wt and Foxn1Tg mice is shown. Foxn1Tg Linneg/low EpCAMpos cells were analyzed for the expression of CD45, Sca1, CD117 and MHCII. Although not shown, expressions of these markers were identical on Wt Linneg/low EpCAMpos cells. B) Electronically sorted Linneg/low EpCAMpos and Linneg/low EpCAMpos CD138neg cells from Wt, Foxn1Tg, or Foxn1cre-Rosa26-lacZ reporter mice were cyto-centrifuged and stained for Foxn1 or anti-E.coli β-galactosidase as described in the Materials and Methods. C) Frequencies of Foxn1pos cells were calculated based on the percentages of positive cells within the Linneg/low EpCAMpos CD138neg population in combination with the frequency of Linneg/low EpCAMpos CD138neg cells determined by flow cytometry and expressed as number of positive cells per 100,000 BM cells. Wt are 24 months and Foxn1Tg are 18-23 months of age. Numbers in parentheses denote the number of mice in each group.
FACS-sorted the Linneg/low EpCAMpos cells from aged Foxn1Tg and Wt mice were assessed for Foxn1 expression by immunohistochemistry. Figure 4B depicts the morphology of the Foxn1pos cells from the sorted population (top panels); the cellular morphology was similar to Foxn1pos cells identified in situ (Fig. 3C). On average, 12.8% of these cells were Foxn1pos (data not shown). Because BM plasma cells also express EpCAM (20), we sorted Linneg/low EpCAMpos CD138neg (or Syndecan-1, a common marker of plasma cells) and stained for Foxn1. Between 23% and 40% of the Linneg/low EpCAMpos were negative for CD138 in Wt and Foxn1Tg, respectively (Fig. 4B, middle panels, data not shown). Notably, the Linneg/low EpCAMpos CD138neg population was greatly enriched for Foxn1pos cells; on average 45% and 68% of this subset were positive for Foxn1 in Wt and Foxn1Tg, respectively (data not shown). The frequencies of Linneg/low EpCAMpos CD138neg Foxn1pos cells per 100,000 BM nucleated cells were calculated to be 3±1 in old Wt and 95±49 in old Foxn1Tg (Fig. 4C). Additionally, Linneg/low EpCAMpos CD138neg BM cells from Foxn1Tg mice also expressed K14 (Supplemental Fig. 2 G-J).
To confirm that Foxn1 is normally expressed in the BM of Wt mice, BM cells were isolated from Foxn1cre-Rosa26-Lac Z reporter mice in which expression of bacterial β-galactosidase is driven by the Foxn1 promoter. The sorted Linneg/low EpCAMpos CD138neg BM cells from Foxn1cre-Rosa26-LacZ mice (24 mo) stained positive for β-galactosidase and showed identical morphology as compared to Foxn1pos within the Linneg/low EpCAMpos CD138neg population of Foxn1Tg and Wt (Fig. 4B, bottom two panels). Taken together, the data demonstrated that Foxn1 is indeed normally expressed in the BM, albeit at a low level as determined by quantitative RT-PCR (Fig. 3A, B).
Foxn1Tg BM microenvironment is more efficient in promoting the development of MPP and T cell progenitors
To examine if Foxn1Tg mice are more efficient in promoting MPP development, FACS-sorted LSK cells from CD45.1 H2-SVEX BM were transferred intravenously into non-irradiated aged Wt and Foxn1Tg hosts and the frequencies of donor-derived MPP and HSC were determined 10 weeks post-transplant. H2-SVEX mice were chosen to determine if the Foxn1Tg environment is more efficient in promoting lymphoid lineage commitment through Rag expression and activity. No significant differences in donor frequencies were observed among HSC or MPP generated in Wt and Foxn1Tg BM hosts (Fig 5A, B). The donor frequency ratios of MPP/HSC were calculated as a measurement of the efficacy in the generation of MPP. The ratios of donor MPP/HSC were higher in aged Foxn1Tg compared to Wt (*p=0.03 Fig.5C), suggesting that the Foxn1Tg environment is more efficient in promoting the generation of MPP from HSC. Our analyses did not detect donor MPP that were VEX positive, an observation previously seen within the LSK BM population, which includes MPP (data not shown) (21).
Figure 5. Differences in the ability of aged BM microenvironment of Wt and Foxn1Tg mice to promote the generation of MPP from HSC.
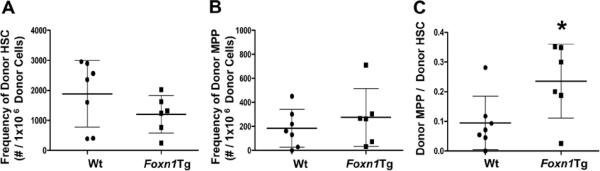
LSK were sorted from CD45.1pos mice and 8-16 × 103 cells were transferred into aged Wt or Foxn1Tg hosts via the retro-orbital route. After 10 weeks, the frequencies of donor CD45.1pos HSC (A) and MPP (B) were determined using flow cytometry. C) The ratios of donor MPP to donor HSC were calculated to determine the efficiency of generating MPP from donor HSC (*p=0.03). Each symbol represents the result obtained from one host. Data are from three separate experiments. Error bars are SD.
The ability of aged HSC from Foxn1Tg and Wt to generate multipotent progenitors in vitro was also determined using BM colony assay in methylcellulose. Compared to young Wt, aged Wt cultures produced fewer GEMM colonies (Fig. 6A *p=0.03); however, no significant reduction was observed in the ability of aged Foxn1Tg to generate GEMM colonies compared to young Foxn1Tg (Fig. 6). The age-associated effect was specific for the multipotent GEMM progenitors because no differences were observed in the number and types of myeloid colonies arising from Wt or Foxn1Tg marrow in either young or old mice (Supplemental Fig. 1B).
Figure 6. Generation of CFU-GEMM from Wt and Foxn1Tg in an in vitro BM colony assay.
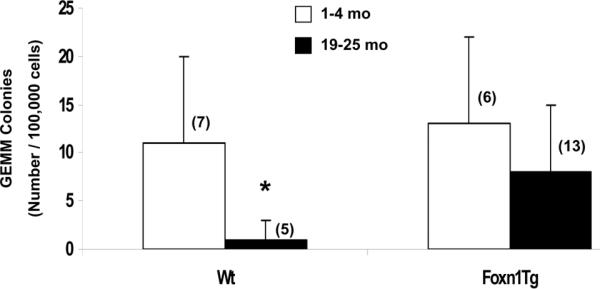
Total BM cells from young (1-4 mo) and age (19-25 mo) Wt and Foxn1Tg were plated in MethoCult GF M3434 methylcellulose (10,000 cells/well, in duplicate) and the number of GEMM colonies generated from HSC were counted after 9 days in culture. Error bars are SD; numbers in parentheses denote the number of animals in each age group. P value are from t-test; *p=0.03, Wt 19=25 mo vs. Wt 1-4 mo.
A novel T cell progenitor, termed “committed T cell progenitor” or “circulating T cell progenitor” (CTP) has been identified as a descendent of HSC (22-24). CTP progress toward mature T cells through the identifiable intermediate stage termed committed intermediate progenitors (CIP), which is coupled to the proliferation of CTP (25, 26); the identification of the two populations in BM cells was shown in supplemental Figure 4A. In mice 2-4 mo, the total number of CTP was not significantly different between Wt and Foxn1Tg; however, Foxn1Tg had a 2.2-fold higher number of CIP (Supplemental Fig. 4B *p<0.001). In 21-25 mo mice, the numbers of CTP and CIP increased in both Wt and Foxn1Tg compared to young (Supplemental Fig. 4B). Aged Wt displayed a greater increase in the number of CTP compared to Foxn1Tg and the CTP number in 21-25 mo Foxn1Tg was 1.8-fold lower than Wt (Supplemental Fig. 4B #p=0.002). The CIP number was not significantly different between aged Wt and Foxn1Tg (Supplemental Fig. 4B). When the ratios of CIP/CTP were calculated, Foxn1Tg displayed higher ratios in both the 2-4 and 21-25 mo groups (Supplemental Fig. 4C ‡p=0.047 young; §p<0.001 aged), suggesting that Foxn1Tg are more efficient in generating CIP from CTP. CTP from both 2-4 and 21-25 mo Foxn1Tg mice showed a higher percentage of CTP in S,G2/M compared to Wt, supporting previous findings that the generation of CIP is coupled to CTP proliferation (Supplemental Fig. 4D *p=0.002, 2-4 mo; #p=0.054, 21-25 mo) (26).
In the adoptive transfer experiments, the frequency of donor CTP was higher but not statistically different in aged Wt than in aged Foxn1Tg hosts. This was also true for the frequency of donor CIP (Supplemental Fig. 4E). However, when the ratios of donor CIP/CTP were measured to determine the efficiency in the development of CIP, aged Foxn1Tg had a higher ratio compared to aged Wt (†p=0.06), suggesting that the aged Foxn1Tg BM microenvironment also is more efficient in promoting the generation of CIP (Supplemental Fig. 4E). Taken together, these data suggested that the BM of Foxn1Tg mice are more efficient in promoting the generation of T cell progenitor MPP and CIP.
Maintenance of MPP homeostasis with age in Foxn1Tg does not prevent the decline in B lineage progenitors
Because ETP are downstream progenies of MPP that also give rise to the common lymphoid progenitor (CLP) in the BM, we asked whether preventing the decline in MPP restores CLPs which are reduced with age in Wt. Flow cytometric gating of CLP is shown in Figure 7A. In Wt, the CLP number decreased 1.9-fold with age, consistent with data previously reported (Fig. 7B *p=0.004) (27, 28). Surprisingly, we found that CLP number in Foxn1Tg was significantly reduced compared to age-matched Wt; further, over-expression of Foxn1, while preventing the decline in MPP, did not prevent the age-associated decline in its progeny CLP (Fig. 7B). Consequently, the number of B lineage cells in the BM was significantly lower in young and aged Foxn1Tg compared to Wt (Fig. 7C). Thus, maintenance of MPP homeostasis with age affects only the numbers of ETP in the thymus but not CLP in the BM.
Figure 7. Changes in the total number of CLP and B lineage cells in Wt and Foxn1Tg with age and expression of Dl4 and Dl1 in Linneg/low EpCAMpos CD138neg BM cells.

BM cells from 1-2 and 21-23 months of age Wt and Foxn1Tg mice were analyzed by flow cytometry to determine the number of CLP and B lineage cells. Total numbers were calculated from the frequencies obtained from flow cytometric analysis and total number of nucleated cells obtained from 2 femurs and 2 tibias. A) Flow cytometry gating of CLP. CLP were defined as Linneg CD127pos CD117low Sca1low Flt3pos. B) Number of CLP in young and aged Wt and Foxn1Tg BM. P values were from t-test; *p=0.004 Wt 21-23 mo vs. Wt 1-2 mo; #p=0.005 Foxn1Tg 1-2 mo vs. Wt 1-2 mo; †p<0.001 Foxn1Tg 21-23 mo vs. Foxn1Tg 1-2 mo; §p<0.001 Foxn1Tg 21-23 mo vs. Wt 21-23 mo. C) B cells were identified as B220 and/or CD19 expressing cells. P values were from t-test; *p<0.007 Wt 17-18 mo vs. Wt 2-3 mo; #p=0.01 Foxn1Tg 2-3 mo vs. Wt 2-3 mo; †p=0.002 Foxn1Tg 17-18 mo vs. Foxn1Tg 2-3 mo; §p=0.004 Foxn1Tg 17-18 mo vs. Wt 17-18 mo. Numbers in parenthesis denotes the number of mice in each age group. Error bars are SD. D) MFI of CD135 (Flt3) on MPP from young and aged Wt and Foxn1Tg mice. The MFI of CD135 was normalized based on MFI of control beads obtained in each experiment. Each symbol represents result from one animal. Statistical significance was determined by two way ANOVA analysis showing significance between Wt and Foxn1Tg (p=0.02). E) Linneg/low EpCAMpos CD138neg BM cells from Foxn1Tg were electronically sorted and total RNA was used to prepare cDNA for RT-PCR. cDNA sample from thymic stroma was used as positive control for Dl1 and Dl4. Primers specific for Hprt were used for quality control of cDNA samples and PCR reactions. Data are representative from 2 independent analyses from two independent sorted samples. Vertical line represents the repositioning of lanes within the same gel.
ETP and CLP both develop from MPP; MPP with the highest expression of CD135 (Flt3) display greatest T lineage potential (29). The mean fluorescent intensity (MFI) of CD135 on MPP from young and aged Wt and Foxn1Tg was measured to begin identifying a potential signaling pathway that would promote ETP development over CLP from MPP. The MFI of CD135 on both young and aged MPP from Foxn1Tg were significantly higher than their Wt counter parts (p = 0.002, ANOVA) (Fig. 7D). The expression of CD135 on MPP from Foxn1Tg varied; however, about half the mice analyzed had a MFI higher than Wt.
Alternatively, skewing toward the T lineage at the expense of the B lineage could be mediated by Notch signaling (30). Thus, we examined whether the Linneg/low EpCAMpos CD138neg BM cells express Notch ligands that are responsible for the commitment to T lineage progenitors. We sorted Linneg/low EpCAMpos CD138neg BM cells from aged Foxn1Tg and found that these cells expressed the Dl4 but not Dl1 Notch ligand (Fig. 7E).
Discussion
Here, we report a novel finding that Foxn1 is expressed in the BM by Linneg/low CD45pos EpCAMpos SCA1pos CD117neg CD138neg MHCIIneg cells. This cell population also expresses Notch ligand Dl4, but not Dl1. Over-expression of Foxn1 prevents the age-associated decline in MPP, partly due to a larger HSC pool, and thus maintains a progenitor pool for ETP. Furthermore, the aged Foxn1Tg BM environment is more efficient in promoting MPP development. Interestingly, the maintenance of MPP homeostasis does not rescue the age-associated decline in CLP and B lineage cells; rather, the Foxn1Tg BM environment alters CLP development, suggesting that the Foxn1Tg BM environment is biased toward T lineage at the expense of B lineage.
Reduced MPP number with age indicates that decline in T lymphopoiesis is initiated in the BM (13). Thus, we would predict that attenuation of a decline in ETP number with age in Foxn1Tg correlates with a larger number of MPP in the BM. While the number of MPP significantly declines with age in Wt mice, their number was not reduced but maintained, even in Foxn1Tg that were 26-35 months old. Our data indicate that preventing cell death in MPP with age is a potential mechanism for the maintenance of homeostasis with age. Alternatively, maintenance of MPP with age is possible through their immediate precursor HSC, which we will address later in this section.
Besides functioning as ETP progenitors, MPP also give rise to myeloid progenitors and CLP progenitors which display potent B lineage potential in the BM. While myeloid lineage development is not affected, both young and aged Foxn1Tg show a reduced CLP number and consequently a lower number of B lineage cells compared to age matched Wt; thus, in contrast to ETP in the thymus, the decline in CLP is not rescued and still occurs with age. Because the number of MPP is not reduced but the generation of CLP is reduced with age, the Foxn1Tg BM environment may limit the development of MPP to CLP thus providing a larger MPP pool as precursors for ETP. We suggest that skewing of T lineage at the expense of B lineage is a contributing factor to the higher number of ETP observed in aged Foxn1Tg thymus compared to Wt (14). This notion is supported by the finding that Foxn1pos BM cells express Dl4, the physiological ligand for Notch in T lymphopoiesis (31). Notch signals through Foxn1pos-expressing Dl4 may prime MPP to differentiate toward the T lineage as well as limit B lineage cell commitment and development in the BM (32, 33). It is also possible that through cell-cell contact, Foxn1pos cells alter the factors required for B lineage commitment and development such as Flt3L and IL7-mediated signals (34-36). Thus, one would expect to observe more donor-derived ETP in the thymus and donor-derived CD3pos in the spleen of the hosts in the adoptive transfer experiments. We found that the frequencies of donor ETP were not significantly different between aged Wt and Foxn1Tg hosts (data not shown). We interpreted this as the Foxn1Tg host thymus express high levels of Foxn1 and this condition correlates with the high frequency of ETP in Foxn1Tg thymus in which ETP frequency was not reduced with age as we have previously shown (14). We observed higher frequencies of donor CD3pos T cells and lower frequencies of B220pos B cells in the spleen, but the differences were not statistically significant (data not shown).
Previous work in Foxn1−/− nude mice suggests that lack of Foxn1 alters the BM microenvironment and hematopoiesis. Zipori et al. demonstrated that nude BM displays a reduction in cellularity and provides limited protection when transferred into a lethally irradiated host (37). Thus, a reduced number of HSC could be responsible for the observed defect. In this context, Foxn1-expressing BM cells could play a potential role in regulating HSC number, seen as a larger established pool of HSC in Foxn1Tg BM. It has been observed that an increase in the numbers of osteoblasts and trabecular bone correlates with a higher number of HSC (38, 39); however, we observed no such differences between Foxn1Tg and Wt (data not shown). Alternatively, the size of HSC pool is regulated during the transition from the highly proliferative fetal HSC to the slowly proliferating adult phenotype by reduced expression of sry-related high mobility group box 17 (sox17) (40). It remains to be determined if over-expression of Foxn1 affects the duration of Sox17 expression in HSC, leading to a larger HSC pool in Foxn1Tg BM. It is estimated that a single long-term repopulating HSC can only replicate 5 times in the mouse life span to maintain hematopoiesis before exhaustion (41). Thus, with a larger HSC pool, hematopoiesis would be prolonged because it would take longer to induce replicative exhaustion associated with aging.
HSC numbers can also be regulated by controlling HSC self-renewal (42). In E3 ligase Itch deficient mice, HSC display increased cell cycling, resulting in increased HSC and MPP number (43). It is possible that with age, Foxn1Tg BM negatively affects Itch expression or activity within HSC, leading to HSC proliferation and a larger number of HSC and MPP. Whether expression of Itch E3 ligase increases with age is unknown.
In agreement with others, the number of HSC in Wt BM increases in 20-21 months old mice as compared to 1-4 months (44, 45). It has been suggested that this increase in HSC with age is either due to a block in the differentiation of HSC or a compensatory mechanism for the inefficiency in lymphoid lineage development with age and not by an increase in cell cycling with age (13, 45-47). We found that with advanced age in Wt (24 -25 mo), the initial increase is followed by a dramatic reduction in HSC number that is coupled with increased cell death. If the increase in HSC is in fact a compensatory mechanism to increase the number of lymphoid lineage cells derived from HSC, then the drastic decline in Wt 24 months of age and older may result from HSC replicative exhaustion. The decline in the ability of aged Wt HSC to generate CFU-GEMM corroborates the idea that compensatory responses in aged HSC lead to their depletion with age. Because the HSC number is reduced only to levels equivalent to that found in young Foxn1Tg, we suggest that the HSC pool in aged Foxn1Tg BM are rescued from replicative exhaustion.
Increase in cell cycling also may be possible through regulation of cyclin-dependent kinase inhibitor p16INK4a which controls the G1 check point. The cyclin inhibitor p16INK4a is expressed in aged but not young HSC; it was found that aged p16INK4a −/− mice have an increase in the number of HSC due to increased cell cycling and decreased cell death (48). It is possible that HSC within the Foxn1pos niches of the BM environment are affected such that the age-associated increase in p16INK4a expression is abrogated, resulting in proliferation of HSC in responding to stress with advanced age. We propose that the increase in cell cycling, reduced cell death and intact function culminates in preventing replicative exhaustion and restoring HSC homeostasis with age in Foxn1Tg BM.
While we could not rule out that the maintenance of HSC and MPP number in the BM of Foxn1Tg mice is the result of a feedback loop from the thymus to the BM, the presence of Foxn1-expressing cells in BM could provide a direct functional basis for the observed changes in HSC and MPP and T lineage commitment within the BM. Foxn1pos cells are located within the central marrow and are either immediately adjacent to or within an estimated 3-cell length distance to sinusoids, but are rarely found adjacent to trabecular bone. Thus, they appear associated with sinusoidal or vascular niches rather than the endosteal niche. The short-term, proliferating HSC reside within the vascular niche and readily differentiate into MPP (18). Based on the location of Foxn1pos cells, we speculate that the Foxn1pos cells are vascular niche cells that affect proliferation of HSC and contribute to the maintenance and prevention of the decline of MPP with age.
The finding that Foxn1 is expressed in Wt Linneg EpCAMpos CD138neg BM cells supports the notion that expression of the Foxn1Tg is not ectopic. Approximately 68% of the Linneg/low EpCAMpos CD138neg cells express Foxn1 in aged Foxn1Tg BM and 45% BM cells with identical phenotype isolated from aged Wt BM are also stained positive for Foxn1(Fig. 4B and data not shown). Because the Linneg EpCAMpos CD138neg population isolated from Foxn1cre-Rosa26-lacZ mice expresses bacterial β-galactosidase, we conclude that these cells are the bona fide Foxn1-expressing cells in the BM. While plasma cells also express EpCAM, it is unlikely that the Foxn1pos cells are plasma cells because the majority of the Foxn1pos cells are CD138neg; furthermore, these Foxn1pos cells also express keratin 14, suggesting epithelium in nature.
We reason that the identification of Foxn1pos BM cells together with the maintenance of homeostasis of MPP with age provide the first evidence to suggest that Foxn1 plays a critical role in the maintenance of hematopoiesis and particularly T lineage within the BM niche with age. This notion is supported by data from the adoptive transfer experiments showing that the generation of MPP and of CIP from donor HSC is higher in aged Foxn1Tg compared to aged Wt hosts. While we planned to use VEX expression as a measurement of Rag expression and activity in donor cells homed to the BM, we could not detect VEXpos cells in the LSK and MPP populations perhaps due to a low level of expression of VEX. These findings suggest that the cells within the BM that are responsible for the generation of MPP and CIP and reinforce the notion that the increase in generation of MPP and CIP in aged Foxn1Tg mice is mediated by the Foxn1-expressing cells within the BM niches; therefore, providing the rationale for future studies to establish the precise causative effect of Foxn1-expressing cells within the BM microenvironment.
Supplementary Material
Acknowledgements
We would like to thank Pat Simms for her technical skills in cell sorting, Dr. Jiwang Zhang and Mary Kay Olsen for their help with the histology studies as well as Dr. Dixit for Foxn1cre-Rosa26-LacZ BM. We would also like to thank Dr. Bhandoola (University of Pennsylvania) for his insightful suggestions.
Abbreviations
- BM
Bone marrow
- CLP
Common lymphoid progenitors
- CTP
Committed T cell progenitors / circulating T cell progenitor
- CIP
Committed intermediate T cell progenitor
- Dl
Delta-like
- ETP
Early T cell progenitors
- Foxn1
Forkhead box n1
- Flt3L
Fms-like tyrosine kinase 3 ligand
- HSC
Hematopoietic stem cells
- K14
Keratin 14
- MPP
Multipotent progenitors
- MFI
Mean fluorescent intensity
- Mo
Month
- TEC
Thymic epithelial cells
- Tg
Transgenic mice
- Wt
Wild type mice
Footnotes
Authorship: E.C.Z. and P.T.L designed experiments and wrote paper. P.L.W. and R.G. contributed to experimental design. E.C.Z. and S.Z. performed research and analyzed data.
This work is supported by NIH R01 AG32809 (PL), R01 AG013874 (PW), T32 AI007508 (EZ), T32 AG031780 (EZ) and an intramural pilot project grant from Loyola University Stritch School of Medicine (PL).
Conflict of interest: Authors declare no conflicts of interest.
References
- 1.Bleul CC, Corbeaux T, Reuter A, Fisch P, Monting JS, Boehm T. Formation of a functional thymus initiated by a postnatal epithelial progenitor cell. Nature. 2006;441:992–996. doi: 10.1038/nature04850. [DOI] [PubMed] [Google Scholar]
- 2.Nehls M, Pfeifer D, Schorpp M, Hedrich H, Boehm T. New member of the winged-helix protein family disrupted in mouse and rat nude mutations. Nature. 1994;372:103–107. doi: 10.1038/372103a0. [DOI] [PubMed] [Google Scholar]
- 3.Ortman CL, Dittmar KA, Witte PL, Le PT. Molecular characterization of the mouse involuted thymus: aberrations in expression of transcription regulators in thymocyte and epithelial compartments. Int. Immunol. 2002;14:813–822. doi: 10.1093/intimm/dxf042. [DOI] [PubMed] [Google Scholar]
- 4.Cheng L, Guo J, Sun L, Fu J, Barnes PF, Metzger D, Chambon P, Oshima RG, Amagai T, Su DM. Postnatal tissue-specific disruption of transcription factor FoxN1 triggers acute thymic atrophy. J. Biol. Chem. 2010;285:5836–5847. doi: 10.1074/jbc.M109.072124. [DOI] [PMC free article] [PubMed] [Google Scholar]
- 5.Chen L, Xiao S, Manley NR. Foxn1 is required to maintain the postnatal thymic microenvironment in a dosage-sensitive manner. Blood. 2009;113:567–574. doi: 10.1182/blood-2008-05-156265. [DOI] [PMC free article] [PubMed] [Google Scholar]
- 6.Allman D, Sambandam A, Kim S, Miller JP, Pagan A, Well D, Meraz A, Bhandoola A. Thymopoiesis independent of common lymphoid progenitors. Nat. Immunol. 2003;4:168–174. doi: 10.1038/ni878. [DOI] [PubMed] [Google Scholar]
- 7.Porritt HE, Rumfelt LL, Tabrizifard S, Schmitt TM, Zuniga-Pflucker JC, Petrie HT. Heterogeneity among DN1 prothymocytes reveals multiple progenitors with different capacities to generate T cell and non-T cell lineages. Immunity. 2004;20:735–745. doi: 10.1016/j.immuni.2004.05.004. [DOI] [PubMed] [Google Scholar]
- 8.Min H, Montecino-Rodriguez E, Dorshkind K. Reduction in the developmental potential of intrathymic T cell progenitors with age. J. Immunol. 2004;173:245–250. doi: 10.4049/jimmunol.173.1.245. [DOI] [PubMed] [Google Scholar]
- 9.Scollay R, Smith J, Stauffer V. Dynamics of early T cells: prothymocyte migration and proliferation in the adult mouse thymus. Immunol. Rev. 1986;91:129–157. doi: 10.1111/j.1600-065x.1986.tb01487.x. [DOI] [PubMed] [Google Scholar]
- 10.Donskoy E, Goldschneider I. Thymocytopoiesis is maintained by blood-borne precursors throughout postnatal life. A study in parabiotic mice. J. Immunol. 1992;148:1604–1612. [PubMed] [Google Scholar]
- 11.Sambandam A, Maillard I, Zediak VP, Xu L, Gerstein RM, Aster JC, Pear WS, Bhandoola A. Notch signaling controls the generation and differentiation of early T lineage progenitors. Nat. Immunol. 2005;6:663–670. doi: 10.1038/ni1216. [DOI] [PubMed] [Google Scholar]
- 12.Benz C, Bleul CC. A multipotent precursor in the thymus maps to the branching point of the T versus B lineage decision. J. Exp. Med. 2005;202:21–31. doi: 10.1084/jem.20050146. [DOI] [PMC free article] [PubMed] [Google Scholar]
- 13.Zediak VP, Maillard I, Bhandoola A. Multiple prethymic defects underlie age- related loss of T progenitor competence. Blood. 2007;110:1161–1167. doi: 10.1182/blood-2007-01-071605. [DOI] [PMC free article] [PubMed] [Google Scholar]
- 14.Zook EC, Krishack PA, Zhang S, Zeleznik-Le NJ, Firulli AB, Witte PL, Le PT. Overexpression of Foxn1 attenuates age-associated thymic involution and prevents the expansion of peripheral CD4 memory T cells. Blood. 2011;118:5723–5731. doi: 10.1182/blood-2011-03-342097. [DOI] [PMC free article] [PubMed] [Google Scholar]
- 15.Youm YH, Yang H, Sun Y, Smith RG, Manley NR, Vandanmagsar B, Dixit VD. Deficient ghrelin receptor-mediated signaling compromises thymic stromal cell microenvironment by accelerating thymic adiposity. J. Biol. Chem. 2009;284:7068–7077. doi: 10.1074/jbc.M808302200. [DOI] [PMC free article] [PubMed] [Google Scholar]
- 16.Borghesi L, Hsu LY, Miller JP, Anderson M, Herzenberg L, Herzenberg L, Schlissel MS, Allman D, Gerstein RM. B lineage-specific regulation of V(D)J recombinase activity is established in common lymphoid progenitors. J. Exp. Med. 2004;199:491–502. doi: 10.1084/jem.20031800. [DOI] [PMC free article] [PubMed] [Google Scholar]
- 17.Johnson KM, Owen K, Witte PL. Aging and developmental transitions in the B cell lineage. Int. Immunol. 2002;14:1313–1323. doi: 10.1093/intimm/dxf092. [DOI] [PubMed] [Google Scholar]
- 18.Kiel MJ, Yilmaz OH, Iwashita T, Yilmaz OH, Terhorst C, Morrison SJ. SLAM family receptors distinguish hematopoietic stem and progenitor cells and reveal endothelial niches for stem cells. Cell. 2005;121:1109–1121. doi: 10.1016/j.cell.2005.05.026. [DOI] [PubMed] [Google Scholar]
- 19.Farr A, Nelson A, Truex J, Hosier S. Epithelial heterogeneity in the murine thymus: a cell surface glycoprotein expressed by subcapsular and medullary epithelium. J. Histochem. Cytochem. 1991;39:645–653. doi: 10.1177/39.5.2016514. [DOI] [PubMed] [Google Scholar]
- 20.Bergsagel PL, Victor-Kobrin C, Timblin CR, Trepel J, Kuehl WM. A murine cDNA encodes a pan-epithelial glycoprotein that is also expressed on plasma cells. J. Immunol. 1992;148:590–596. [PubMed] [Google Scholar]
- 21.Bell JJ, Bhandoola A. The earliest thymic progenitors for T cells possess myeloid lineage potential. Nature. 2008;452:764–767. doi: 10.1038/nature06840. [DOI] [PubMed] [Google Scholar]
- 22.Dejbakhsh-Jones S, Jerabek L, Weissman IL, Strober S. Extrathymic maturation of alpha beta T cells from hemopoietic stem cells. J. Immunol. 1995;155:3338–3344. [PubMed] [Google Scholar]
- 23.Dejbakhsh-Jones S, Strober S. Identification of an early T cell progenitor for a pathway of T cell maturation in the bone marrow. Proc. Natl. Acad. Sci. U. S. A. 1999;96:14493–14498. doi: 10.1073/pnas.96.25.14493. [DOI] [PMC free article] [PubMed] [Google Scholar]
- 24.Krueger A, von Boehmer H. Identification of a T lineage-committed progenitor in adult blood. Immunity. 2007;26:105–116. doi: 10.1016/j.immuni.2006.12.004. [DOI] [PMC free article] [PubMed] [Google Scholar]
- 25.Dejbakhsh-Jones S, Garcia-Ojeda ME, Chatterjea-Matthes D, Zeng D, Strober S. Clonable progenitors committed to the T lymphocyte lineage in the mouse bone marrow; use of an extrathymic pathway. Proc. Natl. Acad. Sci. U. S. A. 2001;98:7455–7460. doi: 10.1073/pnas.131559798. [DOI] [PMC free article] [PubMed] [Google Scholar]
- 26.Chatterjea-Matthes D, Garcia-Ojeda ME, Dejbakhsh-Jones S, Jerabek L, Manz MG, Weissman IL, Strober S. Early defect prethymic in bone marrow T cell progenitors in athymic nu/nu mice. J. Immunol. 2003;171:1207–1215. doi: 10.4049/jimmunol.171.3.1207. [DOI] [PubMed] [Google Scholar]
- 27.Miller JP, Allman D. The decline in B lymphopoiesis in aged mice reflects loss of very early B-lineage precursors. J. Immunol. 2003;171:2326–2330. doi: 10.4049/jimmunol.171.5.2326. [DOI] [PubMed] [Google Scholar]
- 28.Min H, Montecino-Rodriguez E, Dorshkind K. Effects of aging on the common lymphoid progenitor to pro-B cell transition. J. Immunol. 2006;176:1007–1012. doi: 10.4049/jimmunol.176.2.1007. [DOI] [PubMed] [Google Scholar]
- 29.Adolfsson J, Mansson R, Buza-Vidas N, Hultquist A, Liuba K, Jensen CT, Bryder D, Yang L, Borge OJ, Thoren LA, Anderson K, Sitnicka E, Sasaki Y, Sigvardsson M, Jacobsen SE. Identification of Flt3+ lympho-myeloid stem cells lacking erythro megakaryocytic potential a revised road map for adult blood lineage commitment. Cell. 2005;121:295–306. doi: 10.1016/j.cell.2005.02.013. [DOI] [PubMed] [Google Scholar]
- 30.Schmitt TM, Ciofani M, Petrie HT, Zuniga-Pflucker JC. Maintenance of T cell specification and differentiation requires recurrent notch receptor-ligand interactions. J. Exp. Med. 2004;200:469–479. doi: 10.1084/jem.20040394. [DOI] [PMC free article] [PubMed] [Google Scholar]
- 31.Koch U, Fiorini E, Benedito R, Besseyrias V, Schuster-Gossler K, Pierres M, Manley NR, Duarte A, Macdonald HR, Radtke F. Delta-like 4 is the essential, nonredundant ligand for Notch1 during thymic T cell lineage commitment. J. Exp. Med. 2008;205:2515–2523. doi: 10.1084/jem.20080829. [DOI] [PMC free article] [PubMed] [Google Scholar]
- 32.Sato T, Sato C, Suzuki D, Yoshida Y, Nunomura S, Matsumura T, Hozumi K, Habu S. Surface molecules essential for positive selection are retained but interfered in thymic epithelial cells after monolayer culture. Cell. Immunol. 2001;211:71–79. doi: 10.1006/cimm.2001.1823. [DOI] [PubMed] [Google Scholar]
- 33.Mohtashami M, Zuniga-Pflucker JC. Three-dimensional architecture of the thymus is required to maintain delta-like expression necessary for inducing T cell development. J. Immunol. 2006;176:730–734. doi: 10.4049/jimmunol.176.2.730. [DOI] [PubMed] [Google Scholar]
- 34.Mackarehtschian K, Hardin JD, Moore KA, Boast S, Goff SP, Lemischka IR. Targeted disruption of the flk2/flt3 gene leads to deficiencies in primitive hematopoietic progenitors. Immunity. 1995;3:147–161. doi: 10.1016/1074-7613(95)90167-1. [DOI] [PubMed] [Google Scholar]
- 35.McKenna HJ, Stocking KL, Miller RE, Brasel K, De Smedt T, Maraskovsky E, Maliszewski CR, Lynch DH, Smith J, Pulendran B, Roux ER, Teepe M, Lyman SD, Peschon JJ. Mice lacking flt3 ligand have deficient hematopoiesis affecting hematopoietic progenitor cells, dendritic cells, and natural killer cells. Blood. 2000;95:3489–3497. [PubMed] [Google Scholar]
- 36.Sitnicka E, Bryder D, Theilgaard-Monch K, Buza-Vidas N, Adolfsson J, Jacobsen SE. Key role of flt3 ligand in regulation of the common lymphoid progenitor but not in maintenance of the hematopoietic stem cell pool. Immunity. 2002;17:463–472. doi: 10.1016/s1074-7613(02)00419-3. [DOI] [PubMed] [Google Scholar]
- 37.Zipori D, Trainin N. Defective capacity of bone marrow from nude mice to restore lethally irradiated recipients. Blood. 1973;42:671–678. [PubMed] [Google Scholar]
- 38.Calvi LM, Adams GB, Weibrecht KW, Weber JM, Olson DP, Knight MC, Martin RP, Schipani E, Divieti P, Bringhurst FR, Milner LA, Kronenberg HM, Scadden DT. Osteoblastic cells regulate the haematopoietic stem cell niche. Nature. 2003;425:841–846. doi: 10.1038/nature02040. [DOI] [PubMed] [Google Scholar]
- 39.Zhang J, Niu C, Ye L, Huang H, He X, Tong WG, Ross J, Haug J, Johnson T, Feng JQ, Harris S, Wiedemann LM, Mishina Y, Li L. Identification of the haematopoietic stem cell niche and control of the niche size. Nature. 2003;425:836–841. doi: 10.1038/nature02041. [DOI] [PubMed] [Google Scholar]
- 40.Kim I, Saunders TL, Morrison SJ. Sox17 dependence distinguishes the transcriptional regulation of fetal from adult hematopoietic stem cells. Cell. 2007;130:470–483. doi: 10.1016/j.cell.2007.06.011. [DOI] [PMC free article] [PubMed] [Google Scholar]
- 41.Wilson A, Laurenti E, Oser G, van der Wath RC, Blanco-Bose W, Jaworski M, Offner S, Dunant CF, Eshkind L, Bockamp E, Lio P, Macdonald HR, Trumpp A. Hematopoietic stem cells reversibly switch from dormancy to self-renewal during homeostasis and repair. Cell. 2008;135:1118–1129. doi: 10.1016/j.cell.2008.10.048. [DOI] [PubMed] [Google Scholar]
- 42.Zediak VP, Bhandoola A. Aging and T cell development: interplay between progenitors and their environment. Semin. Immunol. 2005;17:337–346. doi: 10.1016/j.smim.2005.05.004. [DOI] [PubMed] [Google Scholar]
- 43.Rathinam C, Matesic LE, Flavell RA. The E3 ligase Itch is a negative regulator of the homeostasis and function of hematopoietic stem cells. Nat. Immunol. 2011;12:399–407. doi: 10.1038/ni.2021. [DOI] [PMC free article] [PubMed] [Google Scholar]
- 44.Morrison SJ, Wandycz AM, Akashi K, Globerson A, Weissman IL. The aging of hematopoietic stem cells. Nat. Med. 1996;2:1011–1016. doi: 10.1038/nm0996-1011. [DOI] [PubMed] [Google Scholar]
- 45.Sudo K, Ema H, Morita Y, Nakauchi H. Age-associated characteristics of murine hematopoietic stem cells. J. Exp. Med. 2000;192:1273–1280. doi: 10.1084/jem.192.9.1273. [DOI] [PMC free article] [PubMed] [Google Scholar]
- 46.Pearce DJ, Anjos-Afonso F, Ridler CM, Eddaoudi A, Bonnet D. Age-dependent increase in side population distribution within hematopoiesis: implications for our understanding of the mechanism of aging. Stem Cells. 2007;25:828–835. doi: 10.1634/stemcells.2006-0405. [DOI] [PubMed] [Google Scholar]
- 47.Rossi DJ, Seita J, Czechowicz A, Bhattacharya D, Bryder D, Weissman IL. Hematopoietic stem cell quiescence attenuates DNA damage response and permits DNA damage accumulation during aging. Cell. Cycle. 2007;6:2371–2376. doi: 10.4161/cc.6.19.4759. [DOI] [PubMed] [Google Scholar]
- 48.Janzen V, Forkert R, Fleming HE, Saito Y, Waring MT, Dombkowski DM, Cheng T, DePinho RA, Sharpless NE, Scadden DT. Stem-cell ageing modified by the cyclin-dependent kinase inhibitor p16INK4a. Nature. 2006;443:421–426. doi: 10.1038/nature05159. [DOI] [PubMed] [Google Scholar]
Associated Data
This section collects any data citations, data availability statements, or supplementary materials included in this article.