

Summary
Background
Nephrotoxic medication-associated acute kidney injury (NTMx-AKI) is a costly clinical phenomenon and more common than previously recognized. Prior efforts to use technology to identify AKI have focused on detection after renal injury has occurred.
Objectives
Describe an approach and provide a technical framework for the creation of risk-stratifying AKI triggers and the development of an application to manage the AKI trigger data. Report the performance characteristics of those triggers and the refinement process and on the challenges of implementation.
Methods
Initial manual trigger screening guided design of an automated electronic trigger report. A web-based application was designed to alleviate inefficiency and serve as a user interface and central workspace for the project. Performance of the NTMx exposure trigger reports from September 2011 to September 2013 were evaluated using sensitivity (SN), specificity (SP), positive and negative predictive values (PPV, NPV).
Results
Automated reports were created to replace manual screening for NTMx-AKI. The initial performance of the NTMx exposure triggers for SN, SP, PPV, and NPV all were ≥0.78, and increased over the study, with all four measures reaching ≥0.95 consistently. A web-based application was implemented that simplifies data entry and couriering from the reports, expedites results viewing, and interfaces with an automated data visualization tool. Sociotechnical challenges were logged and reported.
Conclusion
We have built a risk-stratifying system based on electronic triggers that detects patients at-risk for NTMx-AKI before injury occurs. The performance of the NTMx-exposed reports has neared 100% through iterative optimization. The complexity of the trigger logic and clinical workflows surrounding NTMx-AKI led to a challenging implementation, but one that has been successful from technical, clinical, and quality improvement standpoints. This report summarizes the construction of a trigger-based application, the performance of the triggers, and the challenges uncovered during the design, build, and implementation of the system.
Keywords: Electronic health record, electronic medical record, patient safety, acute kidney injury, clinical decision support systems
1. Background
Pediatric acute kidney injury (AKI) is a very common phenomenon amongst hospitalized children who are exposed to nephrotoxic medications (NTMx) [1]. Research in the last decade has demonstrated that this form of renal insult occurs at rates far higher than previously recognized and that care providers are not systematically monitoring for the occurrence of AKI [2, 3]. Serum creatinine (SCr), one of the most common and inexpensive laboratory tests to assess kidney function, is ubiquitously available, yet care providers of children who receive NTMx only check SCr tests once every four days about 50–60% of the time [3]. Given that SCr monitoring is sporadic, the true incidence of pediatric nephrotoxic medication-associated AKI (NTMx-AKI) has, until recently, been unknown. Retrospective analysis has shown NTMx-AKI rates to be 20–31%, but this rate may be an underestimation of the true rate since the calculation relies on the presence of SCr values in the medical record [3].
We recently reported the initial one-year results from our electronic health record (EHR) quality improvement project which used a prospective “trigger” from the EHR to identify children at-risk for NTMx-AKI [4]. A trigger is a piece of data or element from the medical record that serves as a potential proxy to (or signal of) an underlying event of interest. Most often, that event reflects iatrogenic harm that has already occurred. Triggers serve as a flag to aid chart reviewers in efficient identification of adverse events (AEs) [5, 6]. Electronic or “automated” triggers can be used to survey entire patient populations for AEs in an efficient manner using computational techniques. In addition, automated triggers expedite AE discovery, with real or near real-time detection capabilities [7-10]. In comparison to manual triggers, automated triggers can occur in a timely enough fashion to act as input to patient safety or quality improvement teams to mitigate harm.
To date, the literature on AKI triggers has been largely limited to the retrospective evaluation of harm after it has occurred, or to the reactive modification of treatment regimens in response to failing renal function after an injury has occurred [11-14]. A risk-stratification model for AKI pre-insult has been developed in adults. This model is not easily translated to a pediatric population because predisposing factors differ epidemiologically between adults and children [15]. A recent retrospective study identified that the risk of AKI doubled in pediatric patients receiving either three or more NTMx simultaneously or an intravenous aminoglycoside for 3 days or longer (►Table 1). We developed an automated trigger report that sent information to rounding pharmacists, who then recommended modifications to medication regimens and frequent screening for AKI. Our report found a 25.5% AKI rate in NTMx-exposed children [4].
Table 1.
Catalog of AKI Triggers and the Associated Trigger Query Logic. Exposure and injury trigger descriptions with clinical criteria and trigger logic.
| Trigger Name | Clinical Criteria | Trigger Logic |
|---|---|---|
| Exposure Triggers | ||
| ≥3 NTMx | Patients received 3 or more nephrotoxins (NTMx) on the same calendar daya | Unique Medical Record Number (MRN) AND located in an inpatient unit AND at least 3 NTMx with a status of “given” on the MAR AND same calendar daya |
| IV AG ≥3 days | Patient received intravenous (IV) aminoglycoside (AG) for 3 or more days in a row | Unique Medical Record Number (MRN) AND located in an inpatient unit AND IV AG on the MAR as “given” AND for 3 sequential days |
| Injury Triggers | ||
| pRIFLE criteria | Patient’s SCr increased by ≥50% above baselineb; Risk, R; 50–99% above baseline Risk I; 100–199% above baseline Risk F; ≥200% above baseline Risk L, E; not applicable, chronic disease-based |
Unique Medical Record Number (MRN) AND has a SCr lab value on the prior day AND current SCr value >1.5b baseline any SCr value from prior 6 months; If current SCr = 50–99% increase, risk strata = R OR If current SCr = 100–199% increase, risk strata = I OR If current SCr = ≥200 increase, risk strata = F |
| ≥0.3mg/dL increase SCr in 48 hrs | Patient’s SCr increased by at least 0.3 mg/dL within a 48 hour window | Unique Medical Record Number (MRN) AND has a SCr lab value on the prior day AND current SCr value ≥0.3 mg/dL increase SCr over any SCr value from prior 2 days |
a IV radiology contrast, cidofovir, amphotericin B were also counted for that day if administered within the past 7 days
b Patient’s newest SCr value that is compared to baseline must have a minimum value ≥0.5mg/dL to avoid false positives from normal physiologic and lab variations
2. Objectives
The aim of the current report is to describe the development and refinement processes associated with the novel electronic triggers used to drive that work. Specifically, we aim to:
describe our approach and provide a technical framework for the creation of predictive AKI triggers, as well as the development of a web-based application to efficiently manage the AKI trigger data,
report the performance characteristics of those triggers during our project and the refinement process and
describe the challenges in implementation.
3. Methods
3.1 Setting
Cincinnati Children’s Hospital Medical Center (CCHMC) is a 587 bed quaternary pediatric institution with a well-established research and patient safety agenda. The NTMx-AKI reduction project was initiated on June 1, 2011 as a collaborative effort between the CCHMC Center for Acute Care Nephrology, the James M. Anderson Center for Health Systems Excellence the Division of Pharmacy Services, and the CCHMC Department of Information Services (IS). The automated AKI electronic triggers program was launched September 17, 2011. Details and initial data from the manual screening process prior to the implementation of the AKI electronic triggers program have been previously reported [4]. The current paper focuses on the study period after the implementation of the automated electronic triggers (9/17/2011-9/31/2013). Prior to implementation of automated triggers, pharmacists manually screened for AKI by reviewing clinical patient lists and data from the EHR (6/1/2011-9/16/2011).
CCHMC implemented the EpicCare Inpatient Electronic Health Record (EHR) system™ (Epic Systems, Verona, WI) in January 2010. Almost all inpatient orders (>97%) are entered through computerized prescriber order entry and documentation is electronic. CCHMC’s EHR instance includes a robust reporting database, which is heavily utilized in the institution. All clinical data arise from and/or is stored in Epic-related databases with the exception of laboratory data, which is managed by a Cerner Millennium™ instance (Cerner Corp, North Kansas City, MO). The CCHMC Institutional Review Board approved the study with a waiver of informed consent.
3.2 Summary of the Screening Algorithm and Trigger Process
For the first 3.5 months of the project, clinical pharmacists used a priori screening criteria to identify inpatient, non-critically ill patients exposed to NTMx that were at risk for developing AKI. A patient was deemed at risk for NTMx-AKI if they met any of the evidence-based clinical criteria for an exposure trigger (►Table 1) and as described in our previous paper [4]. Pharmacists were trained regarding the standardized criteria and were asked to review their assigned patients’ medication lists for forty-five known NTMx (►Table 2) [2].
Table 2.
List of Nephrotoxic Medications (NTMx) screened. Forty-five medications were used in the exposure queries.
| Acyclovir | Enalaprilat | Mesalamine |
| Ambisome | Foscarnet | Methotrexate |
| Amikacin | *Gadopentetate dimeglumine | Nafcillin |
| Amphotericin B | *Gadoxetate disodium | Piperacillin/tazobactam |
| Captopril | Ganciclovir | Piperacillin |
| Carboplatin | Gentamicin | Sirolimus |
| Cefotaxime | Ibuprofen | Sulfasalazine |
| Ceftazidime | Ifosfamide | Tacrolimus |
| Cefuroxime | *Iodixanol | Ticarcillin/clavulanic acid |
| Cidofovir | *Iohexol | Tobramycin |
| Cisplatin | *Iopamidol | Topiramate |
| Colistimethate | *Ioversol | Valacyclovir |
| Cyclosporine | Ketorolac | Valganciclovir |
| Dapsone | Lisinopril | Vancomycin |
| Enalapril | Lithium | Zonisamide |
*radiologic contrast agents
If a patient met exposure criteria, the pharmacist would add the patient to a shared Microsoft-based Excel™ file (Microsoft Corporation, Redmond, WA). At the end of the week, a senior pharmacist would perform a central review of the file and after validation, would send the file to a data analyst for further processing and addition to a registry. The data analyst would manually lookup serum creatinine (SCr) values for the exposed patients in the EHR and determine if there was evidence of AKI defined by both relative and absolute increase criteria (►Table 1, Injury Triggers).
Operationally-defined outcome measures including exposure and prevalence rates were then calculated from the exposed and injury data.
3.3 Conversion of Screening from Manual to Electronic Triggers
Due to the complexity of the manual screening trigger logic, the distributive workflows of clinical pharmacy, and the high number of NTMx that were needed to be tracked, an electronic AKI trigger catalog was developed in parallel with the launch of the manual triggers (►Table 1). The manual screening process informed the design of the electronic triggers (►supplemental technical manual). Development of the exposure trigger reports required roughly 830 hours of analyst time. Once built, the electronic trigger reports were delivered to the pharmacists through a daily email embedded with URL links. The exposure trigger reports were generated in near real-time, on the previous day’s data. The data in the reports was generally as current as 12–36 hours by the time the pharmacists reviewed the reports. They used the exposure trigger report data as a starting point for the generation of the weekly exposed patient lists, as opposed to creating the lists from manual scanning of their clinical work list.
We compared the trigger tool’s performance to the gold standard of pharmacists manually reviewing each patient’s medication list each day to determine the test characteristics (sensitivity, specificity, negative and positive predictive values). Each daily instance of exposure trigger firing was validated by the pharmacists as either a true positive (TP) if correct or false positive (FP) if incorrect. The pharmacists would manually add patients each day if they were not detected by the triggers (false negatives; FN). True negatives (TN) were calculated by determining the number of non-critical care patient days and subtracting the number of TPs, FPs, and FNs. The exposure triggers were evaluated for performance by measures of sensitivity, specificity, positive and negative predictive values.
The performance data was used to inform query logic optimization efforts and the effects of those changes on performance were monitored over time. Injury triggers were not formally evaluated as they were found to be highly accurate (>99%) since they were based on simple calculations of SCr changes over time.
3.4 Web-based Application Development
Inefficient workflows were identified after the electronic triggers and reports were built including:
batching of data couriering and delays due to data silos,
redundancy of work efforts by pharmacists and the data analyst working in parallel,
manual lookup of patient SCr data, and
excess time expenditures required by the data analyst to create ad hoc run charts and graphs to communicate the results of the project to stakeholders.
A web-based application was designed to address these issues and serve as a user interface and central workspace for the AKI project. Development of the web-based application and further optimization of the trigger reports required roughly 1430 hours of analyst time.
The design of the application took into account the time constraints and definitions of our measures. For example, patients are followed and maintained in our AKI registry for 2–5 days after NTMx-exposure discontinuation. Prior to the application, the data analysts kept track of these patients manually, “closing out” the patient when they no longer met the exposure criteria. Development of the application required methods for keeping the patients “open” and visible in the registry until the analyst closed them out. Similarly, we had to provide input fields for the data analyst to enter the external patient census data so that the application could calculate our metrics that were dependent on this information.
4. Results
The pharmacists initiated collection of the exposure data in a manual fashion. The electronic exposure and injury triggers were then built using the logic as shown in ►Table 1. The report generation process and data flow is shown in ►Figure 1. Data was acquired from multiple sources. Lab (SCr) and demographic/ADT (Admission, Discharge, Transfer) data was retrieved from CCHMC maintained databases populated in real-time by HL7 interfaces, while medication administration data was retrieved from Epic’s Clarity™ system, populated daily by an ETL (Extract, Transform, Load) process. A custom snapshot was stored in the trigger database allowing validation and review. The trigger reports (generated in ►Figure 1) were incorporated as the basis and starting point of the user workflow as shown in ►Figure 2. The output of the workflow was an AKI registry, from which our metrics and visualizations were produced.
Fig. 1.
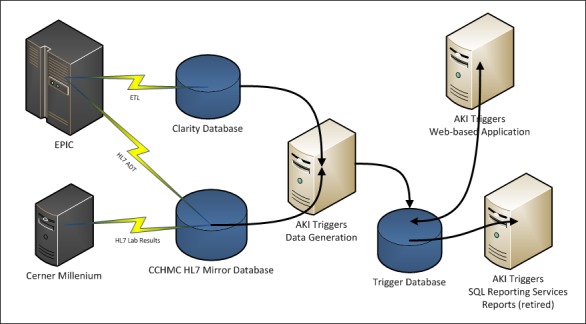
AKI Trigger Report Generation Process & Data Flow: Data flow diagram, starting with the EHR system (Epic™) and lab system (Cerner™) sources. This clinical data is then extracted, transformed, and loaded (ETL) or messaged via HL7 protocols to our research databases. The automated AKI triggers are then executed on the aggregated data, with query results stored in a standalone trigger database. The query results can then be accessed via SQL reporting services or through the AKI triggers web-based application described in this paper (ADT = Admit, Discharge, Transfer; AKI = Acute Kidney Injury; ETL = Extract, Transform, Load; HL7 = Health Level 7; CCHMC = Cincinnati Children’s Hospital Medical Center).
Fig. 2.

AKI Trigger Data Socio-Technical Workflow: Representation of the trigger report data flow. The daily AKI Trigger report generation is shown on the left of the figure, while the creation of the registry and reporting to stakeholders is on the right of the figure. The upper arm represents the pharmacists (green figures) interacting with the reports while the lower arm represents the data analyst’s interactions (NTMx = Nephrotoxic Medication, TP = True Positive, FP = False Positive, FN = False Negative, TN = True Negative, SCr = Serum Creatinine, EHR = Electronic Health Record, AKI = Acute Kidney Injury).
4.1 Performance of the Exposed Triggers
The descriptive statistics and calculated performance measures for the exposed triggers are shown in ►Table 3 and graphically in ►Figure 3. Specificity and negative predictive value of the exposed triggers were always at 96% or higher. Sensitivity and positive predictive values were initially low (78–92%). All four measures improved to 95% or higher following changes in the underlying query logic. An eight-month sample comparison (2/01/2013–9/30/2013) of the test characteristics of the aminoglycoside (AG) versus nephrotoxic medication (NTMx) triggers was performed. Both the AG trigger (sensitivity = 0.92, specificity = 0.99, PPV = 0.98, NPV = 0.99) and the NTMx trigger (sensitivity = 0.98, specificity = 0.99, PPV = 0.92, NPV = 0.99) performed very well. Important trigger query logic changes that impacted performance are listed in ►Table 4.
Table 3.
Acute Kidney Injury Exposed Trigger Performance Measures: Performance characteristics of the exposure triggers over the first two years of the study (PPV = positive predictive value, NPV = negative predictive value).
| Month | Non-ICU Census Days | True Positives (TPs) | False Positives (FPs) | False Negatives (FNs) | True Negatives (TNs) | Sensitivity | Specificity | PPV | NPV |
|---|---|---|---|---|---|---|---|---|---|
| Sep-11* | 3806 | 172 | 40 | 28 | 3566 | 0.86 | 0.989 | 0.81 | 0.992 |
| Oct-11 | 6814 | 373 | 38 | 31 | 6372 | 0.92 | 0.994 | 0.91 | 0.995 |
| Nov-11 | 6646 | 345 | 92 | 48 | 6161 | 0.88 | 0.985 | 0.79 | 0.992 |
| Dec-11 | 6888 | 344 | 260 | 50 | 6234 | 0.87 | 0.960 | 0.57 | 0.992 |
| Jan-12 | 6564 | 350 | 58 | 97 | 6059 | 0.78 | 0.991 | 0.86 | 0.984 |
| Feb-12 | 6509 | 396 | 75 | 74 | 5964 | 0.84 | 0.988 | 0.84 | 0.988 |
| Mar-12 | 6733 | 437 | 64 | 45 | 6187 | 0.91 | 0.990 | 0.87 | 0.993 |
| Apr-12 | 7046 | 373 | 15 | 51 | 6607 | 0.88 | 0.998 | 0.96 | 0.992 |
| May-12 | 6538 | 313 | 17 | 69 | 6139 | 0.82 | 0.997 | 0.95 | 0.989 |
| Jun-12 | 7187 | 276 | 22 | 32 | 6857 | 0.90 | 0.997 | 0.93 | 0.995 |
| Jul-12 | 8362 | 411 | 37 | 22 | 7892 | 0.95 | 0.995 | 0.92 | 0.997 |
| Aug-12 | 7334 | 395 | 23 | 9 | 6907 | 0.98 | 0.997 | 0.94 | 0.999 |
| Sep-12 | 7454 | 327 | 23 | 15 | 7089 | 0.96 | 0.997 | 0.93 | 0.998 |
| Oct-12 | 8434 | 367 | 36 | 10 | 8021 | 0.97 | 0.996 | 0.91 | 0.999 |
| Nov-12 | 6975 | 256 | 13 | 32 | 6674 | 0.89 | 0.998 | 0.95 | 0.995 |
| Dec-12 | 7637 | 209 | 17 | 35 | 7376 | 0.86 | 0.998 | 0.92 | 0.995 |
| Jan-13 | 8057 | 211 | 5 | 20 | 7821 | 0.91 | 0.999 | 0.98 | 0.997 |
| Feb-13 | 6878 | 242 | 22 | 28 | 6586 | 0.90 | 0.997 | 0.92 | 0.996 |
| Mar-13 | 7249 | 237 | 26 | 10 | 6976 | 0.96 | 0.996 | 0.90 | 0.999 |
| Apr-13 | 7316 | 308 | 27 | 21 | 6960 | 0.94 | 0.996 | 0.92 | 0.997 |
| May-13 | 7540 | 321 | 18 | 15 | 7186 | 0.96 | 0.998 | 0.95 | 0.998 |
| Jun-13 | 7346 | 355 | 10 | 2 | 6979 | 0.99 | 0.999 | 0.97 | 1.000 |
| Jul-13 | 7606 | 398 | 8 | 1 | 7199 | 1.00 | 0.999 | 0.98 | 1.000 |
| Aug-13 | 7354 | 371 | 12 | 8 | 6963 | 0.98 | 0.998 | 0.97 | 0.999 |
| Sep-13 | 7795 | 356 | 14 | 4 | 7421 | 0.99 | 0.998 | 0.96 | 0.999 |
| Totals | 178,068 | 8143 | 972 | 757 | 168,196 |
a Electronic triggers started September 17th, 2011 – not a full month of data
Fig. 3.
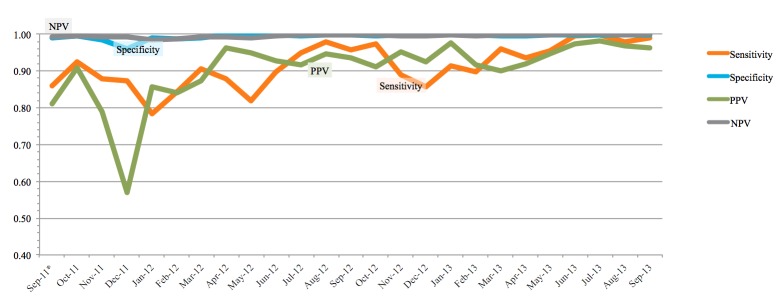
Run Chart of Exposed Trigger Performance Measures: Performance/diagnostic ability of the triggers presented as a run chart. All metrics improved over the course of the study.
Table 4.
Log of Technical Changes to AKI Triggers: Major changes to the AKI triggers and the associated expected effects of the change on trigger performance are shown below. Release dates of the changes can be cross-referenced with Figure 3 to see the realized impact of the changes.
| Date – Version | Technical Change Log Entry | Explanation of the fix (effect of the change) |
|---|---|---|
| Non-Versioned Database Updates | ||
| 9/05/2013 | Update existing location record in AKI_CriticalCareUnits table to now reference the fictitious unit ‘A5C DH’. Updated records for all patients who were located on A5C prior to the unit move so the unit would now be ‘A5C DH’ and thus still be filtered. | The physical placement of patients shifted in the hospital to a unit that was previously an ICU. Patch had to be applied to appropriately filter data before and after the move. (decreased FPs) |
| 7/5/2013 | Ran script to link TP records in the Trigger-Summary table with the correct Exposure-CaseID. The records weren’t initially linked because of a bug in application release 1.3 | Linkage between trigger data and exposed patient tables rerun after application bug fixed (increased TPs) |
| AKI Application Updates | ||
| 5/2013 – 1.3.1 | Add ability to select multiple services at once, and see the filtered results together | Pharmacists requested to be able to view multiple service reports simultaneously since they round on multiple services at the same time (user convenience) |
| Corrected failure to add auto-validated TPs to open exposure cases | Some exposure triggers weren’t auto-validating and being linked to exposure cases (analyst view accuracy) | |
| 5/2013 – 1.3 | Add the pRIFLE risk category to the Surveillance Data Validation screen, in or next to the „Injured“ column | pRIFLE category added to analyst report view (user convenience) |
| Automatically validate ‘Injury’ results that fall within an exposure case and add these results to the exposure case | Autovalidated injury trigger results because they are highly accurate, automatically link them to NTMX-exposed patients (user convenience) | |
| Do not display results that have no Exposure results | Filter injury trigger results that don’t have a link to an exposed patient (user convenience) | |
| Optimization of the views used by the surveillance screen. Performance should be greatly improved | Surveilance Data Validation view was sluggish, new view much improved. (technical performance) | |
| Add idle warning two minutes before timeout (timeout is 20 min) | There was no warning when timeout was going to occur – users were losing work (user efficiency) | |
| Default cursor to username box on login screen (Internet Explorer fix) | Browser-specific issue (user efficiency) | |
| 4/2013 – 1.2 | Change logic to look for multiple aminoglycoside(AG) orders on 3 consecutive days, not just a single order | Separate orders for the same medication were not considered in the AG exposure query logic (decrease FNs) |
| Change visit identification logic to avoid potential FNs if there is a very old open visit with no service | Patients with no current service listed in theEHR would be falsely listed under an old service (decrease FNs) | |
| Optimized javascript to mitigate script error in IE when viewing Surveillance Data Validation screen | Browser-specific issue (technical performance) | |
| Swapped % High NTMx Exposure Cases that Develop AKI numerator and denominator | Exposure reporting metric had numerator and denominator switched (increased metric accuracy) | |
| Changes SCr min/max to only consider results for the day of the report | Serum creatinine values were adjusted so that daily injury report would display only min/max values from that day (user effficiency) | |
| Auto validate (final) TPs if pharmacist initially validates | Initial pharmacist validation of exposure triggers automatically finalized after audit by central pharmacist showed high reliability (user efficiency) | |
| 2/2013 – 1.1 | When creating an NTMx false negative, the created result would not be retrieved, causing the application to report an error. This is because the created NTMx result was not meeting the criteria to be returned (TriggeringResultNumeric >= 3.) This patch adds that condition to the result. | Fixed logic so that FNs added by the pharmacist could be viewable on the trigger data validation screen (view accuracy) |
| When medication results are received from the application, fails to store the added patient | Some NTMx-exposed patients were not being added to the exposure registry due to medication exposure results not being stored correctly (view and data accuracy) | |
| AKI Service or Referenced DLLs Updates | ||
| 11/2012 – 1.1.35.2 | Removed defect that caused the IV Aminoglycoside trigger to incorrectly test for time exposed to medications, returning false positives. Results should now only be generated for patients that have exposure over the number of days specified in the DurationThreshold parameter (currently set to 3) | Incorrect medication timestamp used in query led to many false positives (decreased FPs) |
| 12/2011 – 1.1.35.0 | Various formulations of the same drug should only count as one drug. Changes in logic made to consolidate multiple orders for same drug into 1 exposure | Multiple orders for the same NTMx were being counted as individual exposures, leading to false positives. (decrease FPs) |
| Reports changed to embedded links with English descriptions | Exposure report emails had embedded link labels changed to be more human-readable. (user convenience) | |
| Filter NTMx report to eliminate non-systemic drug formulations | Topical and other forms of non-systemic drug delivery were exempt from the NTMx exposure reports (decreased FPs) | |
| Amphotericin B and cidofovir to be treated in same manner as IV Radiology Contrast- 1 exposure lasts for 7 days | Additional medications added to list of NTMx that count for 1 week of exposure after last administration (improved clinical accuracy of query logic) | |
| 7/2011 – 1.0.35.7 | Added more unit exclusions to AKI_CriticalCareUnits table in db | Updated units excluded from the reports (decreased FPs) |
4.2 Web-Based Application
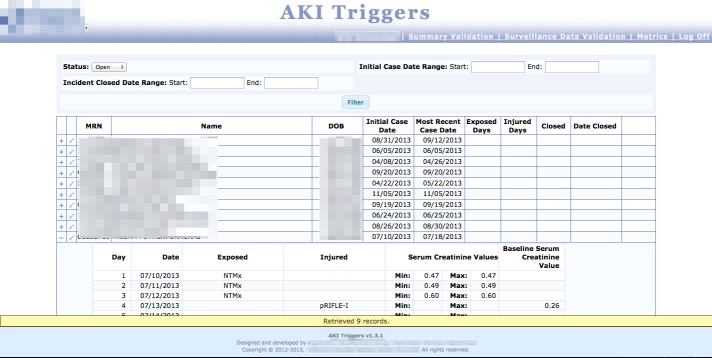
The web-based application was implemented on February 1, 2013. The centralized workspace, repository, and registry greatly simplified the workflow (►Figure 4). A separate application (the Performance Measurement and Reporting System; PMRS) has been developed at CCHMC that allows for automated control charts to be generated from a structured data format loading process; work is currently underway to complete the necessary interfaces and connect the two applications. ►Figure 5a, ►Figure 5b, and ►Figure 5c show a series of screenshots from the web-based trigger application to demonstrate the design elements of the user interface. There are three primary work screens; one for pharmacist (summary) validation, one for the data analyst (data) validation, and a screen for displaying the metrics and inputting the census data.
Fig. 4.

AKI Web-based Application Socio-Technical Workflow: Representation of the trigger report data flow with a central web-based AKI trigger application replacing the process shown in Figure 2. The upper arm represents the pharmacists (green figures) interacting with the reports while the lower arm represents the data analyst’s interactions. The central database application acts as a AKI trigger report repository, a data validation workspace, and a framework for automated ad hoc summary report generation for stakeholders. This workflow is much simpler than that shown in Figure 2 (NTMx = Nephrotoxic Medication, AKI = Acute Kidney Injury).
Fig. 5a.

Summary Validation screen, where pharmacists log in to validate nephrotoxin-exposed trigger data. Users can filter and view data in several ways, and drill down into individual records to see trigger criteria and record interventions.
Fig. 5b.
Surveillance Data Validation screen, where data analysts can see exposed patients in a registry, record the number of exposed and injured days, and “close out” the patients so their data is rolled-up into exposure and injury metrics.
Fig. 5c.

Metrics screen, where users of the system can view the aggregate nephrotoxin-exposed and injury data via the four a priori metrics of the AKI project.
5. Discussion
We describe the technical development of a catalog of novel electronic triggers (and their associated applications) used to identify and stratify patients at-risk for developing AKI. These tools are unique because they are part of a system that focuses on predicting AKI based on NTMx exposure and differ from prior efforts which merely reacted to an already existing insult [11-14, 16]. The underlying query logic is more complex than triggers that rely on simple SCr changes only, is filtered to a unique population (non-critically ill children), and is time-sensitive given our surveillance methodology and the latent, often delayed onset of AKI in this population.
The creation of the AKI EHR-based triggers and the associated centralized workspace application allowed our team to work much more efficiently. While some aspects of the implementation and its effects on workflow were not formally evaluated, our new automated method is much more efficient since we have drastically reduced the amount of manual data entry and transcription processes from the initial manual approach. In addition, clinical pharmacists on our team have been very satisfied and engaged in the development process. The conversion to electronic triggers facilitated a higher ability to detect exposed patients, primarily due to the increased detection of patients receiving IV radiology contrast as one of their criteria-qualifying NTMx [4].
5.1 Challenges and Lessons Learned
There were many factors that were challenging to address throughout all stages of the conversion to an automated trigger detection system. One recurring theme that provided some difficulty in our design, implementation, and evaluation was the issue of timing.
5.2 Delayed onset of NTMx-AKI
The pathophysiologic onset of NTMx-AKI may be delayed, perhaps after a patient is no longer exposed to a NTMx. Because of this, our surveillance algorithms had to account for additional windows of observation (2 or 5 days, depending on their exposure and injury status) around the time a patient was exposed to detect patients who developed AKI after no longer being exposed to NTMx. In addition, IV radiology contrast, cidofovir, and ambisome are known to cause AKI up to 7 days following a single exposure. The electronic triggers needed additional logic to account for this effect. We believe that the electronic report was superior at detecting these scenarios specifically, since it is difficult for pharmacists to track patients who have received these medications, considering that clinical pharmacists work as a team and handoff patients frequently.
5.3 Near-real time reporting
We also had to accommodate for differences between the timing limitations of our reporting abilities and the timing of clinical practice. Ideally our trigger reporting system would have the results available each morning before the pharmacists start their daily review of the patients before clinical rounds. Timing constraints of near-real time reporting and the need to assign the trigger report processing to a mid-morning slot is a technical limitation that leads to some mild inefficiency for the pharmacists. We hope to optimize the report availability time in the future.
5.4 “Clinical wobble”
The near-real time limitation also creates occasional exposure triggers that are deemed to be false positives (FPs) or false negatives (FNs), because the logic looks at data from the previous calendar day. If a patient has had a NTMx added or removed after midnight, the pharmacists will validate the trigger as a FP or FN, despite the algorithm being accurate. We accept these occasional inaccuracies and refer to such cases as “clinical wobble” error.
5.5 Timestamps
Today’s robust EHR systems create audit trails for almost every user or computer action that occurs related to clinical care. As such, selecting the correct timestamps on these processes for reporting purposes can be a daunting task that leads to inaccuracies. The effects of selecting the incorrect timestamp are shown in ►Table 3 and ►Figure 3. In late November 2011 a change in the query logic involving a medication administration timestamp was made that greatly increased the number of FPs seen in the next several weeks. Once the logic was changed to the appropriate timestamp, the number of monthly FPs reverted back to previous values. Subsequent changes over the following months greatly reduced the number of FPs. Another pitfall was selecting the wrong specific medication status (last administered date/time versus the end time of the medication order). Patients receiving infrequent doses (every 48 or 72 hours) but with end dates in the future would cause our initial logic to “think” the patient had received the medication every day.
5.6 Quality Assurance and Auditing
Systems such as the triggers we have developed require constant monitoring, even after achieving satisfactory performance. Logic changes, upgrades, and the reliance on other applications or hardware can all cause failures that are difficult to detect. Close, practical inspection of our system’s output is sometimes the only way to detect an insidious change has occurred. As we have automated the system, we have removed many of the manual double-checks in our system (mostly performed by the senior clinical pharmacist), but implemented an audit strategy whereby the daily, weekly, and monthly output is closely scrutinized, sometimes in a sampling fashion. This will free pharmacists to resume other clinical, educational, or research duties.
5.7 Organizational/Social Considerations
As with all projects of this size, acquiring resources can be difficult. There are many competing projects and allocation of resources must be negotiated. Demonstration of the clinical rationale and research, as well as acquiring external funding, assisted us in assignment to the application development team and appropriate prioritization. The multidisciplinary approach also required us to get “buy-in” from many administrators, clinicians, operations, and patient safety stakeholders.
5.8 Limitations
There are several limitations to note. First, the NTMx-AKI detection system does not detect exposure or injury in real-time. This would be ideal for immediate intervention. While we provided some performance evaluation, we did not evaluate the accuracy of the injury triggers, the web-based application itself, or perform any cost/resource analysis on the automation of the triggers and the application. These efforts are beyond the scope of this project, which was to execute the implementation of the technology and provide a detailed roadmap for others choosing to implement similar tools. Formal evaluation was also difficult in the face of a rapid implementation timeline, given patient safety implications. Evaluation of injury trigger accuracy was deemed not necessary once they were found to be highly accurate. This was most likely due to their simple logic.
5.9 Future Work
We aim to improve our automated triggers and application in several ways. Work is currently underway to attach the application to an automated statistical control chart application interface, which will allow us to generate ad hoc control charts and visualizations with little manual effort. We also plan on importing census data, to alleviate one of the last manual steps in metric generation. Finally and most importantly, this report will aid in spreading the technology of the NTMx-AKI project to other pediatric institutions around the country. We have already engaged several major hospitals within the Prospective Pediatric Acute Kidney Injury Research Group network and have commitments to proceed with implementation of very similar technology in settings external to CCHMC.
6. Conclusions
Nephrotoxic medication-associated acute kidney injury (NTMx-AKI) is a phenomenon that is costly and more common than previously recognized. Prior efforts to use technology to identify AKI have focused on detection after renal injury has occurred. We have built a risk-stratifying system based on electronic triggers that detects patients at-risk for NTMx-AKI before injury occurs. Design, building, and implementation of a trigger-based application with high-performing triggers uncovered unexpected challenges that were ultimately overcome.
Supplementary Material
Acknowledgements
The Department of Information Services (IS) was instrumental in the development of the electronic tools featured in this manuscript. The design of the tools was created in conjunction with input from the Division of Biomedical Informatics. The Application Development team from Information Services performed the construction and implementation of the triggers and the application; key members included William “Lee” Spires, William Young, John Schraer, and Bryan Towne. Finally, the Clinical Pharmacy team has been invaluable to the success of the AKI project.
Footnotes
Clinical Relevance Statement
Electronic surveillance of nephrotoxic medication exposure (NTMX) can decrease both the number of patients with exposure and with resulting acute kidney injuries (AKI). This report summarizes the construction of automated risk-stratifying algorithms, the performance of those algorithms, and the challenges uncovered during the design, build, and implementation of the system.
Abbreviations
- NTMx-AKI – nephrotoxic medication-associated acute kidney injury
- SN – sensitivity
- SP – specificity
- PPV – positive predictive value
- NPV – negative predictive value
- SCr – serum creatinine
- EHR – electronic health record
- AE – adverse event
- CCHMC – Cincinnati Children’s Hospital Medical Center
- IS – Information Services
- TP – true positive
- FP – false positive
- TN – true negative
- FN – false negative
- ADT – admit/discharge/transfer
- ETL – extract/transform/load
- AG – aminoglycoside
- PMRS – performance measurement and reporting system
Conflicts of Interest
The authors declare that they have no conflicts of interest in the research.
Protection of Human and Animal Subjects
The Institutional Review Board at CCHMC deemed this project not to involve human or animal subjects.
Funding Acknowledgment
This study received partial funding from the Agency for Healthcare Research and Quality Center for Education and Research on Therapeutics (grant AHRQ CERT 1U19HS021114).
References
- 1.Hui-Stickle S, Brewer ED, Goldstein SL.Pediatric ARF epidemiology at a tertiary care center from 1999 to 2001. Am J Kidney Dis 2005; 45(1): 96–101 [DOI] [PubMed] [Google Scholar]
- 2.Moffett BS, Goldstein SL.Acute kidney injury and increasing nephrotoxic-medication exposure in non-critically-ill children. Clinical journal of the American Society of Nephrology CJASN 2011; 6(4): 856–863 [DOI] [PMC free article] [PubMed] [Google Scholar]
- 3.Zappitelli M, Moffett BS, Hyder A, Goldstein SL.Acute kidney injury in non-critically ill children treated with aminoglycoside antibiotics in a tertiary healthcare centre: a retrospective cohort study. Nephrol Dial Transplant 2011; 26(1): 144–150 [DOI] [PubMed] [Google Scholar]
- 4.Goldstein SL, et al. Electronic health record identification of nephrotoxin exposure and associated acute kidney injury. Pediatrics 2013; 132(3): e756–767 [DOI] [PubMed] [Google Scholar]
- 5.Resar RK, Rozich JD, Classen D.Methodology and rationale for the measurement of harm with trigger tools. Qual Saf Health Care 2003; 12 (Suppl 2): ii39–ii45 [DOI] [PMC free article] [PubMed] [Google Scholar]
- 6.Rozich JD, Haraden CR, Resar RK.Adverse drug event trigger tool: a practical methodology for measuring medication related harm. Qual Saf Health Care 2003; 12(3): 194–200 [DOI] [PMC free article] [PubMed] [Google Scholar]
- 7.Doupi P.Using EHR data for Monitoring and Promoting Patient Safety: Reviewing the Evidence on Trigger Tools. Stud Health Technol Inform 2012; 180: 786–790 [PubMed] [Google Scholar]
- 8.Muething SE, et al. Identifying causes of adverse events detected by an automated trigger tool through in-depth analysis. In: Qual Saf Health Care 2010; 19: 435–439 [DOI] [PubMed] [Google Scholar]
- 9.Mull HJ, Nebeker JR.Informatics tools for the development of action-oriented triggers for outpatient adverse drug events. AMIA Annu Symp Proc 2008: 505–509 [PMC free article] [PubMed] [Google Scholar]
- 10.Naessens JM, et al. A comparison of hospital adverse events identified by three widely used detection methods. In: Int J Qual Health Care 2009; 21: 301–307 [DOI] [PubMed] [Google Scholar]
- 11.Colpaert K, et al. Implementation of a real-time electronic alert based on the RIFLE criteria for acute kidney injury in ICU patients. Acta clinica Belgica Supplementum 2007; 2: 322–325 [DOI] [PubMed] [Google Scholar]
- 12.Colpaert K, et al. Impact of real-time electronic alerting of acute kidney injury on therapeutic intervention and progression of RIFLE class. Crit Care Med 2012; 40(4): 1164–1170 [DOI] [PubMed] [Google Scholar]
- 13.Galanter WL, Moja J, Lambert BL.Using computerized provider order entry and clinical decision support to improve prescribing in patients with decreased GFR. Am J Kidney Dis 2010; 56(5): 809–812 [DOI] [PubMed] [Google Scholar]
- 14.Chertow GM, et al. Guided medication dosing for inpatients with renal insufficiency. JAMA 2001; 286(22): 2839–2844 [DOI] [PubMed] [Google Scholar]
- 15.Matheny ME, et al. Development of inpatient risk stratification models of acute kidney injury for use in electronic health records. Medical decision making : an international journal of the Society for Medical Decision Making 2010; 30(6): 639–650 [DOI] [PMC free article] [PubMed] [Google Scholar]
- 16.McCoy AB, et al. A computerized provider order entry intervention for medication safety during acute kidney injury: a quality improvement report. Am J Kidney Dis 2010; 56(5): 832–841 [DOI] [PMC free article] [PubMed] [Google Scholar]
Associated Data
This section collects any data citations, data availability statements, or supplementary materials included in this article.