

Background: Microparticles are generated in vivo with exposures to high pressure gases by unclear mechanisms.
Results: High inert gas pressure causes singlet oxygen formation, which initiates a cycle of actin S-nitrosylation, nitric-oxide synthase-2, and NADPH oxidase activation leading to microparticle formation.
Conclusion: Inert gas-mediated oxidative stress causes microparticle production.
Significance: This mechanism may initiate events leading to decompression sickness.
Keywords: Actin, NADPH Oxidase, Nitrosative Stress, Reactive Nitrogen Species (RNS), Reactive Oxygen Species (ROS), S-Nitrosylation, Decompression, Focal Adhesion Kinase, Singlet Oxygen
Abstract
This investigation was to elucidate the mechanism for microparticle (MP) formation triggered by exposures to high pressure inert gases. Human neutrophils generate MPs at a threshold of ∼186 kilopascals with exposures of 30 min or more. Murine cells are similar, but MP production occurs at a slower rate and continues for ∼4 h, whether or not cells remain under pressure. Neutrophils exposed to elevated gas but not hydrostatic pressure produce MPs according to the potency series: argon ≃ nitrogen > helium. Following a similar pattern, gases activate type-2 nitric-oxide synthase (NOS-2) and NADPH oxidase (NOX). MP production does not occur with neutrophils exposed to a NOX inhibitor (Nox2ds) or a NOS-2 inhibitor (1400W) or with cells from mice lacking NOS-2. Reactive species cause S-nitrosylation of cytosolic actin that enhances actin polymerization. Protein cross-linking and immunoprecipitation studies indicate that increased polymerization occurs because of associations involving vasodilator-stimulated phosphoprotein, focal adhesion kinase, the H+/K+ ATPase β (flippase), the hematopoietic cell multidrug resistance protein ABC transporter (floppase), and protein-disulfide isomerase in proximity to short actin filaments. Using chemical inhibitors or reducing cell concentrations of any of these proteins with small inhibitory RNA abrogates NOS-2 activation, reactive species generation, actin polymerization, and MP production. These effects were also inhibited in cells exposed to UV light, which photoreverses S-nitrosylated cysteine residues and by co-incubations with the antioxidant ebselen or cytochalasin D. The autocatalytic cycle of protein activation is initiated by inert gas-mediated singlet O2 production.
Introduction
This investigation was aimed at improving understanding of the pathophysiology of decompression sickness (DCS).2 DCS is a systemic pathophysiological process that occurs after tissues become supersaturated with nitrogen or some alternative gas used to dilute O2 in breathing mixtures during activities such as deep sea diving, high altitude aviation, and space exploration. Circulating microparticles (MPs), membrane-encapsulated cell fragments with diameters of 0.1–1 μm, are elevated in animals and humans after simulated or bona fide underwater diving (1–5). In a murine model, MPs were shown to initiate a systemic inflammatory process postdecompression that is related to neutrophil activation (6–9). Injuries identified in decompressed animals can be recapitulated by injecting decompression-induced MPs into naive mice (7–9). Findings from these murine studies and also several trials involving human divers caused us to hypothesize that MP production may actually occur because of high pressure exposures rather than being a consequence of decompression per se (4, 5).
There are three pathways for MP generation: oxidative stress, apoptosis, and cell activation/Ca2+ influx (10–12). It is widely accepted that MPs form when the normal asymmetric distribution of lipids between the inner and outer leaflets of the plasma membrane is lost (13). There are two enzyme classes that actively control plasma membrane lipid localization: the aminophospholipid translocases (“flippases”), lipid-selective P-type ATPases that catalyze inward movement of aminophospholipids, and “floppases,” a subgroup of ATP-dependent ABC lipid transporters that catalyze only outward movement of lipids. There are also bidirectional nonspecific “scramblases,” calcium-dependent and ATP-independent enzymes that catalyze bidirectional movement of lipids according to their concentration gradients. Proteolysis of the actin cytoskeleton occurs concurrent with changes in the activities of the phospholipid transport enzymes as MPs are generated (13). The precise role for cytoskeletal modifications impacting MPs dynamics is poorly understood, but cytoskeletal instability is known to trigger production (14).
Given the apparent central role of neutrophils in decompression pathophysiology, we chose to investigate MP production by isolated neutrophils exposed to elevated partial pressures of various gases. Results suggested that cells were responding to an oxidative stress. Inert gases enhance the rate of reactive O2 species (ROS) production by forming collision complexes (15–18). This occurs because of a transient shift of electron density from the collider molecular orbitals into the π orbitals of O2 (15, 16). These gases can elicit oxidative stress responses in unicellular organisms and enhance O2 toxicity in whole animals under some conditions (19–23).
We found that human and murine neutrophils exhibited similar responses to high pressure gases, but murine cell MP production persisted even after decompression. This offered an opportunity for more detailed analysis of mechanisms because postexposure manipulations could be made and because we have previously found efficient methods to reduce intracellular proteins in murine cells using small inhibitory RNA (24–26).
Recent studies with mice have highlighted a role for inflammatory/inducible or type 2 nitric-oxide synthase (NOS-2 or iNOS) in decompression-induced neutrophil activation (3, 4, 6–9). MP elevations are lower, and there are fewer manifestations of decompression stress in mice injected with a specific iNOS inhibitor (1400W; N-3-(aminomethyl) benzyl acetamine) and in iNOS knock-out (KO) mice (7). There is precedence for inert gases activating NOS isoforms. Helium at 71 kPa causes cardiac preconditioning in rabbits linked to activation of endothelial (type 3) NOS, and exposure to 700 kPa activates iNOS in mice (27, 28).
Enhanced actin turnover has been shown to cause iNOS activation in neutrophils (26). This is an oxidative stress response triggered when neutrophils are exposed to high O2 pressures. Increased production of reactive species causes S-nitrosylation of cytosolic actin (SNO-actin) (29). Actin polymerization increases because the elongation factor, vasodilator-stimulated phosphoprotein (VASP), has higher affinity for the SNO-actin (24). VASP also appears to bundle Rac1, Rac2, cyclic AMP-dependent, and cyclic GMP-dependent protein kinases (PKA and PKG) in close proximity to short actin filaments, and subsequent Rac activation increases actin free barbed end formation. Increased actin turnover increases linkage of focal adhesion kinase (FAK), and iNOS activity is increased due to dimer formation by a FAK-mediated association with actin filaments (25).
The purpose of this investigation was to investigate MP production by neutrophils exposed to high pressures of N2 or noble gases. It is important in these studies to recognize that there was no elevation in O2 partial pressure above that due to exposure to air. MPs production by human and murine neutrophils occurs while cells are exposed to elevated pressures of inert gas due to an autocatalytic cycle of enzyme activation related to generation of reactive species and actin turnover.
EXPERIMENTAL PROCEDURES
Materials
Chemicals were purchased from Sigma-Aldrich unless otherwise noted. Compressed gases were purchased from Air Products and Chemicals, Inc. (Allentown, PA). NADPH oxidase inhibitory peptide (Nox2ds), which selectively inhibits the interaction between Nox2 and p47phox, with the sequence NH3-CSTRVRRQL-CONH2, and Scrmb-Nox2ds, a control scrambled amino acid peptide with sequence NH3-CLRVTRQSR-CONH2, were purchased from American Peptide Co. (Sunnyvale, CA) (30). N-3-(Aminomethyl) benzyl acetamine (NSC 23766), a Rac inhibitor; 3,4-dihydro-6-[[4-[[[3-(methylsulfonyl)phenyl]methyl]amino]-5-(trifluoromethyl)-2-pyrimidinyl]amino]-2(1H)-quinolinone) (PF573228), a FAK inhibitor; 3-[[[3-[(1E)-2-(7-chloro-2-quinolinyl) ethenyl]phenyl][[3-dimethylamino)-3-oxopropyl]-thio]methyl]thio]propanoic acid (MK571), an inhibitor of the multidrug resistance protein-1 ABC transporter (MRP-1, a “floppase”); 2-methyl-8-(phenylmethoxy)imidazo[1,2-a]pyridine-3-acetonitrile (SCH28080), an inhibitor of the H+,K+-ATPase (a “flippase”); and quercetin-3-rutinoside, a protein-disulfide isomerase (PDI) inhibitor, were purchased from Tocris Bioscience (Ellisville, MO). N-[6-(Biotinamido)hexyl]-3′-(2′-pyridyldithio) propionamide (biotin-HPDP) and streptavidin-agarose were purchased from Thermo Fisher Scientific. Ultrafree-MC filters, PVDF Immobilon-FL, and ZipTipC18P10 were from Millipore Corp. Antibodies to actin for general Western blotting and immunoprecipitation studies was purchased from Thermo Fisher Scientific (catalogue no. PA1-036), and those for iNOS dimer assays were from Santa Cruz Biotechnology, Inc. (catalogue no. sc-650). Antibodies to biotin (catalogue no. B3640) were purchased from Sigma. Anti-VASP (catalogue no. 610448), anti-FAK (catalogue no. 610087), and anti-PDI (catalogue no. 610946) as well as annexin V-conjugated APC (catalogue no. 550474) and annexin-binding buffer solution were purchased from BD Pharmingen. Small inhibitory RNA (siRNA) sequences were purchased from Santa Cruz Biotechnology. These included a control, scrambled sequence siRNA that will not cause specific degradation of any known cellular mRNA (UUCUCCGAACGUGUCACGU). FAK siRNA is a mixture of three sequences: strand A (GCAUCCUGAAAUUCUUUGA), strand B (CCAGUACUCAAACAGUGAA), and strand C (CGACCAGGGAUUAUGAGAU). VASP siRNA is a mixture of three sequences: strand A (GGGGUGUCAAGUACAAUCA), strand B (CCACUCCCAUCUUCCAUCA), and strand C (GAGUGAACCUGUGAGAAGA). MRP1 (hereafter identified as floppase) siRNA is a pool of three different siRNA duplexes: strand A (sense, GGAAGCACAUCUUUGAGAAtt; antisense, UUCUCAAAGAUGUGCUUCCtt), strand B (sense, CUGAAGGAGUAUUCUGAAAtt; antisense, UUUCAGAAUACUCCUUCAGtt), and strand C (sense, GCAUGAACUUGGACCCUUUtt; antisense, AAAGGGUCCAAGUUCAUGCtt). PDI siRNA is a pool of three different siRNA duplexes: strand A (sense, GAACGGUCAUUGAUUACAAtt; antisense, UUGUAAUCAAUGACCGUUCtt), strand B (sense, GGAAGACGACGAUCAGAAAtt; antisense, UUUCUGAUCGUCGUCUUCCtt), and strand C (sense, GCUACCACUUCGCAUUUCAtt; antisense, UGAAAUGCGAAGUGGUAGCtt). The H+/K+ ATPase β (here after identified as flippase) siRNA is a pool of three different siRNA duplexes: strand A (sense, CUGUACUACGCAGGUUUCUtt; antisense, AGAAACCUGCGUAGUACAGtt), strand B (sense, GACAGCAUCAACUGUACAUtt; antisense, AUGUACAGUUGAUGCUGUCtt), and strand C (sense, CACUAAGGAAGGCCUAUCUtt; antisense, AGAUAGGCCUUCCUUAGUGtt).
Animals
Mice (Mus musculus) were purchased (Jackson Laboratories, Bar Harbor, ME), fed a standard rodent diet and water ad libitum, and housed in the university animal facility. A colony of iNOS knock-out mice was maintained from breading pairs purchased from Jackson Laboratories. After anesthesia (intraperitoneal administration of ketamine (100 mg/kg) and xylazine (10 mg/kg)), skin was prepared by swabbing with Betadine, and blood was obtained into heparinized syringes by aortic puncture.
Isolation of Neutrophils and Exposure to Various Agents
Heparin-anticoagulated blood (4 ml) was obtained from healthy human volunteers and centrifuged through a two-layer preparation of Histopaque 1077 and 1119 (Sigma) at 400 × g for 30 min to isolate neutrophils, and cells were washed in PBS. Murine neutrophils were isolated from heparinized blood of anesthetized mice as described previously (29).
Procedures for gas exposures were the same for human and murine cells. A concentration of 9 × 10⁵ neutrophils/ml of PBS + 1 mm CaCl2, 1.5 mm MgCl2, and 5.5 mm glucose was exposed at room temperature to either air at atmospheric pressure (∼100 kPa) or air plus partial pressures of helium, N2, or argon up to 690 kPa following published procedures (29). Where indicated, prior to gas exposures, some murine cell suspensions were exposed for 20 h at room temperature to 0.08 nm siRNA following the manufacturer's instructions, using control siRNA or siRNA specific for mouse VASP, FAK, PDI, flippase, or floppase. The degree of protein reduction after these treatments was assessed by Western blotting. Expressed as the ratio of protein to actin in siRNA-incubated cell lysate Western blots versus protein concentrations in cells incubated with control siRNA, VASP band density after siRNA incubation was just 12.1 ± 2.5% (S.E., n = 6) that of control, after FAK siRNA incubation 6.5 ± 1.4% (S.E., n = 6), after PDI siRNA 10.0 ± 2.8% (S.E., n = 6), after flippase siRNA 14.1 ± 1.1% (S.E., n = 6), and after floppase siRNA 11.9 ± 1.6% (S.E., n = 6). Where indicated, inhibitors were present in cell suspensions during gas exposures as follows: 200 μm MK571 (floppase inhibitor), 200 μm SCH28080 (flippase inhibitor), 20 μm PT 573228 (FAK inhibitor), 50 μm NSC 23766 (Rac inhibitor), 30 μm quercetin-3-rutinoside (PDI inhibitor), 10 μm Nox2ds (NOX inhibitor), or a 10 μm concentration of the scrambled sequence control peptide to Nox2ds. In other studies after gas exposures but prior to specific studies, cell suspensions were exposed for 5 min to UV light from a 200-watt mercury vapor lamp.
Actin Polymerization in Permeabilized Cells
Neutrophils suspensions were permeabilized using 0.2% n-octyl-β-glucopyranoside (OG) and then exposed to air or gas pressures as outlined above, and actin polymerization was assayed exactly as described previously (31). Suspensions were incubated for 10 s by adding 0.1 volumes of OG buffer (60 mm PIPES, 25 mm Hepes (pH 6.9), 10 mm EGTA, 2 mm MgCl2, 4% OG, 10 μm phallacidin, 42 nm leupeptin, 10 mm benzamidine, and 0.123 mm aprotonin). After the 10-s incubation, 3 volumes of Buffer B (1 mm Tris (pH 7.0), 1 mm EGTA, 2 mm MgCl2, 10 mm KCl, 5 mm β-mercaptoethanol, and 5 mm ATP) was added. Actin polymerization was monitored for 5 min using a fluorescence spectrometer (355 nm excitation, 405 nm emission) when 1 μm pyrene-labeled rabbit skeletal muscle actin was added to the neutrophil suspension.
NOS Activity Assay in Permeabilized Neutrophils
Isolated neutrophils were subjected to permeabilization using 0.2% OG, and NOS activity was assessed exactly as described previously (24). In brief, cells (9 × 10⁵/ml of PBS + 5.5 mm glucose) were suspended with 40 μm N-hydroxy-l-arginine to inhibit arginase. After 10 min, 20 mm l-[3H]arginine was added without or with 0.1 μm 1400W, and at intervals of time up to 2 h, 0.7 m trichloroacetic acid was added to quench the reaction. Samples were washed with ethyl ether and passed through Dowex 50WX8 resin, and l-[3H]citrulline was measured in the eluate. The same concentration of [3H]citrulline was generated if an up to 5-fold greater l-[3H]arginine concentration was used, and no citrulline was detected if OG permeabilization was not performed (data not shown).
NOS-2 Dimer/Monomer Differences
Differences in the presence of iNOS dimers versus monomers were assayed following published methods (26, 32, 33). Neutrophils were lysed by suspension in buffer (100 mm NaCl, 40 mm Tris (pH 7.3), 4 mm tetrahydrobiopterin, 3 mm DTT, 2 mm l-arginine, 0.1% Triton X-100, 10% glycerol), subject to freeze-thaw three times, and then incubated at 37 °C for 30 min. After centrifugation at 12,000 × g for 30 min at 4 °C, samples were loaded on 5% SDS-polyacrylamide gels, followed by Western blotting (29). Blots were probed for iNOS and actin.
NADPH Oxidase Activity
O2 utilization was monitored in suspensions containing 3.6 × 10⁵ neutrophils in 400 μl of PBS + 1 mm CaCl2, 1.5 mm MgCl2, and 5.5 mm glucose without or with 10 μm Nox2ds with a model 5300 oxygen electrode assembly from Yellow Springs Instrument Co. (Yellow Springs, OH).
Reactive Species Generation
Neutrophil suspensions were prepared with 10 μm 2,7-dihydrodichlorofluorescein diacetate (DCF-DA), and fluorescence was monitored (492 nm excitation, 530 nm emission) after incubations in air or air + 690 kPa of helium, N2, or argon following procedures described previously (7).
Singlet O2 Detection
Singlet O2 was detected using the luminescent probe singlet oxygen sensor green (Invitrogen) following methods similar to those described by Gollmer et al. (34). A solution of 1 mm singlet oxygen sensor green was prepared in methanol, and 2 μl was added to 200-μl neutrophil suspensions that were incubated in the dark at room temperature for 30 min to allow uptake of the probe prior to inert gas exposures. After decompression, cells were assayed (480 nm excitation, 535 nm emission) at intervals. Where indicated, 1 mm ascorbic acid or 2 mm azide was added to suspensions 5 min prior to gas pressurization.
Cytoskeletal Protein Associations Based on Triton Solubility
Neutrophils were suspended in a solution of 0.5 mm dithiobis(succinimidyl propionate) (DTSP) to cross-link sulfhydryl-containing proteins within a proximity of ∼12 Å following published procedures (29, 35). Cell lysates were partitioned into Triton-soluble G-actin and short F-actin and Triton-insoluble protein fractions and subjected to electrophoresis in gradient 4–15% SDS-polyacrylamide gels, followed by Western blotting as described previously (29).
Immunoprecipitation of Protein Complexes
Suspensions of short F-actin containing 250 μg of protein were precleared and then incubated with 5 μg of anti-actin antibodies on a shaker overnight at 4 °C, and then 30 μl of 20% (w/v) protein G-Sepharose (preblocked with 2% BSA) was added and incubated for 1.5 h at 4 °C. Samples were processed, electrophoresed, and analyzed by Western blotting as described previously (29).
Cell Extract Preparation and Biotin Switch Assay
Isolated neutrophils previously exposed to air (control) or elevated pressures of inert gas were suspended in HEN buffer (250 mm Hepes, pH 7.7, 1 mm EDTA, 0.1 mm neocuproine), lysed, and subjected to the biotin switch assay as previously described (29).
MP Enumeration by Flow Cytometry
Flow cytometry was performed with a four-color dual laser analog FACSCalibur (BD Biosciences) or an eight-color, triple laser MACSQuant (Miltenyi Biotec Corp., Auburn, CA) using the manufacturers' acquisition software. At intervals of time following neutrophil incubation in air or high gas pressures, cells were fixed using a commercial agent (100 μl/ml Caltag Reagent A fixation medium, Invitrogen). Samples were centrifuged at 15,000 × g for 30 min to pellet neutrophils. EDTA was added to the supernatant to achieve 0.125 m to minimize MP aggregation, and tubes containing 50 μl of supernatant were mixed with 3 μl of annexin V-FITC in 100 μl of Invitrogen annexin-binding buffer solution (1:10 (v/v) in distilled water). All reagents and solutions used for MP analysis were sterile and filtered (0.1-μm filter). All tubes were incubated for 30 min in the dark prior to analysis. Analysis with both flow cytometer protocols involved establishing true negative controls by a fluorescence-minus-one analysis. Both forward scatter and sideward scatter were set at logarithmic gain. Microbeads of various diameters (0.3 μm (Sigma), 1.0 μm, and 3.0 μm (Spherotech, Inc., Lake Forest, IL)) were used for initial settings and before each experiment as an internal control. Annexin V-positive particles with diameters up to 1 μm were taken as MPs, and the absolute number/ml was determined by counting the proportion of beads and the exact volume of solution from which MPs were analyzed.
Statistical Analysis
Results are expressed as the mean ± S.E. for three or more independent experiments. To compare data, we used analysis of variance (ANOVA) using SigmaStat (Jandel Scientific, San Jose, CA) and Newman-Keuls post hoc test. The level of statistical significance was defined as p < 0.05.
RESULTS
Microparticle Production by Human Neutrophils
Isolated human neutrophils from healthy volunteers generate MPs while exposed to elevated partial pressures of N2. Fig. 1 shows the dose dependence of the process expressed as number of MPs/neutrophil, which rises in a progressive fashion at a threshold pressure of ∼186 kPa. As shown, air-exposed (control) human neutrophils generated just 0.001 ± 0.001 (S.E., n = 6) MPs/neutrophil over 4 h. MPs/neutrophil in suspensions exposed to air plus 186, 345, or 690 kPa of N2 were all significantly greater than for the control sample when neutrophils were decompressed after 30 min of gas exposure. Moreover, in suspensions assayed at up to 4 h after decompression, the values were virtually identical to MP counts taken immediately after the 30-min gas exposure. If cells were kept under pressure for 4 h and fixed immediately upon decompression, the MPs/neutrophil counts were statistically insignificantly different from samples kept under pressure for just 30 min (data not shown). We conclude that MPs are generated within 30 min during exposures to high gas pressures and that production does not continue after decompression.
FIGURE 1.
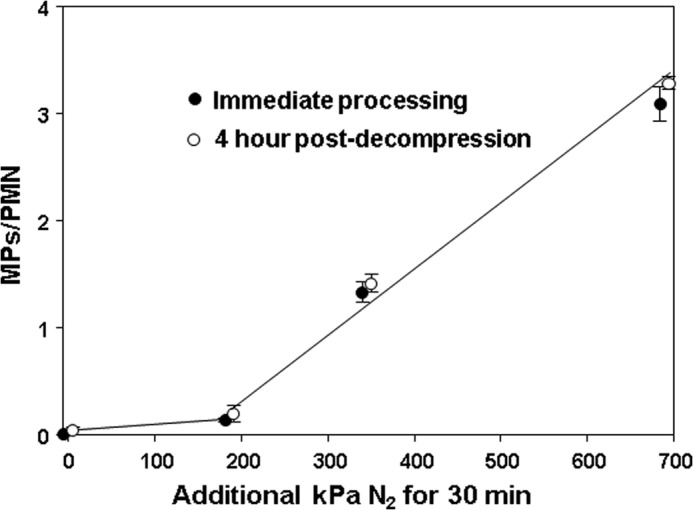
MP production by human neutrophils exposed to air (0 additional kPa of N2) or air plus 186, 345, or 690 kPa of N2 for 30 min. Data show MPs/neutrophil in suspensions immediately (open circles) after 1.8 × 10⁵ cells had been exposed to air plus various pressures of N2 for 30 min or after suspensions were left in air at ambient pressure for 4 h before counting (closed circles). Samples exposed to only ambient air were fixed immediately after suspensions had been prepared (open circle) or after a 4-h incubation (closed circle). Data are mean ± S.E. (error bars), n = 4–9 for each value. All values with elevated pressures of N2 are significantly different from the 0 value (air only with no added pressure). There are no significant differences between samples at each pressure that were processed immediately (open circles) versus those left for 4 h before MPs were counted (closed circles).
Neutrophil viability when human cells were first isolated from blood was 90.2 ± 0.5% (n = 12). Viability decreased slightly with incubation times of 30 min or more in air to 85.0 ± 1.1% (n = 9), but this was not significantly different from cells exposed to elevated gas pressures. For example, after 30-min incubations with air plus 690 kPa of N2, viability was 84.2 ± 0.9% (NS, n = 7). There also was no loss of cells as might arise if gas exposure or decompression caused fragmentation. The suspensions all had 1.8 × 10⁵ neutrophils in 200 μl at the start of the studies. After incubations in ambient air, the mean cell count was 1.77 ± 0.02 × 10⁵, and after 30 min, incubations with air plus 690 kPa of N2, the cell count was 1.75 ± 0.03 (NS) × 105.
Because of information developed in the murine model of DCS, we were interested in evaluating whether activities of iNOS and NADPH oxidase (NOX) were required for MP formation (7, 9). Whereas production by human cells exposed to air plus 690 kPa of N2 for 30 min as shown in Fig. 1 was 3.34 ± 0.17 (n = 7) MPs/neutrophil, cells exposed to air plus 690 kPa of N2 along with 1 mm 1400W generated just 0.37 ± 0.27 MPs/neutrophil (n = 3, NS versus control, p < 0.05 versus air plus N2). Similarly, if cells were exposed to air plus 690 kPa of N2 along with 10 μm Scrmb-Nox2ds, an inactive control peptide, production was 3.31 ± 0.21 MPs/neutrophil (n = 4, p < 0.05 versus control, NS versus N2 alone), but MP production by cells exposed to air plus 690 kPa of N2 along with 10 μm Nox2ds, a membrane-permeable NOX inhibitor (30), was 0.19 ± 0.19 MPs/neutrophil (n = 3, NS versus control, p < 0.05 versus N2 alone). If cells were exposed to air plus 690 kPa of N2 along with 1 mm ebselen, a nonspecific antioxidant, production was 0.23 ± 0.23 MPs/neutrophil (n = 3, NS versus control, p < 0.05 versus N2 alone).
Microparticle Generation by Murine Cells
We were interested in evaluating murine neutrophils because of the body of work with mice exposed to decompression stress. We found that 30-min incubations at high gas pressures were insufficient to trigger MP production by murine cells, but if cells were exposed to gas pressures for 30 min and then monitored after decompression, MPs in the suspensions increased linearly for 4 h. Data with exposures to air and air plus 690 kPa of N2 are shown in Fig. 2.
FIGURE 2.
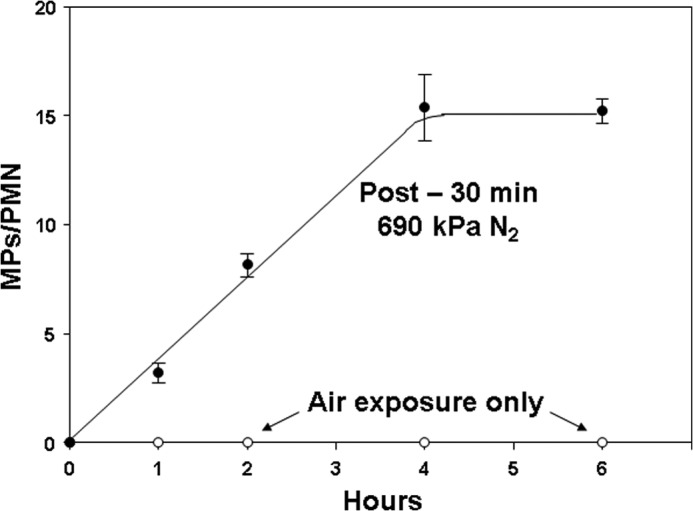
MP production by murine neutrophils exposed to only air or those first exposed to air plus 690 kPa of N2 for 30 min. Data show MPs/neutrophil in suspensions assayed at the times indicated. All post-N2 values other than time 0 are significantly different (p < 0.05) from air-exposed control samples (open circles). Data are mean ± S.E. (error bars) (n = 4–12).
We also examined MP production when cells were left at pressure for 4 h and fixed immediately upon decompression. Table 1 shows MPs/neutrophil and cell viability for cells following exposures for 30 min and 4 h. MP production rates per hour were statistically insignificantly different when cells were exposed to an inert gas continuously for 4 h or to gas pressure for just 30 min and then left at ambient pressure in air for the remainder of 4 h. The data also show that there were no significant differences in the viability of cells as compared with air/control incubations.
TABLE 1.
MP production by murine neutrophils exposed to pressure
MPs were counted in suspensions of neutrophils after exposures to 690 kPa of hydrostatic pressure (Hydro. Press.; cells placed in closed syringes and pressurized with no gas phase), helium, N2, or argon for 30 min or for 4 h. The upper portion of the table shows production rates for suspensions studied at time intervals up to 4 h after a 30-min exposure to pressure, and the lower portion of the table shows MPs/neutrophil in suspensions left at pressure continuously for 4 h and fixed immediately on decompression. Cell viability was assessed as trypan blue exclusion in suspensions at 4 h after the start of the exposure periods (no significant differences among samples). Data are mean ± S.E.; n = sample numbers (in parentheses).
| Exposure conditions | MP count | Viability at 4 h |
|---|---|---|
| % | ||
| 30 min air (24) | 0.3 × 10⁻³ ± 0.2 × 10⁻³/PMN/h | 85.3 ± 1.9 |
| 30 min Hydro. Press. (5) | 0.2 × 10⁻³ ± 0.3 × 10⁻³/PMN/h | 88.3 ± 2.0 |
| 30 min helium (5) | 1.01 ± 0.12/PMN/ha | 88.0 ± 0.6 |
| 30 min N2 (8) | 3.84 ± 0.21/PMN/ha,b | 85.8 ± 1.7 |
| 30 min argon (5) | 3.47 ± 0.22/PMN/ha,b | 82.7 ± 0.7 |
| 4 h air (8) | 0.0011 ± 0.0007/PMN at 4 h | 85.3 ± 1.9 |
| 4 h Hydro. Press (5) | 0.0008 ± 0.002/PMN at 4 h | 86.7 ± 1.9 |
| 4 h helium (4) | 3.9 ± 0.3/PMN at 4 ha | 86.8 ± 2.0 |
| 4 h N2 (8) | 15.3 ± 0.9/PMN at 4 ha,b | 85.7 ± 1.8 |
| 4 h argon (4) | 15.2 ± 0.9/PMN at 4 ha,b | 82.5 ± 1.6 |
a p < 0.05 versus air sample based on ANOVA.
b p < 0.05 versus helium based on ANOVA.
Results of studies performed with cells exposed to helium, N2, or argon at 690 kPa are shown in Table 1. Studies were also performed with cells exposed to 690 kPa of hydrostatic pressure (no gas phase) which caused no significant MP production versus that seen with air/control cells. As shown, helium pressure increased MP production but not to the same magnitude as N2 or argon pressure.
There was no loss of cells due to the various incubations. For example, neutrophil cell counts at 4 h in samples exposed to only air were 97.3 ± 5.1% (n = 8) of the counts at the start of the studies, and for samples exposed to 690 kPa of N2, the cell counts were 96.2 ± 1.4% (n = 4, NS). We conclude that, as with the human neutrophil studies, the MP production response was not due to apoptosis or to a physical perturbation, such as gas bubble formation and cell lysis related to decompression.
A dose response for MP production was identified when murine cells were exposed to a range of N2 pressures (Table 2, first column). Comparable with human neutrophil responses, MP production was inhibited if cells were incubated with ebselen, 1400W, or Nox2ds but not Scrmb-Nox2ds concurrent with gas pressure (see first two columns of Table 3).
TABLE 2.
Dose responses for murine neutrophils following N2 exposures
Data show MPs production as particles/neutrophil/hour by cells first exposed to air + various additional pressure of N2 for 30 minutes. iNOS indicates pmol of [3H] citrulline produced in 1 hour after cells were exposed to N2 pressure. NOX indicates rate of O2 consumption as μmol O2 × 10–3/min/1 × 106 neutrophils studied after 30 minute exposures to N2. Values were taken from the linear portion of consumption assays as shown in Figure 4.
| Air + kPa N2 | MPs/PMN/hr | iNOS | NOX |
|---|---|---|---|
| 0 | 0.0003 ± 0.0002 (24) | 0.19 ± 0.02 (21) | 1.37 ± 0.14 (11) |
| 186 | 0.08 ± 0.02 (4)* | 0.47 ± 0.12 (3)* | 1.95 ± 0.12 (4)* |
| 228 | 0.72 ± 0.10 (4)* | 0.73 ± 0.13 (7)* | 2.42 ± 0.23 (4)* |
| 345 | 1.14 ± 0.08 (8)* | 0.83 ± 0.22 (6)* | 3.57 ± 0.14 (4)* |
| 455 | 2.08 ± 0.41 (4)* | 1.45 ± 0.15 (3)* | 4.09 ± 0.28 (4)* |
| 690 | 3.84 ± 0.21 (8)*† | 1.76 ± 0.08 (24)*† | 5.00 ± 0.36 (10)*† |
*p < 0.05 versus 0 kPa N2 (air-exposed, control) in each column.
†Significantly different from 186 and 228 kPa values by ANOVA.
TABLE 3.
Impact of various agents on N2-mediated enhancement of MP production, iNOS activation, DCF-DA fluorescence, and FBE formation
Isolated murine neutrophils were exposed to air or air plus 690 kPa of N2. MPs/PMN reflects MP counts in suspensions first exposed to air versus 690 kPa of N2 for 30 min and then left in air at ambient pressure for 4-h incubations. NOS activity reflects pmol of [H3]citrulline produced when [H3]arginine was added immediately after 30-min air/N2 exposures, and cells were incubated for 1 h at ambient pressure in air. DCF fluorescence was assessed when DCF-DA was added to cell suspensions that were then exposed to air or 690 kPa of N2 for 10 min. Inhibitor values in the N2 column are all significantly different from N2 + PBS (p < 0.05). FBEs reflect pyrene actin fluorescence in arbitrary units/min in cells studied immediately after 30-min air or 690-kPa N2 exposures. All values are mean ± S.E. (n = number of independent trials (shown in parentheses)). KO, neutrophils from NOS-2 knock-out mice; 1400W, incubation with 1 mm 1400W during air/N2 exposure; Ebselen, incubation with 1 mm ebselen during the air/N2 exposure; UV, cells exposed to UV light for 5 min after the 30-min air/N2 exposure before readings taken; Cyto D, incubation with 5 μm cytochalasin D during the air/N2 exposure; Nox2ds, incubation with 10 μm Nox2ds during the air/N2 exposure; Scrmb-Nox2ds, incubations performed with 10 μm control, scrambled sequence peptide to Nox2ds; Rac-i, incubation with 50 μm NSC 23766 during the air/N2 exposure; Cont-si, cells incubated with control, scrambled sequence small inhibitory RNA for 24 h prior to the experiment; VASP-si, cells incubated with small inhibitory RNA to vasodilator-stimulated phosphoprotein for 24 h prior to the experiment; FAK-i, cells incubated with 20 μm PT 573228 during the air/N2 exposure; FAK-si, cells incubated with small inhibitory RNA to focal adhesion kinase for 24 h prior to the experiment; Flip-i, cells incubated with 200 μm SCH 28080 during the air/N2 exposure; Flip-si, cells incubated with small inhibitory RNA to flippase for 24 h prior to the experiment; Flop-i, cells incubated with 200 μm MK 571 during the air/N2 exposure; Flop-si, cells incubated with small inhibitory RNA to floppase for 24 h prior to the experiment; PDI-i, cells incubated with 30 μm quercetin-3-rutinoside during the air/N2 exposure, PDI-si, cells incubated with small inhibitory RNA to protein-disulfide isomerase for 24 h prior to the experiment; ND, no experiments performed with KO mice; fluor, fluorescence.
| Agent | MPs/PMN/h × 102 |
iNOS (pmol [H3]citrulline/h) |
DCF (fluor at 10 min × 10−1) |
FBEs (fluor/min) × 103 |
||||
|---|---|---|---|---|---|---|---|---|
| Air | N2 | Air | N2 | Air | N2 | Air | N2 | |
| PBS | 0.03 ± 0.02 (24) | 384 ± 21 (8)a | 0.19 ± 0.01 (21) | 1.76 ± 0.08 (24)a | 0.72 ± 0.09 (11) | 1213 ± 56.3 (12)a | 0.46 ± 0.05 (12) | 8.55 ± 0.40 (12)a |
| KO | 0.00 ± 0.00 (5) | 0.00 ± 0.00 (5) | 0 ± 0 (5) | 0.01 ± 0.03 (5) | ND | ND | 0.39 ± 0.06 (3) | 0.59 ± 0.16 (3) |
| 1400W | 0.00 ± 0.00 (4) | 0.13 ± 0.06 (5) | 0 ± 0 (8) | 0 ± 0 (8) | 0.93 ± 0.07 (3) | 74 ± 13.0 (3)a | 0.54 ± 0.12 (5) | 0.42 ± 0.08 (3) |
| Ebselen | 0.06 ± 0.02 (3) | 0.06 ± 0.04 (3) | 0.20 ± 0.001 (3) | 0.14 ± 0.04 (3) | 0.0 ± 0.0 (4) | 63.0 ± 48.1 (4) | 0.30 ± 0.01 (5) | 0.54 ± 0.12 (5) |
| UV | 0.02 ± 0.003 (4) | 0.05 ± 0.03 (4) | 0.20 ± 0.003 (5) | 0.10 ± 0.001 (4) | 0.95 ± 0.18 (3) | 100.4 ± 56.5 (3)a | 0.42 ± 0.02 (3) | 0.46 ± 0.11 (3) |
| Cyto D | 0.09 ± 0.003 (3) | 0.13 ± 0.06 (3) | 0.20 ± 0.008 (3) | 0.14 ± 0.05 (6) | 0.92 ± 0.19 (3) | 141.2 ± 30.3 (3)a | 0 ± 0 (3) | 0 ± 0 (3) |
| Nox2ds | 0.04 ± 0.02 (3) | 0.05 ± 0.03 (3) | 0.20 ± 0.001 (3) | 0.04 ± 0.01 (4) | 0.92 ± 0.19 (3) | 117.0 ± 48.4 (3)a | 0.40 ± 0.10 (4) | 0.53 ± 0.16 (4) |
| Scrmb-Nox2ds | 0.02 ± 0.003 (3) | 496 ± 12 (3)a | 0.18 ± 0.01 (3) | 1.57 ± 0.08 (5)a | 0.91 ± 0.22 (3) | 1139 ± 82.8 (4)a | 0.30 ± 0.02 (4) | 8.11 ± 0.25 (4)a |
| Rac-i | 0.08 ± 0.08 (3) | 0.16 ± 0.12 (3) | 0.21 ± 0.003 (4) | 0.31 ± 0.003 (4) | 0.0 ± 0.0 (4) | 76.0 ± 76.0 (4) | 0.34 ± 0.05 (5) | 0.41 ± 0.08 (4) |
| Cont-si | 0.03 ± 0.02 (4) | 405 ± 42 (4)a | 0.20 ± 0.001 (4) | 1.71 ± 0.04 (4)a | 0.81 ± 0.19 (4) | 1214 ± 51.1 (4)a | 0.44 ± 0.03 (4) | 8.61 ± 0.55 (4)a |
| VASP-si | 0.09 ± 0.17 (4) | 0.15 ± 0.07 (4) | 0.20 ± 0.001 (4) | 0.03 ± 0.001 (4) | 0.97 ± 0.22 (3) | 281.1 ± 81.4 (3)a | 0.40 ± 0.06 (3) | 0.57 ± 0.22 (3) |
| FAK-i | 0.04 ± 0.02 (3) | 0.07 ± 0.03 (3) | 0.20 ± 0.001 (3) | 0.18 ± 0.14 (3) | 1.00 ± 0.25 (3) | 236.8 ± 98.3 (3)a | 0.42 ± 0.04 (5) | 0.33 ± 0.03 (3) |
| FAK-si | 0.05 ± 0.02 (4) | 0.08 ± 0.04 (3) | 0.19 ± 0.002 (4) | 0.09 ± 0.002 (4) | 0.72 ± 0.12 (3) | 205.1 ± 58.3 (3)a | 0.40 ± 0.17 (3) | 0.67 ± 0.09 (3) |
| Flip-i | 0.07 ± 0.02 (3) | 0.16 ± 0.12 (3) | 0.20 ± 0.001 (4) | 0.19 ± 0.14 (4) | 4.2 ± 4.2 (4) | 45.8 ± 45.8 (4) | 0.42 ± 0.03 (3) | 0.35 ± 0.08 (3) |
| Flip-si | 0.02 ± 0.02 (4) | 0.06 ± 0.04 (4) | 0.20 ± 0.002 (3) | 0.16 ± 0.11 (4) | 0.98 ± 0.13 (3) | 222.4 ± 95.9 (3)a | 0.43 ± 0.03 (3) | 0.43 ± 0.03 (3) |
| Flop-i | 0.003 ± 0.01 (3) | 0.05 ± 0.02 (3) | 0.20 ± 0.001 (4) | 0.16 ± 0.11 (4) | 0.0 ± 0.0 (4) | 12.7 ± 33.9 (4) | 0.48 ± 0.09 (3) | 0.38 ± 0.06 (5) |
| Flop-si | 0.04 ± 0.04 (4) | 0.05 ± 0.04 (4) | 0.20 ± 0.001 (3) | 0.32 ± 0.16 (4) | 0.95 ± 0.10 (3) | 235.8 ± 97.3 (3)a | 0.47 ± 0.03 (3) | 0.53 ± 0.09 (3) |
| PDI-i | 0.02 ± 0.02 (3) | 0.01 ± 0.003 (3) | 0.19 ± 0.003 (4) | 0.24 ± 0.003 (4) | 0.57 ± 0.22 (3) | 146.0 ± 55.8 (3)a | 0.39 ± 0.04 (3) | 0.53 ± 0.12 (4) |
| PDI-si | 0.04 ± 0.03 (4) | 0.06 ± 0.06 (4) | 0.20 ± 0.003 (3) | 0.12 ± 0.10 (3) | 0.85 ± 0.14 (3) | 133.8 ± 17.8 (4)a | 0.41 ± 0.02 (3) | 0.30 ± 0.01 (3) |
a p < 0.05 versus air value.
An advantage with finding postdecompression MP production in murine cells was that manipulations could be made after 30-min gas exposures to further elucidate mechanisms. We found that MP production was inhibited when cells were exposed to UV light (which photo-reverses S-nitrosylated cysteine residues) for 5 min after 30-min exposures to 690 kPa of N2 (Table 3).
As was outlined in the Introduction, oxidative stress will modify neutrophil responses, and some are responses mediated by cytoskeletal modifications. If cells were incubated with cytochalasin D, with small chemical inhibitors to Rac or FAK concurrent with N2 exposure, or if cells were depleted of VASP or FAK by prior incubations with siRNA, MP production by N2 exposure was inhibited (Table 3).
Also as described in the Introduction, MP dynamics are controlled in part by enzymes that modify membrane lipids. N2-mediated MP production was abrogated by chemical inhibitors to the H+,K+-ATPase (flippase) or MRP-1 (floppase) and by depleting cells of these proteins with siRNA. Enhanced MP production was also inhibited by a chemical inhibitor to PDI and depleting PDI with siRNA. These studies were prompted because N2-mediated MP production is inhibited by Nox2ds but not Scrmb-Nox2ds. PDI is known to facilitate NOX activation (36).
NOS Activation
Activity of iNOS was monitored as [3H]citrulline production inhibitable by co-incubation with 1400W in murine cells permeabilized with OG to remove the need for active [3H]arginine transport. Fig. 3 shows [3H]citrulline production when [3H]arginine was added to cells that were then either left exposed to air at ambient pressure (control) or pressurized to 345 or 690 kPa of N2. At the indicated times, cells were decompressed, TCA was added immediately to stop the reaction, and measurements were taken (see “Experimental Procedures”). Enzyme activity was significantly enhanced by gas pressure, and activation with 345 kPa of N2 was roughly half that seen with 690 kPa. The dose-response pattern for iNOS activation after cells were exposed for 30 min to various pressures of N2 is shown in Table 2 (second column).
FIGURE 3.
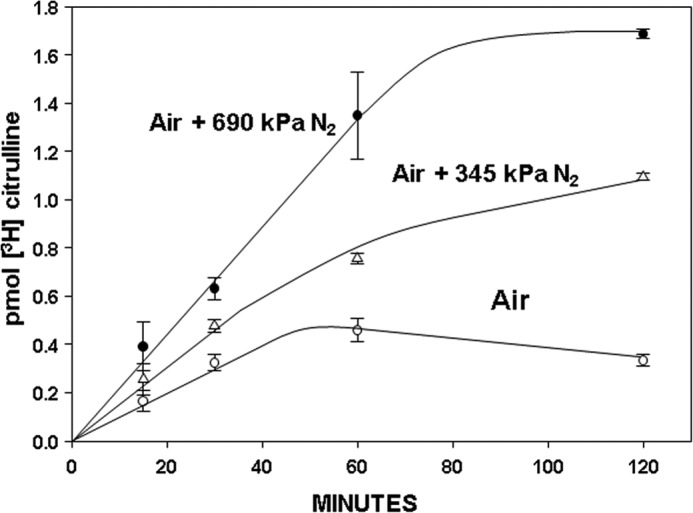
Activity of iNOS while murine neutrophils were exposed to air (control) or air plus 345 or 690 kPa of N2. Data show [3H]citrulline production as mean ± S.E. (error bars) (n = 3 for each 15, 30, and 120 min measurement, n = 5 for 60 min values) when [3H]arginine was added to 1.8 × 10⁵ neutrophils that were then pressurized or left exposed to ambient air. At the indicated times, cells were decompressed, TCA was added, and measurements were taken. At each time, N2 values are statistically significantly different from air/control, and the 60 and 120 min 345 kPa N2 values are statistically significantly different from the 690-kPa N2 values (p < 0.05, ANOVA).
If OG-permeabilized murine neutrophils were first exposed for 30 min to air plus 690 kPa of N2 and then [3H]arginine was added, the concentration of [3H]citrulline after incubation for 1 h was 1.76 ± 0.08 (n = 24) pmol, statistically insignificantly different from the amount produced if [3H]arginine was first added to cells that were then pressurized with 690 kPa of N2 for 1 h (Fig. 3). Moreover, if neutrophils were exposed for 30 min to air plus 690 kPa of N2, decompressed, and left in air at ambient pressure for the remainder of 4 h before adding [3H]arginine, the concentration of [3H]citrulline after incubation for an additional 1 h was 1.79 ± 0.18 (n = 8) pmol, also insignificantly different from the 1-h incubation shown in Fig. 3. We conclude, therefore, that iNOS remains activated for at least 4 h in neutrophils exposed for 30 min to 690 kPa of N2.
Enzyme activation with various inert gases followed a potency series similar to MPs production. Cells were exposed to various gases for 30 min, and then [3H]arginine was added for a 1-h incubation before quenching the reaction with TCA. The amount of [3H]citrulline in cells that had been exposed to 690 kPa of helium was 0.66 ± 0.11 pmol (n = 7, p < 0.05 versus air/control and 690 kPa of N2). Similar studies using argon resulted in 1.80 ± 0.21 pmol of [3H]citrulline (p < 0.05 versus air/control and helium; NS versus 690 kPa of N2).
Activation of iNOS occurs with formation of dimers. Total intracellular content of iNOS normalized to actin content was not altered by exposures to inert gases (data not shown). Analysis of iNOS dimers/actin in cell lysate Western blots exhibited a dose-response and gas potency series similar to the pattern of MP generation and [3H]citrulline production. Compared with the ratio of iNOS dimers/actin in air-exposed control cell lysates, the ratio in cells studied immediately after 30-min exposures to air plus 690 kPa of helium exhibited dimer content 1.15 ± 0.01-fold higher (n = 5, p < 0.05 versus air). Exposures to air plus 690 kPa of N2 increased dimers by 2.77 ± 0.22-fold (n = 10, p < 0.05 versus air and helium), whereas exposures to half the pressure, 345 kPa of N2, increased dimers by 1.24 ± 0.06-fold (n = 3, p < 0.05 versus air and 690 kPa of N2). Cells that had been exposed to air plus 690 kPa of argon had increased dimer content of 3.92 ± 0.35-fold (n = 5, p < 0.05 versus air and helium, NS versus 690 kPa of N2).
Using 690 kPa of N2 as the representative inert gas, we next evaluated the impact of a variety of manipulations to determine whether augmentation of iNOS activity in murine neutrophils is inhibited in the same manner as MP production. These data are shown in Table 3 (second column). If cells were co-incubated with ebselen during N2 exposure, iNOS activity was not enhanced. Importantly, in separate studies, we found that ebselen had no inhibitory effect on the activity of purified iNOS, and exposure to 690 kPa of N2 did not alter the activity of the purified enzyme (data not shown). Therefore, we conclude that intracellular inert gas-mediated events cause iNOS activation, and they were prevented by the antioxidant.
If cells were incubated with the NOX inhibitor Nox2ds during the N2 exposure or exposed to UV light immediately following N2 exposure, augmented iNOS activation was not identified (Table 3). Similarly, if cells were incubated with cytochalasin D or small chemical inhibitors to Rac or FAK concurrent with N2 exposure or if cells were depleted of VASP or FAK by siRNA incubations, iNOS activation was no longer increased by N2 exposure. Enzyme activation was also abrogated by inhibiting or depleting flippase, floppase, or PDI.
NADPH Oxidase Activation
The inhibitory effects of Nox2ds on gas pressure-induced MP production and iNOS activation strongly suggest a role for NOX. To examine this question more closely, cells were exposed to air plus 690 kPa of inert gas for 30 min and decompressed, and then O2 consumption was monitored. Fig. 4 shows the effects of air plus 690 kPa of helium, N2, or argon versus just ambient pressure air exposure and the impact of co-incubation with 10 μm Nox2ds during N2 exposure. Analysis of the linear portion of consumption assays was expressed as μmol of O2 consumed × 10−3/min/1 × 106 neutrophils, and the rate for air-exposed control cells was 1.37 ± 0.14 (n = 11). Hydrostatic pressure had no significant effect; the rate was 1.38 ± 0.15 (n = 3). The rate following helium exposure was 1.79 ± 0.13 (n = 4, p < 0.05 versus control). Rates for N2- and argon-exposed cells were, respectively, 5.00 ± 0.36 (n = 10) and 5.83 ± 0.35 (n = 5, for both p < 0.05 versus air and helium, no significant difference between the two gases). For cells exposed to air plus 690 kPa of N2 concurrent with 10 μm Scrmb-Nox2ds, the rate was 4.98 ± 0.24 (n = 3, p < 0.05 versus air/control, NS versus N2 alone) whereas when cells were co-incubated with air plus 690 kPa of N2 concurrent with 10 μm Nox2ds, the rate was 1.30 ± 0.08 (n = 3, NS versus air). Just as a dose response was observed for MP production and iNOS activation with progressively higher pressures of N2, a comparable pattern was observed for NOX activation (Table 2, third column).
FIGURE 4.
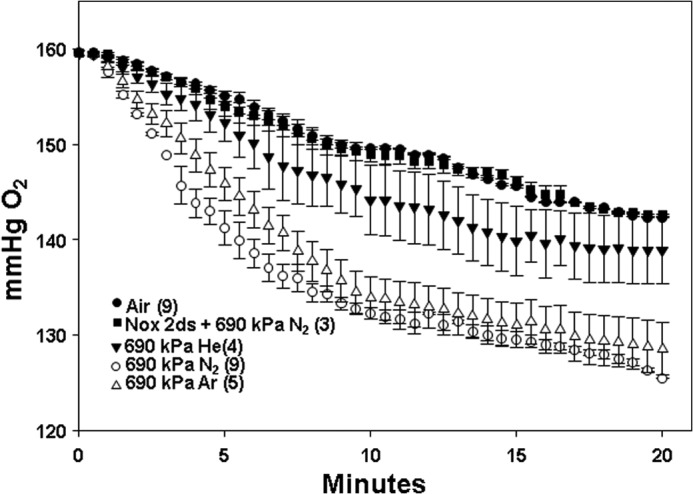
O2 consumption by murine neutrophils after 30-min exposures to air (control) or air plus 690 kPa of helium, N2, or argon. Data show changes in O2 partial pressure over 20 min in buffer containing 1.8 × 10⁵ cells studied immediately after cells had been exposed to the various inert gases as mean ± S.E. (error bars), with individual samples sizes as indicated (n). Also shown is the effect if cells were co-incubated with 10 μm Nox2ds while exposed to air plus 690 kPa of N2. Not shown, 10 μm Nox2ds had a similar effect of eliminating virtually all O2 consumption whether cells had been exposed to just air or air plus 690 kPa of helium or argon.
Because OG treatment was not required for O2 consumption measurements, in contrast to iNOS measurements, we could examine whether OG treatment altered inert gas-mediated NOX activation. In four replicate studies with cells exposed to air or air plus 690 kPa of N2 for 30 min, O2 consumption was 98 ± 2% (n = 4, NS) of that seen with cells that had not been subjected to OG permeabilization.
Fig. 2 demonstrates that MP production progresses for hours after exposure to high pressure gases. Similarly, iNOS remains active for at least 4 h following gas exposure. Therefore, we examined NOX activity in cells at intervals of time after they had been exposed to high pressure inert gases for 30 min. We found that the enhanced activity persisted for 4 h. For example, O2 consumption by cells exposed to air plus 690 kPa of N2 for 30 min and then left in air at ambient pressure for the remainder of 4 h before performing the assay was 3.25 ± 0.24 × 10⁻³ μmol/min/1 × 106 neutrophils (n = 6, p < 0.05 versus air/control), a decrement of ∼35% from consumption by cells studied immediately after decompression.
NOX activity could not be evaluated while cells were under pressure because a single gas pressure exposure destroys the electrode on decompression. Therefore, an alternative approach was taken to further evaluate reactive species production.
Reactive Species Generation
Membrane-permeable DCF-DA was added to murine neutrophil suspensions that were immediately pressurized for various times to 690 kPa of N2. Fig. 5 shows fluorescence measurements on decompression. There was a rapid rise in fluorescence that reached a plateau of 12,126 ± 563 (n = 12) fluorescence units at ∼10 min. The N2-mediated enhancement of DCF oxidation was decreased by 90% if cells were co-incubated with Nox2ds (Table 3).
FIGURE 5.
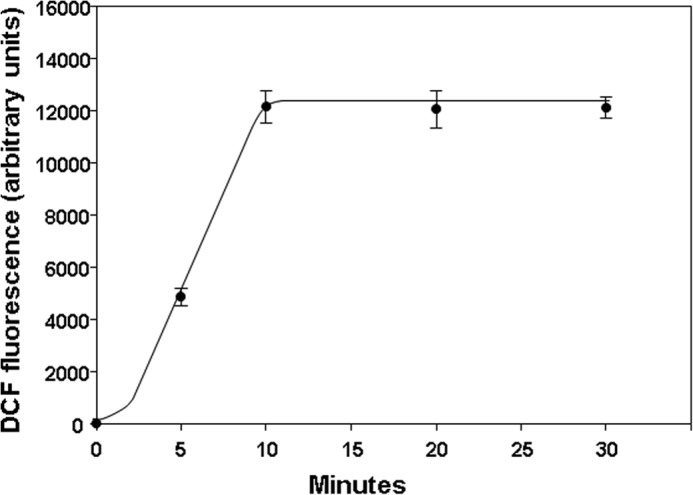
DCF fluorescence in murine neutrophils exposed to 690 kPa of N2. 10 μm DCF-DA was added to suspensions containing 1.8 × 10⁵ cells that were then pressurized to 690 kPa of N2 for the indicated times on the abscissa. Fluorescence was measured immediately after cells had been decompressed. Data are mean ± S.E. (error bars), n = 3–12 for each value.
In comparison with the marked elevation of fluorescence seen with cells exposed to air plus 690 kPa of N2, if DCF-DA was added to ambient air-exposed, control cell suspensions, the fluorescence signal increased linearly but reached a value of only 7.2 ± 0.9 (n = 11) fluorescence units at 10 min (see Fig. 6, significantly different from the response to 690 kPa of N2). When DCF-DA was added to cell suspensions that were then pressurized for 10 min with 690 kPa of helium, DCF fluorescence was 3,647 ± 345 (n = 3) units (p < 0.05 versus air/control and 690 kPa of N2). Similar studies using argon resulted in 14,238 ± 589 (n = 3) fluorescence units (p < 0.05 versus air/control and helium; NS versus 690 kPa of N2).
FIGURE 6.
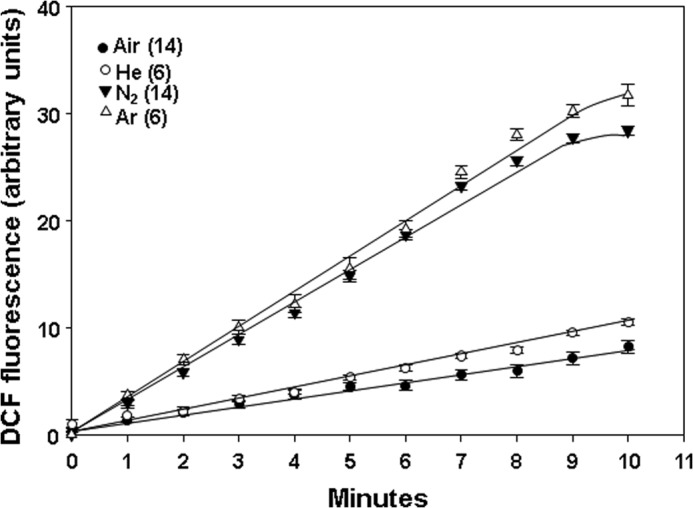
DCF fluorescence in murine neutrophils previously exposed for 30 min to air or air plus 690 kPa of helium, N2, or argon. Suspensions containing 1.8 × 10⁵ cells plus 10 μm DCF-DA were exposed to the indicated gas for 30 min and decompressed, and fluorescence was monitored for 10 min while cells were exposed to air at ambient pressure. Values show fluorescence subtracted from the value found when samples were first decompressed (e.g. as shown in the figure, each N2 value was subtracted by ∼12,126). Data are mean ± S.E. (error bars); individual sample sizes were as indicated (n).
We also found that when fluorescence was monitored for intervals of time after cells had been decompressed, there were persistently enhanced rates of DCF fluorescence, albeit at lower magnitudes than during gas exposures (Fig. 6). For all three gases, the rates of increase were significantly greater (p < 0.05) than for air-exposed, control cells. Rates for N2 and argon were significantly different from helium but not from each other.
Persistent production of reactive species could be demonstrated for hours after decompression. Thus, when cells were exposed to gas pressure for 30 min, decompressed, and left in air at ambient pressure for 4 h before adding DCF-DA, the same rates of DCF fluorescence elevations were observed as in Fig. 6. For example, as shown in Fig. 6, cells assayed immediately after exposure to air plus 690 kPa of N2 for 30 min exhibited a DCF fluorescence rate increase of 3.69 ± 0.18/min, whereas those decompressed and left on the bench for the remainder of 4 h exhibited an increase in fluorescence of 3.87 ± 0.46 fluorescence units/min (n = 5, p < 0.05 versus air, NS versus cells studied immediately after N2 exposure).
The plateau in fluorescence beyond ∼10 min of incubation while cells were under pressure (see Fig. 5) was not related to inadequate DCF-DA concentration because doubling the concentration did not cause further change in fluorescence signal (data not shown). Moreover, there was excess non-oxidized DCF available in the air-exposed, control cells. If 0.5 mm H2O2 was added to cells after the 10-min incubation, fluorescence increased by 72.0 ± 2.2% (n = 4).
Because studies with DCF-DA did not require OG permeabilization, we could also examine whether OG treatment altered inert gas-mediated reactive species production. Studies were done with cells subjected to the OG permeabilization procedure compared with those not permeabilized (we will refer to non-permeabilized cells as “normal”). Expressed as OG/normal cell DCF fluorescence, there were no significant differences in values seen after 10-min incubations or in the postdecompression increased rates of triplicate trials. For example, the mean value after 10-min incubations for air-exposed control cells was 108 ± 6%; after exposures to 690 kPa of helium, it was 98 ± 8%; after 690 kPa of N2, it was 99 ± 3%; and after 690 kPa of argon, it was 102 ± 6%.
We also evaluated the impact of a variety of manipulations on the rate of DCF-DA fluorescence using 690 kPa of N2 as the representative inert gas exposure (Table 3). If cells were exposed to UV light immediately following the N2 exposure, enhanced DCF fluorescence was significantly diminished. Similarly, if cells were incubated concurrent with N2 exposure with 1400W, ebselen, cytochalasin D, or small chemical inhibitors to Rac or FAK or if cells were depleted of VASP or FAK by siRNA incubations prior to N2 exposure, N2-mediated augmentation of reactive species production was decreased by ∼90%. Enhanced production was also significantly diminished by inhibiting or depleting flippase, floppase, or PDI.
Actin S-Nitrosylation in N2-exposed Cells
Identifying a role for iNOS and NOX with MP production suggests that reactive species produced by interactions between nitric oxide (•NO) and ROS are required. Many of the more highly reactive species can cause protein S-nitrosylation. S-Nitrosylation of murine neutrophil proteins was surveyed by the biotin switch assay, which covalently adds a disulfide-linked biotin to the labile S-nitrosylation sites on proteins. These studies were done with cells exposed to ambient air (control) and to air plus 690 kPa of N2 for 30 min. A Western blot probing for biotin-containing proteins in air/control and N2-exposed cells is shown in Fig. 7. In separate trials, the prominent band at ∼42 kDa was cut from nitrocellulose paper, subjected to amino acid sequencing, and identified as actin. If the biotin switch analysis was performed on cell lysates treated with N-[6-(biotinamido)hexyl]-3′-(2′-pyridyldithio)propionamide-biotin or with ascorbate (but not both) or with 1 mm HgCl2, the bands are not visualized (data not shown).
FIGURE 7.
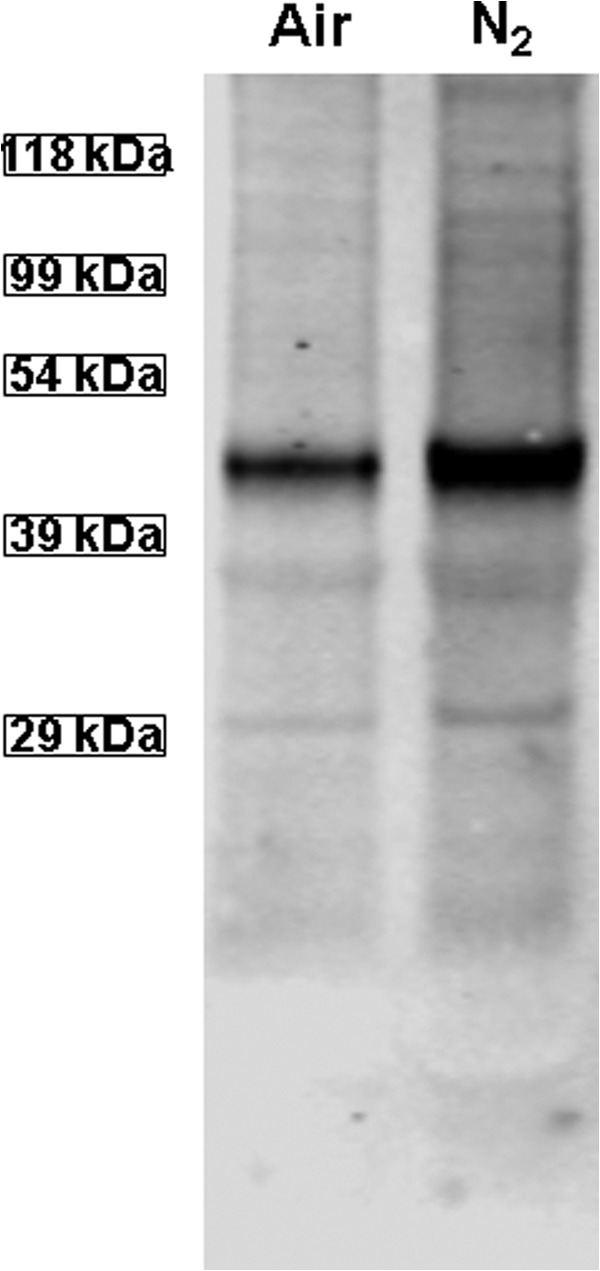
Western blot showing biotinylated proteins. Lysates of murine neutrophils exposed only to air or to air plus 690 kPa of N2 for 30 min were prepared according to the biotin switch assay. The entire gel is shown.
For serial studies, the magnitude of SNO-actin was evaluated by measuring the biotin band density normalized to blots assessing actin band density. As shown in Table 4, if cells were exposed to UV light prior to cell lysis and biotin switch or if during N2 exposure cells were incubated with 1400W, Nox2ds, or cytochalasin D, no significant elevations of SNO-actin were detected.
TABLE 4.
SNO actin/β-actin band density ratios from air- and 690-kPa N2-exposed neutrophils
Data reflect band densities on Western blots of lysates from cells exposed to air or air + 690 kPa of N2 for 30 min that had been subjected to the biotin switch procedure. PBS, cells incubated with buffer only during air/N2 exposure; UV, cells exposed to UV light for 5 min after air/N2 exposure. Other interventions involved incubation with 5 μm cytochalasin D, 1 mm 1400W, or 10 μm Nox2ds during air/N2 exposure. All values are mean ± S.E. (n = number of independent trials (shown in parentheses)).
| Incubation/intervention | Air | N2 |
|---|---|---|
| PBS | 1.00 ± 0.00 (5) | 2.50 ± 0.34 (5)a |
| UV | 1.03 ± 0.11 (3) | 1.07 ± 0.17 (3) |
| Cytochalasin D | 1.22 ± 0.04 (3) | 1.10 ± 0.05 (3) |
| Nox2ds | 0.99 ± 0.09 (3) | 1.08 ± 0.14 (3) |
| 1400W | 1.04 ± 0.04 (3) | 1.08 ± 0.09 (3) |
a p < 0.05 versus control.
Actin Polymerization in Permeabilized Neutrophils
The data generated thus far imply that inert gas-mediated MPs generation may involve a complex interaction that includes actin polymerization, given the inhibitory effects of cytochalasin D and perturbations of proteins such as VASP. Therefore, we next examined whether exposure to inert gases altered the dynamics of intracellular actin polymerization, assessed as free barbed end (FBE) formation. This was done with OG-permeabilized murine neutrophils incubated with pyrene-actin immediately following 30-min incubations in air (control) or air plus 690 kPa of helium, N2, or argon. Expressed as fluorescence elevation/min versus that measured for air-exposed control cells, the values for helium-exposed cells were 7.1 ± 1.2-fold higher (n = 4, p < 0.05 versus control); in N2-exposed cells, they were 18.6 ± 2.4-fold higher (n = 12, p < 0.05 versus control and helium); and for argon-exposed cells, they were 18.3 ± 2.7-fold higher (n = 4, p < 0.05 versus control and helium, NS versus N2).
We then evaluated the impact of various manipulations on rate of actin polymerization comparing ambient air-exposed and air plus 690-kPa N2-exposed cells (Table 3). If cells were incubated with 1400W, ebselen, or Nox2ds during N2 exposure or exposed to UV light immediately after the N2 incubation, actin turnover was restored to the control level. Similarly, if cells were incubated with small chemical inhibitors to Rac or FAK concurrent with N2 exposure or if cells were depleted of VASP or FAK by siRNA incubations prior to N2 exposure, actin turnover was no longer hastened by N2 exposure. Enhanced turnover was also abrogated by inhibiting or depleting flippase, floppase, or PDI.
Data in Fig. 2 indicate that MP production continues for over 4 h after N2 exposure. If OG-permeabilized cells were exposed for 30 min to air plus 690 kPa of N2, decompressed, and incubated in ambient air for the remainder of 4 h before adding pyrene-actin, the rate of fluorescence increase was 7.89 ± 0.66 (n = 3) × 103 units/min, comparable with the rate seen immediately after N2 exposure (Table 3).
Protein Cross-linking and Immunoprecipitation
The small chemical inhibitors and siRNA-mediated protein depletion effects outlined in Table 3, the biotin switch assay that identified S-nitrosylated actin (Fig. 7), and alterations in FBE formation implicate actin and its turnover as essential for MP production. Therefore, we were interested in evaluating associations of cytoplasmic actin with proteins exhibiting a role in MP production. After cells were exposed for 30 min to either air (control) or air plus 690 kPa of N2, they were treated with the membrane-permeable protein cross-linker DTSP and lysed 30 min later. Cell lysates were separated into Triton-soluble G-actin, short filamentous actin (sF-actin), and Triton-insoluble F-actin fractions. Blots were analyzed, looking for differences in protein band densities relative to actin and whether changes seen in the N2-exposed cells were abrogated by exposure to UV light for 5 min before DTSP incubations. A representative Western blot is shown in Fig. 8, and quantitative changes are outlined in Table 5. There were marked elevations in protein associations in the sF-actin fraction of N2-exposed cells. Rather than elevated ratios, we found reductions in the same protein associations of N2-exposed cells in G-actin and Triton-insoluble F-actin fractions, and these were, once again, abrogated by exposure to UV light (Table 5).
FIGURE 8.
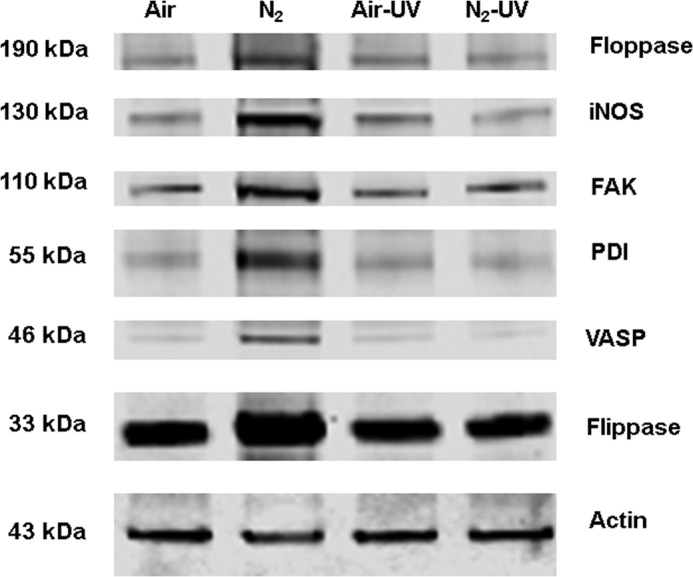
Protein associations in the Triton-soluble short F-actin fraction. Murine neutrophils were exposed to air (control) or air plus 690 kPa of N2 for 30 min. Where indicated, samples were then exposed to UV light for 5 min prior to the addition of DTSP to cross-link proteins and then fractioned based on Triton solubility (see “Experimental Procedures”) and subjected to Western blotting. This is a representative blot among five replicate experiments. Data based on the blots are shown in Table 4.
TABLE 5.
Protein associations assessed by DTSP cross-linking in sF-actin, G-actin, and Triton-insoluble actin fractions of neutrophils exposed to air (control) or for 30 min to 690 kPa of N2
Values are ratios calculated based on the band densities of the identified protein relative to the actin band density in each sample. In each section, the values are normalized to air-exposed control protein band ratios of individual experiments; thus, values greater than 1.0 reflect increases in protein associations with actin, whereas values less than 1.0 indicate lower protein associations. Where indicated, cells were exposed to UV light for 5 min prior to the addition of DTSP to cross-link proteins and then fractioned based on Triton solubility (see “Experimental Procedures”). Data are mean ± S.E. (n = 5 for all samples).
| VASP/actin | FAK/actin | iNOS/actin | Flip/actin | Flop/actin | PDI/actin | |
|---|---|---|---|---|---|---|
| sF-actin | ||||||
| 690 kPa of N2 | 4.68 ± 1.21a | 2.91 ± 0.39a | 2.79 ± 0.29a | 2.48 ± 0.45a | 3.28 ± 0.68a | 4.03 ± 0.43a |
| Air + UV | 1.10 ± 0.11 | 1.09 ± 0.08 | 1.22 ± 0.08 | 1.02 ± 0.07 | 1.19 ± 0.15 | 1.11 ± 0.04 |
| N2 +UV | 0.86 ± 0.11 | 0.96 ± 0.08 | 1.38 ± 0.37 | 1.01 ± 0.15 | 1.17 ± 0.26 | 0.88 ± 0.11 |
| G-actin | ||||||
| 690 kPa of N2 | 0.12 ± 0.05a | 0.19 ± 0.05a | 0.27 ± 0.08a | 0.17 ± 0.06a | 0.45 ± 0.13a | 0.36 ± 0.08a |
| Air + UV | 0.92 ± 0.05 | 0.99 ± 0.09 | 1.58 ± 0.43 | 0.87 ± 0.02 | 1.03 ± 0.22 | 1.08 ± 0.13 |
| N2 +UV | 0.89 ± 0.16 | 1.13 ± 0.19 | 1.45 ± 0.29 | 0.81 ± 0.14 | 1.07 ± 0.15 | 1.33 ± 0.24 |
| Triton-insoluble | ||||||
| 690 kPa of N2 | 0.16 ± 0.06a | 0.19 ± 0.06a | 0.22 ± 0.10a | 0.29 ± 0.09a | 0.35 ± 0.13a | 0.20 ± 0.03a |
| Air+ UV | 1.15 ± 0.22 | 1.14 ± 0.10 | 1.46 ± 0.27 | 1.56 ± 0.30 | 0.97 ± 0.01 | 0.96 ± 0.06 |
| N2 +UV | 0.916 ± 0.20 | 0.93 ± 0.17 | 0.94 ± 0.18 | 1.32 ± 0.22 | 1.03 ± 0.15 | 0.75 ± 0.13 |
a Values significantly different from normalized air-exposed control values (p < 0.05, ANOVA).
To further investigate potential protein associations, the sF-actin fraction was subjected to immunoprecipitation using anti-actin antibodies. As shown in Table 6, N2 exposure triggered several of the same protein associations with cytoplasmic actin that had been identified with DTSP cross-linking.
TABLE 6.
Immunoprecipitation of short F-actin fraction from lysates of murine neutrophils exposed to 690 kPa of N2 for 30 min versus those incubated in air (set as a protein/actin ratio = 1 for each experiment)
The short F-actin fraction was isolated from neutrophils and subjected to immunoprecipitation using antibodies to actin. Where indicated, cells were exposed to UV light for 5 min after air/N2 incubation and prior to lysis. Western blots were carried out, and data are expressed as the ratio of protein band densities versus actin band density for each lysate normalized to the ratio found with air-exposed (control) cells in each experiment; thus, values are normalized to 1.0 for air-exposed cells without UV exposure. Data are mean ± S.E. (n = 6).
| VASP/actin | FAK/actin | iNOS/actin | Flip/actin | Flop/actin | PDI/actin | |
|---|---|---|---|---|---|---|
| 690 kPa of N2 | 1.61 ± 0.24a | 2.15 ± 0.20a | 1.57 ± 0.34a | 1.38 ± 0.21 | 1.36 ± 0.41 | 0.99 ± 0.11 |
| N2 + UV | 0.88 ± 0.20 | 1.11 ± 0.14 | 1.19 ± 0.24 | 0.85 ± 0.20 | 1.49 ± 0.43 | 0.84 ± 0.09 |
| Control/UV | 1.17 ± 0.17 | 1.21 ± 0.19 | 1.13 ± 0.27 | 1.02 ± 0.11 | 0.96 ± 0.24 | 1.26 ± 0.11 |
a p < 0.05 ANOVA.
Singlet O2 Detection
The inciting event that initiates oxidative stress associated with inert gas exposures of neutrophils remained unclear. Because collision complexes between inert gases and O2 can generate singlet O2, we sought evidence that this may occur in the neutrophil suspensions (15, 16). Table 7 shows fluorescence associated with cells loaded with singlet oxygen sensor green prior to gas exposures. These data demonstrate the effects of gas pressure for 5 min. Exposures for just 5 min caused the same magnitude of fluorescence elevation as with cells exposed to gas for 30 min. No fluorescence was detected in cell suspensions exposed to air only for up to 30 min.
TABLE 7.
Singlet oxygen sensor green fluorescence in neutrophil suspensions after gas exposures
Cells were incubated with singlet oxygen sensor green for 30 min and then exposed to air plus the indicated gas for 5 min. Data show fluorescence (arbitrary units) after gas exposure. Data are mean ± S.E., and sample sizes are as shown. 690 kPa N2 and argon values are significantly different from 690 kPa of helium, SF6, and N2O, and all N2 values are significantly different from each other (ANOVA). n is shown in parentheses.
| Air | Air plus |
||||||
|---|---|---|---|---|---|---|---|
| 186 kPa of N2 | 345 kPa of N2 | 690 kPa of N2 | 690 kPa of argon | 690 kPa of helium | 690 kPa of SF6 | 690 kPa of N2O | |
| 0 ± 0 (26) | 441 ± 5 (3)a | 4,101 ± 260 (3)a | 6,237 ± 243 (11)a | 5,253 ± 259 (6)a | 1,309 ± 152 (6)a | 27 ± 84 (6) | 212 ± 97 (6)a |
a p < 0.05 versus air (ANOVA).
We found a dose-response pattern using a range of N2 pressures (Table 7). The efficiency of singlet O2 production by gas collision complexes depends on a number of variables (16). To discern differences in gas potency related more to characteristics such as gas van der Waals volume versus classical views on gas narcotic potency, studies were conducted with several different gases. Fluorescence followed the potency series argon ≃ N2 > helium, and nitrous oxide (N2O) and sulfur hexafluoride (SF6) generated scant singlet O2.
When cell suspensions were exposed to air plus 690 kPa of N2 in the presence of 2 mm azide or 1 mm ascorbate, agents that quench singlet O2, fluorescence was inhibited by 93.8 ± 2.2% (n = 3, p < 0.05) and 91.1 ± 2.8% (n = 6, p < 0.05), respectively (37, 38). A comparable magnitude of inhibition occurred with similar studies carried out using argon (data not shown). Consistent with these inhibitory effects, when azide or ascorbate was added to murine neutrophil suspensions prior to pressurization with air plus 690 kPa of N2 for 30 min, MP production after 4 h of incubation was not significantly different from control, air only-exposed samples. MPs in samples that included ascorbate were only 7.6 ± 9.9% (n = 3, NS) greater than control, and in azide-exposed samples, they were 13.7 ± 8.8% (n = 3, NS) greater than control. As may be expected, however, if ascorbate was added to suspensions after the 30-min exposure to 690 kPa of N2, there was no inhibition of MPs production in suspensions incubated for 4 h (data not shown).
Just as N2O and SF6 generated scant singlet O2, these gases did not stimulate MP production by neutrophils. At 4 h after cells had been exposed to air plus 690 kPa of N2O for 30 min, the MP count was increased by only 0.8 ± 2.3% (n = 8, NS) above control. MP counts after similar experiments using 690 kPa of SF6 yielded values 17.8 ± 6.3% (n = 8, NS) lower than control; thus, there were no elevations in MPs.
DISCUSSION
Study results demonstrate that MP generation by human and murine neutrophils occurs during exposures to high pressures of N2 or noble gases. A surprising difference with murine versus human neutrophils is the progressive generation of MPs over a 4-h interval, whether or not they remain at pressure beyond 30 min. What limits ongoing activity in human cells is not known. This report clearly shows that there are many components to MP production, thus offering numerous opportunities for regulatory control.
MP production is an oxidative stress response that requires iNOS and NOX activity. The dose response using N2 at various pressures is roughly linear for activation of both enzyme complexes (Table 2). The array of inhibitory interventions shown in Table 3 suggests an interdependence among cell processes. For example, exposure to 690 kPa of N2 increases actin polymerization, and inhibiting polymerization with cytochalasin D also inhibits enhanced MP formation, iNOS activation, and increased DCF fluorescence that involves NOX activation. This pattern leads us to conclude that perpetuation of MP production occurs due to an autocatalytic cycle. Fig. 9 illustrates the pathway supported by our observations.
FIGURE 9.

Schematic of proposed mechanism for gas-mediated MP generation by neutrophils. See “Discussion” for a detailed explanation. O2, O2 in air-saturated solutions; NOx, higher order reactive nitrogen species, such as nitrogen dioxide or peroxynitrite; Rac, Rac1 and -2 GTPases. FBEs, indicates FBEs as reflecting actin turnover. Manipulations used to verify a role for each protein include incubation of neutrophils with siRNA to decrease intracellular content of the protein proximal to each arrow. KO mice (iNOS knock-out mice) and the agents in boxes are inhibitors used to impede the indicated step in the cycle. Cyto D, cytochalasin D.
The event that initiates the oxidative stress cycle is shown in the top left of Fig. 9. ROS are generated by inert gas-O2 collision complexes. Collision-induced enhancement of singlet O2 production is influenced by molecular size of the collider species and gas polarizability; efficiency follows the series argon ≥ N2 >helium (15, 16). Physical properties of gases used in this study are shown in Table 8. Collider molecules with van der Waals volumes above 35 ml/mol are less efficient, which led to inclusion of studies with SF6 (39). The process also exhibits strong solvent dependence, anticipated to be greater in anhydrous intracellular spaces, as well as dependence on the mobility of electron density of the collider gas and its orbital overlay with O2 (markedly different between N2 and N2O) (15). The role for singlet O2 as the “spark” initiating the cyclic process in Fig. 9 is supported by the inhibitory effects of azide and ascorbate on N2-mediated MP generation.
TABLE 8.
| Gas | Mr | Van der Waals volume | Polarizability | Oil/gas partition coefficient |
|---|---|---|---|---|
| g/mol | ml/mol | 10−24 cm3 | ||
| Helium | 4 | 11.9 | 0.21 | 0.016 |
| N2 | 28 | 15.8 | 1.74 | 0.069 |
| Argon | 40 | 16.8 | 1.64 | 0.13 |
| N2O | 44 | 18.9 | 3.03 | 1.4 |
| SF6 | 146 | 46.8 | 6.54 | 0.293 |
Others have shown that singlet O2 can cause amino acid oxidation as well as nitration/nitrosylation (with nitrite addition), which could initiate the Fig. 9 cycle (40, 41). Although both azide and ascorbate are efficient singlet O2 scavengers, at the concentrations used here, they are poor scavengers for more highly reactive ROS, •NO, and agents such as peroxynitrite (42, 43). This is consistent with our finding that ascorbate was not an effective inhibitor of MP production if added after murine neutrophils were exposed to high N2 pressure.
The results indicate that neutrophils can be stimulated by compressed gases but not hydrostatic pressure to generate MPs. The potency series, argon ≃ N2 > helium also follows the well established Meyer-Overton narcotic series. In this paradigm, although N2 is not a noble gas, its place in the narcotic series is based on molecular size and oil/gas partition coefficient. SF6 exhibits a narcotic potency ∼8.5-fold greater than N2, whereas that for N2O is 39-fold greater (44). Our results clearly demonstrate that oxidative stress and MP production by compressed gases are not due to a narcotic effect.
Fig. 9 depicts a process that is centered on actin polymerization (depicted as FBEs in the figure), similar to one we reported in other studies, where S-nitrosylation drives a series of steps leading to excessive actin FBE turnover (24, 29). Exposures to high pressure N2 or noble gases trigger increased production of •NO from iNOS and ROS by NOX. Reactive nitrogen species, such as NO2 and peroxynitrite, are produced, which lead to SNO-actin formation, as documented by the biotin switch assay (Fig. 7). We have reported that VASP exhibits higher affinity for S-nitrosylated short actin filaments, which hastens actin polymerization (24, 29). VASP also bundles Rac proteins, PKA, and PKG in close proximity to short actin filaments, and subsequent Rac activation increases FBE formation. This process leads to increased linkage of FAK to short actin filaments. FAK mediates the association of iNOS with actin filaments, and as dimers form, enzyme activity increases (26).
One paradigm for MP formation involves exposure of phosphatidylserine on the cell surface as a consequence of translocation exerted by activated floppase(s) (45) with inhibition of flippase activity (46) and activation of scramblase by calcium influx (47, 48). Our results indicate that inhibition or depletion of flippase or floppase inhibits MP generation. In other words, perturbation of either enzyme impedes the process. Of even greater surprise was the finding that inhibiting these enzymes will obstruct FBE formation and the actin-based cycle involving reactive species production (Table 3). That is why a double-arrowed line was used in Fig. 9. Determination of how these enzymes influence actin turnover will require additional work.
The data indicate that filamentous actin formation is required for NOX activation, consistent with findings by others (49). The persistence of NOX activity and production of reactive species reflected by DCF fluorescence prompted our investigation of a role for PDI in MP formation. Data in Table 3 indicate an association between actin turnover (FBE formation), FAK, and reactive species production. How NOX could be activated in this ongoing process was unclear. FAK is known to influence NOX activity based on several studies, but a direct linkage between FAK and NOX is tenuous (50–52). There is precedence, however, for cytoskeletal perturbations modifying PDI activity, and oxidized PDI enhances NOX activity (53, 54). Our data indicate that the NOX enzyme complex is activated or repeatedly reactivated over the 4-h interval postdecompression by the cycle of events as shown in Fig. 9. Others have also reported a link between PDI and floppase/flippase triggering phosphatidylserine turnover (55).
Pressurization with air followed by decompression has been shown to cause neutrophil activation assessed as β2 integrin expression and degranulation, but the effect is mild compared with traditional cell activators, such as zymosan and phorbol ester (3, 56, 57). Similarly, in this study, NOX-mediated O2 consumption by cells exposed to high pressures of inert gas (Fig. 4) was on the order of just 13% of that reported with phorbol 12-myristate 13-acetate (57).
Whereas NOX activity is modest due to gas pressure, iNOS activity is quite robust. Moreover, iNOS activity was similar whether murine cells were under gas pressure (Fig. 3) or for up to 4 h after cells were exposed to N2 pressure. This similarity in enzyme activation has implications for evaluating mechanisms of reactive species production in the DCF-DA assay.
The magnitude of DCF fluorescence change while cells were exposed to high pressures of inert gas (Fig. 5) was several orders of magnitude higher than the rate of DCF fluorescence elevations seen after decompression (Fig. 6). This discrepancy obviously cannot be explained by differences in iNOS activity. NOX activity could not be monitored while cells were pressurized, but a 100-fold higher rate than measured after cells were decompressed is not physiologically feasible. Hence, enhanced production of agents capable of oxidizing DCF while cells were exposed to high pressure inert gases is out of proportion to the rate of primary ROS and •NO radical production. Augmentation of superoxide production could occur because of inert gas-O2 collision complex formation in the presence of an electron donor, similar to reactions described in ex vivo studies (18). These so-called three-body reactions have a large rate constant for electron capture compared with that corresponding to O2 itself due to van der Waals molecule formation (15, 17).
NOX and iNOS activity and elevated DCF fluorescence in murine neutrophils all persist for 4 h after 30-min exposures to high pressures of inert gas. We believe this persistence occurs because of ongoing actin turnover, as shown by the pyrene free barbed end assay. However, this does not explain why measured iNOS activity plateaus at about 1 h (Fig. 3), NOX activity diminishes over ∼10 min (Fig. 4), and the postdecompression rate of DCF fluorescence appears to plateau after ∼10 min (Fig. 6).
We suspect that limitations in the duration of these measurements are related to the dynamic nature of actin turnover. In other words, it is likely that at any given time postdecompression, only a fraction of the neutrophil population is generating reactive species at a rate that exceeds the antioxidant capacity of neutrophils to eradicate SNO-actin.
Using isolated proteins, an association between iNOS and filamentous actin mediated by FAK can be demonstrated, but progressive complex formation is impeded when actin becomes S-nitrosylated (26). Activity of iNOS is increased by an FAK-mediated association with actin filaments in these studies, but peak •NO production was transient due to actin S-nitrosylation (26). Hence, we hypothesize that once cells have been exposed to N2 or noble gases, the cycle as in Fig. 9 is perpetuated by vacillating levels of SNO-actin and reactive species formation in neighboring cells. The diminution of NOX activity after ∼10 min postdecompression could also be due to actin filament generation, which contributes to enzyme complex disassembly (57).
DCF fluorescence is related both to iNOS and to NOX activation based on the various interventions/inhibitors described in Table 3. Results in Fig. 5 require some added discussion, however. We believe that the 10 min required for fluorescence to reach a plateau when DCF-DA was added to cells occurs because this is the time required for probe uptake to reach a steady state. A similar profile with a 10-min plateau was reported when isolated cardiac myocytes were incubated with DCF-DA (58). In that study, saponin permeabilization was shown not to cause DCF leakage from cells because of mitochondrial sequestration. A similar sequestration may explain why OG permeabilization had no significant effect on DCF fluorescence in our study.
The precise role for cytoskeletal modifications impacting MPs dynamics is poorly understood, but, as was mentioned in the Introduction, cytoskeletal instability is known to trigger platelet MP production (14). Our data clearly demonstrate the requirement for actin polymerization, and, as shown by the cross-linking studies in Fig. 8 and Table 5, an array of proteins are in proximity to short actin filaments in response to gas exposures. Immunoprecipitation studies did identify statistically significant associations between short actin filaments, iNOS, FAK, and VASP, but not with flippase, floppase, and PDI. Because associations were apparent based on the DTSP cross-linking studies (indicating that proteins were within a proximity of ∼12 Å (35)), either these interactions are weak and tenuous, or (more likely) there is no direct association of these proteins with actin filaments.
The cyclical mechanism proposed in Fig. 9 may be still more complex than shown, and additional studies are needed. We have reported an association among FAK, actin turnover, and thioredoxin reductase, and thioredoxin reductase is reported to enhance PDI activity (25, 59). Thioredoxin reductase depletion did not have a consistent effect on inert gas-mediated MP production, however (data not shown), so its role is not clear, and it is possible that thioredoxin reductase has greater impact on SNO-actin removal as in prior studies (25).
Identifying SNO-actin in N2-exposed neutrophils raises questions regarding immune responses. S-Nitrosylation of multiple actin cysteine residues impairs β2 integrin adherence (24, 29). Immunocompromise is not known to occur with deep sea diving, leading us to believe that protein modifications differ from those associated with high pressure O2 exposures. This may be reflected by the rather nominal magnitude of NOX activation, as discussed above, and this issue, too, will require added study.
This study was prompted by observations associating MPs with DCS (3, 4, 6–9). DCS is assumed to occur because of gas bubbles arising from an excess of inert gas somewhere in the body, but little is known about the properties of gases under high pressure in tissues or about how bubbles develop. Murine studies suggest that MPs are nucleation sites for bubble formation, and our new finding that gas pressure activates iNOS lends further support to this view (7). Human neutrophils exposed to ∼186 kPa or more generate MPs. This is remarkably close to the threshold pressure of 135 kPa where endogenous bubbles are observed in humans after decompression (60). Also consistent with our findings, predictive response curves for DCS in rodents exhibit differences in potencies among the inert gases (argon > N2 > helium) (61).
Human cells produce MPs at a faster rate than murine neutrophils, at least for 30-min exposures. Just as we find that MP generation rates differ, there are also species differences in propensity for DCS development. This has been suggested to arise because of differences in susceptibility rather than a fundamental difference in the nature of DCS pathophysiology (62). Humans are more sensitive to its development than are mice. The N2 “dose” required to produce 50% incidence of DCS across seven species has been suggested to be related to body weight, with smaller animals better able to eliminate excess inert gas due to faster circulation times and higher metabolism (63). Alternatively, whether differences in DCS susceptibility occur because of MP production rates is a testable hypothesis for future studies.
MPs are generated by neutrophils at inert gas pressures commonly experienced by human divers; 186 kPa is equivalent to the pressure of 18.6 meters of sea water. Hence, the biochemical responses we identified do have practical relevance. Whether cell types other than neutrophils exhibit similar responses to gas pressure needs to be investigated.
MP dynamics in humans are influenced by exercise and the O2 partial pressure of the breathing mixture, which adds complexity to the interactions (3, 4). Although the relationship between MPs and DCS remains obscure, the mechanism described by this work offers an explanation for increases in neutrophil-derived MPs observed in mice and humans exposed to high pressures (3, 4, 6). The cascade of inflammatory responses triggered by MPs and activation of iNOS in particular may also offer some explanation for why the onset of DCS symptoms can be delayed for many h after decompression (7–9, 64).
More broadly, there is poor understanding regarding the ability of noble gases to trigger an oxidative stress response that others have shown to improve ischemic tolerance (65, 66). Generation of singlet O2 offers a common initiation point for what may be several advanced mechanisms. Our findings also suggest that high pressure inert gasses can provide a method for deep tissue singlet O2 production that heretofore has only been achieved in superficial tissue cancer therapy using photosensitizers and visible light (67). Further work with this perspective is warranted.
This work was supported by a grant from the Office of Naval Research.
- DCS
- decompression sickness
- MP
- microparticle
- ROS
- reactive oxygen species
- iNOS
- inflammatory/inducible nitric-oxide synthase
- kPa
- kilopascal(s)
- SNO-actin
- S-nitrosylation of cytosolic actin
- VASP
- vasodilator-stimulated phosphoprotein
- FAK
- focal adhesion kinase
- PDI
- protein-disulfide isomerase
- OG
- n-octyl-β-glucopyranoside
- DCF-DA
- 2,7-dihydrodichlorofluorescein diacetate
- DCF
- 2,7-dihydrodichlorofluorescein
- ANOVA
- analysis of variance
- NS
- not significant
- NOX
- NADPH oxidase
- FBE
- free barbed end
- PMN
- polymorphonuclear neutrophil
- DTSP
- dithiobis(succinimidyl propionate).
REFERENCES
- 1. Vince R. V., McNaughton L. R., Taylor L., Midgley A. W., Laden G., Madden L. A. (2009) Release of VCAM-1 associated endothelial microparticles following simulated SCUBA dives. Eur. J. Appl. Physiol. 105, 507–513 [DOI] [PubMed] [Google Scholar]
- 2. Madden L. A., Chrismas B. C., Mellor D., Vince R. V., Midgley A. W., McNaughton L. R., Atkin S. L., Laden G. (2010) Endothelial function and stress response after simulated dives to 18 msw breathing air or oxygen. Aviat. Space Environ. Med. 81, 41–45 [DOI] [PubMed] [Google Scholar]
- 3. Thom S. R., Milovanova T. N., Bogush M., Bhopale V. M., Yang M., Bushmann K., Pollock N. W., Ljubkovic M., Denoble P., Dujic Z. (2012) Microparticle production, neutrophil activation and intravascular bubbles following open-water SCUBA diving. J. Appl. Physiol. 112, 1268–1278 [DOI] [PubMed] [Google Scholar]
- 4. Thom S. R., Milovanova T. N., Bogush M., Yang M., Bhopale V. M., Pollock N. W., Ljubkovic M., Denoble P., Madden D., Lozo M., Dujic Z. (2013) Bubbles, microparticles and neutrophil activation: changes with exercise level and breathing gas during open-water SCUBA diving. J. Appl. Physiol. 114, 1396–1405 [DOI] [PubMed] [Google Scholar]
- 5. Pontier J. M., Gempp E., Ignatescu M. (2012) Blood platelet-derived microparticles release and bubble formation after an open-sea dive. Appl. Physiol. Nutr. Metab. 37, 888–892 [DOI] [PubMed] [Google Scholar]
- 6. Thom S. R., Yang M., Bhopale V. M., Huang S., Milovanova T. N. (2011) Microparticles initiate decompression-induced neutrophil activation and subsequent vascular injuries. J. Appl. Physiol. 110, 340–351 [DOI] [PubMed] [Google Scholar]
- 7. Thom S. R., Yang M., Bhopale V. M., Milovanova T. N., Bogush M., Buerk D. G. (2013) Intra-microparticle nitrogen dioxide is a bubble nucleation site leading to decompression-induced neutrophil activation and vascular injury. J. Appl. Physiol. 114, 550–558 [DOI] [PubMed] [Google Scholar]
- 8. Yang M., Milovanova T. N., Bogush M., Uzun G., Bhopale V. M., Thom S. R. (2012) Microparticle enlargement and altered surface proteins after air decompression are associated with inflammatory vascular injuries. J. Appl. Physiol. 112, 204–211 [DOI] [PMC free article] [PubMed] [Google Scholar]
- 9. Yang M., Kosterin P., Salzberg B. M., Milovanova T. N., Bhopale V. M., Thom S. R. (2013) Microparticles generated by decompression stress cause central nervous system injury manifested as neurohypophiseal terminal action potential broadening. J. Appl. Physiol. 115, 1481–1486 [DOI] [PMC free article] [PubMed] [Google Scholar]
- 10. Enjeti A. K., Lincz L. F., Seldon M. (2008) Microparticles in health and disease. Semin. Thromb. Hemost. 34, 683–691 [DOI] [PubMed] [Google Scholar]
- 11. Pirro M., Schillaci G., Bagaglia F., Menecali C., Paltriccia R., Mannarino M. R., Capanni M., Velardi A., Mannarino E. (2008) Microparticles derived from endothelial progenitor cells in patients at different cardiovascular risk. Atherosclerosis 197, 757–767 [DOI] [PubMed] [Google Scholar]
- 12. Morel O., Jesel L., Freyssinet J. M., Toti F. (2011) Cellular mechanisms underlying the formation of circulating microparticles. Arterioscler. Thromb. Vasc. Biol. 31, 15–26 [DOI] [PubMed] [Google Scholar]
- 13. Freyssinet J. M., Toti F. (2010) Formation of procoagulant microparticles and properties. Thromb Res. 125, S46–S48 [DOI] [PubMed] [Google Scholar]
- 14. Cauwenberghs S., Feijge M. A., Harper A. G., Sage S. O., Curvers J., Heemskerk J. W. (2006) Shedding of procoagulant microparticles from unstimulated platelets by integrin-mediated destabilization of actin cytoskeleton. FEBS Lett. 580, 5313–5320 [DOI] [PubMed] [Google Scholar]
- 15. Hild M., Schmidt R. (1999) The mechanism of the collision-induced enhancement of the radiative transitions of oxygen. J. Phys. Chem. A 103, 6091–6096 [Google Scholar]
- 16. Minaev B. F., Kobzev G. I. (2003) Response calculations of electronic and vibrational transitions in molecular oxygen induced by interaction with noble gases. Spectrochim. Acta A Mol. Biomol. Spectrosc. 59, 3387–3410 [DOI] [PubMed] [Google Scholar]
- 17. Shimamori H., Hotta H. (1984) Mechanism of thermal electron attachment to O|2: isotope effect studies with 18O|2 in rare gases and some hydrocarbons. J. Chem. Phys. 81, 1271–1276 [Google Scholar]
- 18. Thom S. R. (1992) Inert gas enhancement of superoxide radical production. Arch. Biochem. Biophys. 295, 391–396 [DOI] [PubMed] [Google Scholar]
- 19. Thom S. R., Marquis R. E. (1984) Microbial growth modification by compressed gases and hydrostatic pressure. Appl. Environ. Microbiol. 47, 780–787 [DOI] [PMC free article] [PubMed] [Google Scholar]
- 20. Thom S. R., Marquis R. E. (1987) Free radical reactions and the inhibitory and lethal actions of high-pressure gases. Undersea Biomed. Res. 14, 485–501 [PubMed] [Google Scholar]
- 21. Bitterman N., Laor A., Melamed Y. (1987) CNS oxygen toxicity in oxygen-inert gas mixtures. Undersea Biomed. Res. 14, 477–483 [PubMed] [Google Scholar]
- 22. Brauer R. W., Beaver R. W. (1982) Synergism of hyperoxia and high helium pressures in the causation of convulsions. J. Appl. Physiol. 53, 192–202 [DOI] [PubMed] [Google Scholar]
- 23. Arieli R., Ertracht O., Oster I., Vitenstein A., Adir Y. (2005) Effects of nitrogen and helium on CNS oxygen toxicity in the rat. J. Appl. Physiol. 98, 144–150 [DOI] [PubMed] [Google Scholar]
- 24. Thom S. R., Bhopale V. M., Yang M., Bogush M., Huang S., Milovanova T. (2011) Neutrophil β-2 integrin inhibition by enhanced interactions of vasodilator stimulated phosphoprotein with S-nitrosylated actin. J. Biol. Chem. 286, 32854–32865 [DOI] [PMC free article] [PubMed] [Google Scholar]
- 25. Thom S. R., Bhopale V. M., Milovanova T. N., Yang M., Bogush M. (2012) Thioredoxin reductase linked to cytoskeleton by focal adhesion kinase reverses actin S-nitrosylation and restores neutrophil β-2 integrin function. J. Biol. Chem. 287, 30346–30357 [DOI] [PMC free article] [PubMed] [Google Scholar]
- 26. Thom S. R., Bhopale V. M., Milovanova T. N., Yang M., Bogush M., Buerk D. G. (2013) Nitric oxide synthase-2 linkage to focal adhesion kinase in neutrophils influences enzyme activity and β-2 integrin function. J. Biol. Chem. 288, 4810–4818 [DOI] [PMC free article] [PubMed] [Google Scholar]
- 27. Pagel P. S., Krolikowski J. G., Pratt P. F., Jr., Shim Y. H., Amour J., Warltier D. C., Weihrauch D. (2008) The mechanism of helium-induced preconditioning: a direct role for nitric oxide in rabbits. Anesth. Analg. 107, 762–768 [DOI] [PMC free article] [PubMed] [Google Scholar]
- 28. Gharib B., Hanna S., Abdallahi O. M. S., Lepidi H., Gardette B., DeReggi M. (2001) Anti-inflammatory properties of molecular hydrogen: investigation on parasite-induced liver inflammation. Life Sci. 324, 719–724 [DOI] [PubMed] [Google Scholar]
- 29. Thom S. R., Bhopale V. M., Mancini D. J., Milovanova T. N. (2008) Actin S-nitrosylation inhibits neutrophil β-2 integrin function. J. Biol. Chem. 283, 10822–10834 [DOI] [PubMed] [Google Scholar]
- 30. Csányi G., Cifuentes-Pagano E., Al Ghouleh I., Ranayhossaini D. J., Egaña L., Lopes L. R., Jackson H. M., Kelley E. E., Pagano P. J. (2011) Nox2 B-loop peptide, Noxds, specifically inhibits the NADPH oxidase Nox2. Free Radic. Biol. Med. 51, 1116–1125 [DOI] [PMC free article] [PubMed] [Google Scholar]
- 31. Glogauer M., Hartwig J., Stossel T. (2000) Two pathways through Cdc42 couple the N-formyl receptor to actin nucleation in permeabilized human neutrophils. J. Cell Biol. 150, 785–796 [DOI] [PMC free article] [PubMed] [Google Scholar]
- 32. Daniliuc S., Bitterman H., Rahat M. A., Kinarty A., Rosenzweig D., Lahat N., Nitza L. (2003) Hypoxia inactivates inducible nitric oxide synthase in mouse macrophages by disrupting its interaction with α-actinin 4. J. Immunol. 171, 3225–3232 [DOI] [PubMed] [Google Scholar]
- 33. Klatt P., Schmidt K., Lehner D., Glatter O., Bächinger H. P., Mayer B. (1995) Structural analysis of porcine brain nitric oxide synthase reveals a role for tetrahydrobiopterin and L-arginine in the formation of an SDS-resistant dimer. EMBO J. 14, 3687–3695 [DOI] [PMC free article] [PubMed] [Google Scholar]
- 34. Gollmer A., Arnbjerg J., Blaikie F. H., Pedersen B. W., Breitenbach T., Daasbjerg K., Glasius M., Ogilby P. R. (2011) Singlet oxygen sensor green: photochemical behavior in solution and in a mammalian cell. Photochem. Photobiol. 87, 671–679 [DOI] [PubMed] [Google Scholar]
- 35. Hüttelmaier S., Mayboroda O., Harbeck B., Jarchau T., Jockusch B. M., Rüdiger M. (1998) The interaction of the cell-contact proteins VASP and vinculin is regulated by phosphatidylinositol-4,5-bisphosphate. Curr. Biol. 8, 479–488 [DOI] [PubMed] [Google Scholar]
- 36. de A Paes A. M., Veríssimo-Filho S., Guimarães L. L., Silva A. C., Takiuti J. T., Santos C. X., Janiszewski M., Laurindo F. R., Lopes L. R. (2011) Protein disulfide isomerase redox-dependent association with p47phox: evidence for an organizer role in leukocyte NADPH oxidase activation. J. Leukoc. Biol. 90, 799–810 [DOI] [PubMed] [Google Scholar]
- 37. Li M. Y., Cline C. S., Koker E. B., Carmichael H. H., Chignell C. F., Bilski P. (2001) Quenching of singlet molecular oxygen(1O2) by azide anion in solvent mixtures. Photochem. Photobiol. 74, 760–764 [DOI] [PubMed] [Google Scholar]
- 38. Kramarenko G. G., Hummel S. G., Martin S. M., Buettner G. R. (2006) Ascorbate reacts with singlet oxygen to produce hydrogen peroxide. Photochem. Photobiol. 82, 1634–1637 [DOI] [PMC free article] [PubMed] [Google Scholar]
- 39. Bondi A. (1964) van der Waals volumes and radii. J. Phys. Chem. 68, 441–451 [Google Scholar]
- 40. Pecci L., Montefoschi G., Antonucci A., Costa M., Fontana M., Cavallini D. (2001) Formation of nitrotyrosine by methylene blue photosensitized oxidation of tyrosine in the presence of nitrite. Biochem. Biophys. Res. Commun. 289, 305–309 [DOI] [PubMed] [Google Scholar]
- 41. von Montfort C., Sharov V. S., Metzger S., Schöneich C., Sies H., Klotz L. O. (2006) Singlet oxygen inactivates protein tyrosine phosphatase-1B by oxidation of the active site cysteine. Biol. Chem. 387, 1399–1404 [DOI] [PubMed] [Google Scholar]
- 42. Jackson T. S., Xu A., Vita J. A., Keaney J. F. (1998) Ascorbate prevents the interaction of superoxide and nitric oxide only at very high physiological concentrations. Circ. Res. 83, 916–922 [DOI] [PubMed] [Google Scholar]
- 43. Di Mascio P., Briviba K., Sasaki S. T., Catalani L. H., Medeiros M. H., Bechara E. J., Sies H. (1997) The reaction of peroxynitrite with tert-butyl hydroperoxide produces singlet molecular oxygen. Biol. Chem. 378, 1071–1074 [PubMed] [Google Scholar]
- 44. Ostlund A., Linnarsson D., Lind F., Sporrong A. (1994) Relative narcotic potency and mode of action of sulfur hexafluoride and nitrogen in humans. J. Appl. Physiol. 76, 439–444 [DOI] [PubMed] [Google Scholar]
- 45. Bell R. M., Ballas L. M., Coleman R. A. (1981) Lipid topogenesis. J. Lipid Res. 22, 391–403 [PubMed] [Google Scholar]
- 46. Wehman A. M., Poggioli C., Schweinsberg P., Grant B. D., Nance J. (2011) The P4-ATPase TAT-5 inhibits the budding of extracellular vesicles in C. elegans embryos. Curr. Biol. 21, 1951–1959 [DOI] [PMC free article] [PubMed] [Google Scholar]
- 47. Bevers E. M., Williamson P. L. (2010) Phospholipid scramblase: an update. FEBS Lett. 584, 2724–2730 [DOI] [PubMed] [Google Scholar]
- 48. Bevers E. M., Comfurius P., Dekkers D. W., Zwaal R. F. (1999) Lipid translocation across the plasma membrane of mammalian cells. Biochim. Biophys. Acta 1439, 317–330 [DOI] [PubMed] [Google Scholar]
- 49. Brandes R. P., Weissmann N., Schröder K. (2014) Nox family NADPH oxidases in mechano-transduction: mechanisms and consequences. Antioxid. Redox. Signal. 20, 887–898 [DOI] [PMC free article] [PubMed] [Google Scholar]
- 50. Alfonso P., Dolado I., Swat A., Nuñez A., Cuadrado A., Nebreda A. R., Casal J. I. (2006) Proteomic analysis of p38α mitogen-activated protein kinase-regulated changes in membrane fractions of RAS-transformed fibroblasts. Proteomics 6, S262–S271 [DOI] [PubMed] [Google Scholar]
- 51. Chapple S. J., Cheng X., Mann G. E. (2013) Effects of 4-hydroxynonenal on vascular endothelial and smooth muacle cell redox signaling and function in health and disease. Redox. Biol. 1, 319–331 [DOI] [PMC free article] [PubMed] [Google Scholar]
- 52. Kasorn A., Alcaide P., Jia Y., Subramanian K. K., Sarraj B., Li Y., Loison F., Hattori H., Silberstein L. E., Luscinskas W. F., Luo H. R. (2009) Focal adhesion kinase regulated pathogen-killing capability and life span of neutrophils via mediating both adhesion-dependent and -independent cellular signals. J. Immunol. 183, 1032–1043 [DOI] [PMC free article] [PubMed] [Google Scholar]
- 53. Pescatore L. A., Bonatto D., Forti F. L., Sadok A., Kovacic H., Laurindo F. R. (2012) Protein disulfide isomerase is required for platelet-derived growth factor-induced vascular smooth muscle cell migration, Nox1 NADPH oxidase expression, and RhoGTPase activation. J. Biol. Chem. 287, 29290–29300 [DOI] [PMC free article] [PubMed] [Google Scholar]
- 54. Santos C. X., Stolf B. S., Takemoto P. V., Amanso A. M., Lopes L. R., Souza E. B., Goto H., Laurindo F. R. (2009) Protein disulfide isomerase (PDI) associates with NADPH oxidase and is required for phagocytosis of Leishmania chagasi promastigotes by macrophages. J. Leukoc. Biol. 86, 989–998 [DOI] [PubMed] [Google Scholar]
- 55. Popescu N. I., Lupu C., Lupu F. (2010) Extracellular protein disulfide isomerase regulates coagulation on endothelial cells through modulation of phosphatidylserine exposure. Blood 116, 993–1001 [DOI] [PMC free article] [PubMed] [Google Scholar]
- 56. Allen D. B., Maguire J. J., Mahdavian M., Wicke C., Marcocci L., Scheuenstuhl H., Chang M., Le A. X., Hopf H. W., Hunt T. K. (1997) Wound hypoxia and acidosis limit neutrophil bacterial killing mechanisms. Arch. Surg. 132, 991–996 [DOI] [PubMed] [Google Scholar]
- 57. Jandl R. C., André-Schwartz J., Borges-DuBois L., Kipnes R. S., McMurrich B. J., Babior B. M. (1978) Termination of the respiratory burst in human neutrophils. J. Clin. Invest. 61, 1176–1185 [DOI] [PMC free article] [PubMed] [Google Scholar]
- 58. Swift L. M., Sarvazyan N. (2000) Localization of dichlorofluorescin in cardiac myocytes: implications for assessment of oxidative stress. Am. J. Physiol. Heart Circ. Physiol. 278, H982–H990 [DOI] [PMC free article] [PubMed] [Google Scholar]
- 59. Tomazzolli R., Serra M. D., Bellisola G., Colombatti M., Guella G. (2006) A fluorescence-based assay for reductase activity of protein disulfide isomerase. Anal. Biochem. 350, 105–112 [DOI] [PubMed] [Google Scholar]
- 60. Eckenhoff R. G., Olstad C. S., Carrod G. (1990) Human dose-response relationship for decompression and endogenous bubble formation. J. Appl. Physiol. 69, 914–918 [DOI] [PubMed] [Google Scholar]
- 61. Lillo R. S., Parker E. C. (2000) Mixed gas model for predicting decompression sickness in rats. J. Appl. Physiol. 89, 2107–2116 [DOI] [PubMed] [Google Scholar]
- 62. Flynn E. T., Lambertsen C. J. (1971) Calibration of inert gas exchange in the mouse. in Proceedings of the Fourth Symposium on Underwater Physiology (Lambertsen C. J., ed) pp. 179–191, Academic Press, Inc., New York [Google Scholar]
- 63. Berghage T. E., McCraken T. M. (1979) Equivalent air depth: fact or fiction. Undersea Biomed Res. 6, 379–384 [PubMed] [Google Scholar]
- 64. Vann R. D., Butler F. K., Mitchell S. J., Moon R. E. (2011) Decompression illness. Lancet 377, 153–164 [DOI] [PubMed] [Google Scholar]
- 65. Sanders R. D., Ma D., Maze M. (2010) Argon neuroprotection. Crit. Care 14, 117. [DOI] [PMC free article] [PubMed] [Google Scholar]
- 66. David H. N., Haelewyn B., Rouillon C., Lecoq M., Chazalviel L., Apiou G., Risso J. J., Lemaire M., Abraini J. H. (2008) Neuroprotective effects of xenon: a therapeutic window of opportunity in rats subjected to transient cerebral ischemia. FASEB J. 22, 1275–1286 [DOI] [PubMed] [Google Scholar]
- 67. Agostinis P., Berg K., Cengel K. A., Foster T. H., Girotti A. W., Gollnick S. O., Hahn S. M., Hamblin M. R., Juzeniene A., Kessel D., Korbelik M., Moan J., Mroz P., Nowis D., Piette J., Wilson B. C., Golab J. (2011) Photodynamic therapy of cancer: an update. CA Cancer J. Clin. 61, 250–281 [DOI] [PMC free article] [PubMed] [Google Scholar]
- 68. Weast R. C. (ed) (1984) Handbook of Chemistry and Physics, 65th Ed., p. D-191, CRC Press, Inc., Boca Raton, FL [Google Scholar]
- 69. Miller S. L., Eger E. I., 2nd, Lundgren C. (1969) Anaesthetic potency of CF4 and SF6 in dogs. Nature 221, 468–469 [DOI] [PubMed] [Google Scholar]