

Background: PIP2 has been reported to enhance Ca2+-driven gating, but the molecular determinants of this interplay are not known.
Results: PIP2 interacts with specific basic residues and enhances Ca2+ gating through the αA-KDRDD-αB structural elements.
Conclusion: The RCK1 Ca2+-binding site is coupled to PIP2.
Significance: PIP2 is a key element in the regulation of BK channel activity.
Keywords: Calcium-binding Protein, Gating, Membrane Lipid, Molecular Modeling, Potassium Channel, BK Channel, Ca2+, KDRDD Loop, PIP2, RCK1
Abstract
Big or high conductance potassium (BK) channels are activated by voltage and intracellular calcium (Ca2+). Phosphatidylinositol 4,5-bisphosphate (PIP2), a ubiquitous modulator of ion channel activity, has been reported to enhance Ca2+-driven gating of BK channels, but a molecular understanding of this interplay or even of the PIP2 regulation of this channel's activity remains elusive. Here, we identify structural determinants in the KDRDD loop (which follows the αA helix in the RCK1 domain) to be responsible for the coupling between Ca2+ and PIP2 in regulating BK channel activity. In the absence of Ca2+, RCK1 structural elements limit channel activation through a decrease in the channel's PIP2 apparent affinity. This inhibitory influence of BK channel activation can be relieved by mutation of residues that (a) connect either the RCK1 Ca2+ coordination site (Asp367 or its flanking basic residues in the KDRDD loop) to the PIP2-interacting residues (Lys392 and Arg393) found in the αB helix or (b) are involved in hydrophobic interactions between the αA and αB helix of the RCK1 domain. In the presence of Ca2+, the RCK1-inhibitory influence of channel-PIP2 interactions and channel activity is relieved by Ca2+ engaging Asp367. Our results demonstrate that, along with Ca2+ and voltage, PIP2 is a third factor critical to the integral control of BK channel activity.
Introduction
The high conductance potassium (Maxi K, Big K, or BK) channel is activated by both membrane depolarization and increased intracellular Ca2+ concentrations ([Ca2+]i). Although Ca2+ and voltage are thought to act independently to regulate channel opening, a weak allosteric interaction between them makes the voltage sensor movement much more effective (1–4). The Slo1 pore-forming subunits of BK channels are composed of seven transmembrane segments (S0–S6) that assemble into tetramers. The S1–S4 transmembrane region of the Slo1α subunit forms a voltage-sensing domain, as in other voltage-gated channels, whereas the large C-terminal intracellular ligand-binding domain is responsible for sensing Ca2+ (5–13). Association of the Slo1α subunit with tissue-specific two-transmembrane β1–β4 subunits modifies its functional characteristics (14). The BK channel is expressed in a wide variety of tissues, most notably in the brain and smooth muscle-containing organs, but also among other tissues in reproductive organs (ovary, testes), in the pancreas, and in adrenal glands (15). In humans, malfunction of the BK channel is known to be important to the pathophysiology of epilepsy (16–19), hypertension (20–24), cancer (25–28), and asthma (29).
The Slo1 cytosolic domain is composed of two RCK (regulator of K+ conductance) domains, RCK1 and RCK2 (30). The first Ca2+-binding site identified was in a region termed the Ca2+-bowl that contains a series of Asp residues located in the RCK2 domain (6) (also see Fig. 1, B, C (left), and D (bottom)). The second Ca2+-binding site was identified in the RCK1 domain at position Asp367 (Fig. 1, A and D (top), shows Asp367 in the KDRDD loop in yellow) (10). Subsequently, the side chain of Glu535 (Fig. 1C, right) was reported to be a part of the RCK1 Ca2+ coordination site together with Asp367 (31). High-resolution crystal structures of the cytosolic domain have been obtained either with the RCK2 Ca2+-bowl occupied by Ca2+ (PDB3 code 3MT5) (32) or in the absence of Ca2+ (PDB code 3NAF) (33). Ca2+ has not yet been resolved in the RCK1 site, although the side chains of Asp367 and Glu535 are positioned such that they could coordinate Ca2+ (Fig. 1C, right, 3NAF structure). Interestingly, in the presence of Ca2+ in the Ca2+-bowl, Asp367 and Glu535 point away from each other, such that they could not possibly coordinate Ca2+ (Fig. 1C, left, 3MT5 structure). Despite these structural advances in the Ca2+-sensing cytosolic domains, the lack of a full-length structure that includes the transmembrane domains as well as the lack of the RCK1 Ca2+-bound state have precluded a structural understanding of how the channel is gated by either voltage or Ca2+ and how the weak allosteric coupling between these two gating mechanisms greatly enhances channel activation.
FIGURE 1.

RCK structural elements involved in Ca2+ sensing in Slo1 channels; relation to PIP2 revealed by docking. A, sequence with secondary structure elements of the mouse Slo1α channel following the S6 inner helix and through the βC strand of the RCK1 domain. The KDRDD loop (Lys366–Asp370) is highlighted in yellow, and the Lys392/Arg393 residues, which communicated directly with PIP2, are shown in red. B, sequence with secondary structure elements containing the Ca2+-bowl in the RCK2 domain. The Ca2+-bowl (Asp897–Asp901) is shown in green. C, structural models of Slo1 incorporating crystal structures of cytosolic domains in the presence and absence of Ca2+. Left, ribbon structures of two subunits of the mSlo1α subunit are shown, one in gray and the other in gold, whereas the RCK2 domain of the gray subunit has been highlighted in green (the other two subunits have been removed for clarity). This model was built based on the 3MT5 (cytosolic domain of Slo1 with the Ca2+-bowl occupied (32)) and 2R9R (Kv1.2-Kv2.1 chimeric channel (56)) coordinates. PIP2 headgroup (diC1) docking simulations were performed on this model, using Autodock. 100 docking runs were conducted to yield 100 conformations of diC1-channel complex. Each red dot represents the C1 atom of diC1, which indicates the location of diC1 in the complexes. Most PIP2 headgroups were located nearest the S4-S5 linker, the RCK2 Ca2+-bowl coordination site is circled (in red), and a Ca2+ ion is shown (in blue). Right, the same process as on the left but using the 3NAF coordinates (cytosolic domain of Slo1 in the absence of Ca2+ (33)). In this figure, all 100 positions of diC1 from the docking simulation result are shown (red dots). Most PIP2 headgroups were located closest to the αB residues Lys392 and Arg393. In addition, the binding energy from Autodock indicated that diC1 showed the most favorable binding energy in the 3NAF model. The putative RCK1 Ca2+ coordination site, showing the critical residues Asp367 and Glu535 pointing toward each other, is circled (in red). D, the RCK1 structural elements that harbor the KDRDD loop containing Asp367 with its two neighboring basic residues (top) and the RCK2 structural elements that comprise the Ca2+-bowl with five critical Asp residues directly coordinate the Ca2+ ion (bottom).
Phosphatidylinositol 4,5-bisphosphate (PIP2), which has been shown to activate most ion channels and transporters (34, 35), has also been reported to directly activate BK channels by a single study (36). PIP2 was found to enhance Ca2+-driven gating by increasing mean open time and decreasing mean closed time kinetics. The PIP2-induced activation was also found to be potentiated by the β1 but not by the β4 accessory channel subunits. These PIP2 effects were found to be relevant in vascular myocytes, possibly contributing to the BK control of vascular tone.
We set out to investigate the structural determinants of the Ca2+-dependent PIP2 regulation of Slo1α activity. We expressed the mSlo1α channel in Xenopus oocytes and mainly used inside-out macropatches to study regulation of its activity by PIP2. Increases in [Ca2+]i enhanced the apparent affinity for PIP2 through the Ca2+ coordination residue Asp367 in the KDRDD loop. Furthermore, in the absence of [Ca2+]i, it became clear that Asp367 as well as its two flanking basic residues, Lys366 and Arg368 (Fig. 1A), served to inhibit channel activation by decreasing the apparent affinity for PIP2. These results suggested that the KDRDD loop exerted an inhibitory effect on channel activation through PIP2. Mutagenesis results showed that this coupling proceeded from the KDRDD loop through the αA helix to the αB helix (Fig. 1D, top). PIP2 docking simulations with the two available crystal structures and mutagenesis identified two basic residues in the αB helix, Lys392 and Arg393, as critical elements in the coordination of PIP2 (Fig. 1C, right). These results suggest that PIP2 could serve in the role of allosterically coupling the cytosolic RCK1 structural elements (KDRDD loop, αA and αB helices) to the membrane-gating elements of the channel.
EXPERIMENTAL PROCEDURES
Mutagenesis and Channel Expression
Mouse Slo1 (mSlo1) cDNA was a gift from the laboratory of Dr. Christopher Lingle (Washington University, St. Louis, MO), of which the vector pXMX was designed to promote expression or increase RNA stability (10, 37–39). All mutations were generated by Pfu-based mutagenesis using the QuikChangeTM kit and verified by sequencing. cRNA was transcribed using the MessageMachine kit SP6 (Ambion) and injected into Xenopus laevis oocytes (0.3–5 ng/oocyte), depending on the expression level of the given channel protein. X. laevis oocytes were harvested and used for cRNA injection as described previously (40–42). Currents were normally recorded within ∼2 weeks.
Electrophysiology
Macroscopic currents were recorded from standard excised inside-out patches with an A-M 2400 patch clamp amplifier (A-M Systems, Inc.). pClamp (Molecular Devices) was used to drive stimulus protocols and digitize currents. The signals were low pass-filtered at 10 kHz and digitized at 20-μs intervals. The pipette solution contained 140 mm KMES (methanesulfonate), 20 mm KOH, 10 mm HEPES, 2 mm MgCl2, pH 7.0. The composition of internal solution of 0 μm [Ca2+]i to bathe the cytoplasmic face of patch membranes contained 140 mm KMES, 20 mm KOH, 10 mm HEPES, 5 mm EGTA, pH 7.0. The free [Ca2+] in nominal 0 μm [Ca2+]i solution was presumably about 0.5 nm. To obtain the conductance-voltage (G-V) curves in different [Ca2+]i, currents were elicited by voltage pulses from −180 to 200 mV (20 ms) at 10-mV increments, whereas the voltages before and after the pulses were held at −120 mV. In 0 [Ca2+]i, currents were elicited by voltage pulses from −100 to 300 mV or to 380 mV for some mutants (8 ms) at 10-mV increments, unless otherwise mentioned, whereas the voltages before and after these pulses were held at −100 mV.
BK single-channel currents were recorded from oocytes under the standard inside-out patch configuration. The solutions in the pipette and bath were the same as used in macroscopic current recordings except that 2 mm MgCl2 and[Ca2+]i concentrations were changed as indicated. Activity rundown in different intracellular [Ca2+]i was measured 20–30 min following excision at the indicated voltage. 10 μm PIP2 was perfused from the intracellular side (bath solution), and its effect was measured 5 min later when the BK channel activity reached steady state. Preparation of different [Ca2+] solutions was as described previously (37, 43).
Whole-cell currents in Xenopus oocytes were recorded by conventional two-electrode voltage clamp as described previously (40). Recordings were performed with a GeneClamp500 amplifier (Axon Instruments) 3–5 days after cRNA injection. Electrodes were filled with 1.5% (w/v) agarose in 3 m KCl. The bath was perfused with the same solution as that used in the pipette solution for inside-out patches. Microelectrodes had a resistance of 0.3–1.0 megaohms.
Wortmannin (Wtmn) treatment involved incubation of oocytes for 2–2.5 h before recording. In experiments with intact oocytes, intracellular Ca2+ levels were controlled by application of 2 nm ionomycin in the bath that contained different Ca2+ concentrations. Data acquisition and analysis were carried out using pClamp9 (Molecular Devices) and Origin (Microcal) software.
Data Analysis
The relative conductance was determined by measuring the steady-state current amplitudes at the indicated voltages. The G-V curves were fitted with the Boltzmann function,
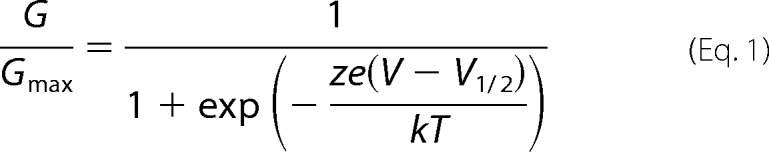 |
where G/Gmax is the ratio of conductance to maximal conductance, z is the number of equivalent charges, e is the elementary charge, V is membrane potential, and V½ is the voltage where G/Gmax reaches half of the maximum. k is Boltzmann's constant, and T is the absolute temperature.
Data in all figures are expressed as mean ± S.E. Statistical significance was evaluated by Student's t test, and p < 0.05 was considered significant.
Homology Modeling
The crystal structures of Kv1.2/2.1 (PDB code 2R9R), hSlo1 (PDB code 3MT5 for the Ca2+-bowl-occupied model, and 3NAF for the Ca2+-bowl-free model) were used as templates to develop homology models for the mSlo1 channel. In order to build the homology model of mSlo1, we first constructed a hybrid model template composed of the Kv1.2/Kv2.1 structure and of the hSlo1 3NAF structure. The structure of the Kv1.2/Kv2.1 S1–S6 was docked onto the hSlo1 structure based on the orientation of the four BK linkers. We then used the fused crystal structure templates (Kv1.2/2.1 transmembrane domains) and mSlo1 channel (GI: 347144) for sequence alignment using the ClustalW server (44), followed by minor manual adjustments in non-homologous regions.
We also built an mSlo1 model based on the 3MT5 crystal structure of hSlo1. Because 3MT5 was crystallized as a monomer and did not contain the BK linker, we used the 2R9R-3NAF structure to construct the hybrid template of 2R9R-3MT5. The 3MT5-based homology model of mSlo1 was then built based on the hybrid template of 2R9R-3MT5. Homology models of the mSlo1 channel were generated using the MODELLER program (45).
PIP2 and Slo1 Docking
We used the AUTODOCK program (46) to dock the PIP2 headgroup into the mSlo1 model structures. The grid-based potential maps that were generated for the mSlo1 channel, using CHNOP (i.e. carbon, hydrogen, nitrogen, oxygen, and phosphorus) elements, sampled on a uniform grid containing 100 × 70 × 100 points, were 0.375 Å apart for the free energy calculations. The grid box was centered at the side chain of residue Arg393 of mSlo1, which was found by our functional studies to be important for PIP2 sensitivity. The Lamarckian genetic algorithm was used to identify the docking conformations of the PIP2 headgroup. 100 docking simulations were performed. The final docked PIP2 headgroup configurations were selected based on docked binding energies and cluster analysis. Two potential binding sites of mSlo1 channel for PIP2 were identified by docking simulations, formed by positively charged residues Lys392 and Arg393.
Chemicals
diC8 PIP2 and PIP2 antibody (PIP2 Ab) were purchased from Avanti Polar Lipids. Other chemicals, such as Wtmn, ionomycin, Mg-ATP, and polylysine (poly-K+) were purchased from Sigma-Aldrich. Stocks and working solutions were prepared using protocols according to the manufacturer's instructions.
RESULTS
Slo1 Channels Are PIP2-sensitive
Consistent with the conclusions of Vaithianathan et al. (36), we also found that Slo1 channels expressed in Xenopus oocytes are PIP2-sensitive. Scavenging of endogenous PIP2 with a combination of poly-K+ and PIP2 Ab in excised patches or treatment with micromolar concentrations of Wtmn in intact cells caused significant inhibition of Slo1 currents (Fig. 2A). Wtmn is known to block the activity of most phosphatidylinositol 3-kinases at nanomolar concentrations. 100 nm Wtmn showed no effect on BK currents (Fig. 2, Aa and Ac). In contrast, 25 μm wortmannin, which also blocks phosphatidylinositol 4-kinases, thus reducing resynthesis of PIP2 to the plasma membrane, showed strong inhibition of BK currents (Fig. 2, Ab and Ac). Moreover, direct application of PIP2, in excised patches that had been previously treated with a combination of polylysine and PIP2 antibody to deplete endogenous PIP2, showed robust current reactivation (Fig. 2B). PIP2 altered the voltage-dependent activation kinetics of Slo1 currents. 300 μm PIP2 showed faster activation kinetics than 10 μm PIP2, especially at depolarizations to less positive potentials (Fig. 2, Ca and Cb).
FIGURE 2.

Slo1 channels are sensitive to PIP2. Aa, effect of a 2-h preincubation with 100 nm Wtmn on Slo1 currents. Current traces were evoked by a voltage ramp protocol (top) ranging from −100 to +160 mV (1 s), using whole-cell (two-electrode voltage clamp) recordings in oocytes. Ab, same as in Aa but preincubated with 25 μm Wtmn. Ac, summary bar graphs from Aa and Ab. Ba, time course recording of Slo1 current amplitude of an inside-out macropatch recording from Xenopus oocytes injected with mSlo1 channels. Slo1 current in 100 μm [Ca2+]i was inhibited by PIP2 scavengers PIP2 Ab (1–2:1000) + poly-K+ (300 μg/ml) but was reactivated by exogenous application of 30 μm PIP2. Bb, representative traces for Slo1 currents recorded at the time points indicated by numbers (1–3, color-coded) in Ba. Current traces were evoked by the voltage step protocol shown above. Inset, tail currents expanded. Bc, normalized G-V curves for Slo1 in 30 μm [Ca2+]i showing the reactivation of Slo1 channels by PIP2 following current inhibition by PIP2 Ab (1–2:1000) + 300 μg/ml poly-K+. Ca, the actual macroscopic current traces were recorded in the presence of 10 μm (black) or 300 μm PIP2 (purple). Voltage was stepped from a holding potential of −100 mV to +150 mV and then back to −100 mV. The current trace in 10 μm PIP2 was rescaled to have the same peak amplitude with that in 300 μm PIP2 (purple). Inset, tail currents expanded. [Ca2+]i = 0 μm. Cb, activation time constants by 10 μm (□) or 100 μm (○) PIP2 following depletion of endogenous PIP2 by PIP2 scavengers (PIP2 Ab (1–2:1000) + poly-K+ (300 μg/ml). Error bars indicate mean ± S.E.
Rundown of Slo1 Unitary Currents and Reactivation by PIP2
Single channel recordings in the inside-out mode of the patch clamp technique held at +40 mV in [Ca]i = 100 μm showed high open probability (Po = 0.88; Fig. 3, A and D) immediately after excision. Under these conditions, no significant rundown of activity was seen, and 10 μm PIP2 did not enhance further channel activity. In contrast, if the patch was held at −40 mV, activity showed significant rundown, and diC8-PIP2 stimulated activity significantly in a reversible manner (Fig. 3, B and E). This enhanced sensitivity to PIP2 of channel activity in more depolarized membranes has been described for other channels (e.g. TRPM8 (47)). In 10 μm [Ca2+]i concentrations, rundown and reversible reactivation by PIP2 were highly significant (Fig. 3, C and F). At 1 μm [Ca2+]i, we observed even stronger rundown both at +40 and +80 mV (data not shown). Interestingly, 10 μm diC8-PIP2 was not enough to reactivate this channel at either +40 or +80 mV, suggesting again a further decrease in PIP2 sensitivity with a decrease in Ca2+ concentration. However, a higher diC8-PIP2 concentration (40 μm) could partially reactivate BK channel activity at +80 mV (data not shown). Collectively, the experiments in Figs. 2 and 3 demonstrate the PIP2 dependence of Slo1 current activation.
FIGURE 3.

Rundown of unitary activity and PIP2 reactivation. A, unitary currents obtained upon excision (Control), rundown (>20 min following inside-out patch excision), PIP2 (5 min later after channel activation reached steady state), and washout in 100 μm Ca2+. Solid line, channel closed level (labeled as C); 1 and 2, number of open channel current levels. Po for each current is indicated above the trace. V = +40 mV. B, same as in A but held at −40 mV. C, same as in A, but in 10 μm Ca2+. D, averaged NPo responses to rundown, PIP2, and washout at +40 mV in 100 Ca2+. E, same as in D but at −40 mV; F, same as in D but in 10 μm Ca2+ (n = 3–6). #, p < 0.05; *, p < 0.01; **, p < 0.005. Error bars indicate mean ± S.E.
Ca2+ Binding to the Asp367 Site Enhances PIP2 Affinity
We first compared the apparent affinity of the Slo1-WT channel to PIP2 in solutions containing no added Ca2+ (assumed to be ∼0.5 nm and referred to as 0 Ca2+) and in the presence of 100 μm [Ca2+]i. In 0 Ca2+, the V½ of Slo1 was 173 mV (n > 10). In contrast, in 100 μm Ca2+, the V½ was shifted to ∼−7.8 mV (n > 6) (Fig. 4A). G-V relationships were constructed at different concentrations of diC8-PIP2 after inhibition with poly-K+ and PIP2 Ab (just as shown in Fig. 2B), and the relative conductance values at +170 mV (for 0 Ca2+) (Fig. 4B) or at −10 mV (for 100 μm Ca2+) (Fig. 4C) were plotted as a function of the PIP2 concentration tested (Fig. 4D). In the presence of 100 μm [Ca2+]i, the Slo1 channel's apparent affinity to PIP2 increased ∼2-fold relative to 0 μm [Ca2+]i (Fig. 4, B–D and G). Similarly, in the presence of 100 μm [Ca2+]i, the apparent affinity to PIP2 of an epilepsy-dyskinesia D369G mutant increased to a similar extent as the Slo1-WT compared with that in the absence of [Ca2+]i (∼3-fold; Fig. 4, E and G). D369G has been shown previously to increase channel activity by decreasing the flexibility of the KDRDD loop without influencing Ca2+ binding itself (48). Interestingly, compared with the wild type Slo1, the D369G mutant showed a significant enhancement in its PIP2 apparent affinity both in the absence and in the presence of Ca2+ (Fig. 4G). Interestingly, the D367G mutant that disrupts the Ca2+ binding in the RCK1 domain also increased the apparent affinity for PIP2 (Fig. 4, F and G). As expected, increasing [Ca2+]i could not further enhance the PIP2 affinity of the D367G mutant (Fig. 4, F and G) due to the absence of the local conformational change induced by Ca2+ binding. A similar result to the PIP2 effect on the D367G mutant was obtained from the D367A mutant. (Fig. 5, C and H). To test whether neighboring residues to Asp367 affected the PIP2 apparent affinity of the channel, additional mutants in the KDRDD loop were tested (Fig. 5, A–H). Results showed similar increases of PIP2 affinity by the K366N and R368N but not by the D370N and D379N mutants (Fig. 5, D–G). These results suggested that the Asp367 residue that coordinates Ca2+ and its two flanking basic residues (Lys366 and Arg368) are coupled to PIP2 regulation of channel activity.
FIGURE 4.

The Ca2+ enhancement of the apparent PIP2 affinity of Slo1 channels involves the RCK1 Ca2+ coordination site at Asp367. A, G-V curves of Slo1 WT channels in 0 (open squares) or 100 μm (filled squares) [Ca2+]i. Solid lines, fits to the Boltzmann function (see “Experimental Procedures”). V½ is indicated by the red dashed lines (V½ = +173 mV in 0 μm [Ca2+]i and −8 mV in 100 μm [Ca2+]i). Voltage protocols for G-V curves are described under “Experimental Procedures.” Actual macroscopic current traces in 0 (right) and 100 μm [Ca2+]i (left) are shown in the insets. For clarity, current traces shown are in 40-mV increments, as indicated. The voltages before and after the pulses were −120 mV in 100 μm [Ca2+]i (left) and −100 mV in 0 μm [Ca2+]i (right), respectively. B, G-V curves at 0 Ca2+ for WT Slo1 channels in different PIP2 concentrations, as indicated. G-V curves at each PIP2 concentration were obtained following endogenous PIP2 depletion by PIP2 scavengers (PIP2 Ab (PIP2 Ab (1–2:1000) + poly-K+ (300 μg/ml)). The solid lines through the data points represent fits to a simple Boltzmann function. The red vertical line at +170 mV (near the V½ determined in A) is used as a reference point to assess relative amplitude of PIP2-elicited currents. Note that 300 μm PIP2 induced further activation when compared with 100 μm PIP2. C, same as in B but in 100 μm [Ca2+]i. The red vertical line at −10 mV (near the V½ determined in A) is used as a reference point to assess the relative amplitude of PIP2-elicited currents. Note that the conductance saturated at 100 μm [Ca2+]i. D, PIP2 dose-response curves for Slo1 WT channels near V½ at 170 mV in 0 [Ca2+]i (open symbols) and at −10 mV in 100 μm [Ca2+]i (filled symbols). The points in 0 Ca2+ were obtained from B (at 170 mV), and those at −10 mV at 100 μm Ca2+ are from C. Solid lines are fits to the Hill equation with an EC50 summarized in G. Note that the maximum values were obtained from fits to the Hill equation. Hill coefficients were 0.73 in 0 [Ca2+]i and 0.76 in 100 μm [Ca2+]i. E, same as in D but for D369G. Hill coefficients were 0.57 in 0 [Ca2+]i and 0.98 in 100 μm [Ca2+]i. F, same as in D but for D367G. Hill coefficients were 0.83 in 0 μm [Ca2+]i and 0.83 in 100 μm [Ca2+]i. Macroscopic current traces (in D–F) in different concentrations of PIP2 are shown on the left for 100 μm [Ca2+]i and on the right for 0 [Ca2+]i. Currents were elicited by depolarization to +100 mV in 100 μm [Ca2+]i (left) and by a step to +150 mV in 0 μm [Ca2+]i(right). The voltages before and after the pulses in 100 μm [Ca2+]i were −120 mV and −100 mV in 0 μm [Ca2+]i, respectively. Note that at the same voltage (such as at 100 mV in 100 μm [Ca2+]i, as shown on the left, or 150 mV in 0 [Ca2+]i, as shown on the right), both mutations D369G and D367G dramatically enhanced channel PIP2 apparent affinity. G, PIP2 EC50 values determined from the Hill fits in 0 μm (gray) and 100 μm (red) [Ca2+]i from D–F. Error bars indicate mean ± S.E. Data points represent 3–7 determinations. *, p < 0.01.
FIGURE 5.

Asp367 and its flanking basic residues decrease the apparent affinity of Slo1 channels for PIP2. A, schematic shows the KDRDD loop (Lys366, Asp367, Arg368, Asp369, and Asp370) location in the RCK1 domain of two subunits of the tertrameric Slo1 channel. B–G, PIP2 dose-response curves (constructed as in Fig. 4) of KDRDD and the Glu535 mutant channels in the absence of [Ca2+]i compared with the WT (dashed black curves). Relative currents (IPIP2/Imax) were obtained in response to PIP2 application subsequent to the endogenous PIP2 depletion (PIP2 Ab (1–2:1000) + poly-K+ (300 μg/ml) at a voltage near V½ at 0 [Ca2+]i: 170 mV for E535G, 150 mV for D367G, 130 mV for D367A, 140 mV for K366N, 120 mV for R368N, 170 mV for D369N, and 180 mV for D370N). The V½ in 0 [Ca2+]i for each construct was as follows: 173.7 ± 1.9 mV for WT, 174.9 ± 1.2 for E535G, 145.5 ± 0.9 mV for D367G, 133.1 ± 0.8 mV for D367A, 140.2 ± 3.1 mV for K366N, 125.0 ± 2.2 mV for R368N, 167.2 ± 0.4mV for D369N, and 179 ± 2.9 mV for D370N (n > 6–13). Representative traces are shown for the two basic residues flanking Asp367, namely K366N and R368N. The current traces shown in the insets at different PIP2 concentrations were elicited from −100 to 120 mV and back to −100 mV. Note that the overlapping traces at 100 and 300 μm PIP2; the green current traces are shown for the saturated activation levels reached at 100 μm PIP2. Solid curves, fits to the Hill equation with the EC50 values summarized in H. Data points represent 3–5 determinations. H, EC50 at V½ obtained by the Hill fits from B–G. Dotted horizontal bar, PIP2 EC50 of the WT. *, p < 0.01; **, p < 0.001. Error bars indicate mean ± S.E.
KDR Mutants of the KDRDD Loop Increase Slo1 Channel Activation in the Absence of Ca2+
A hallmark of BK channel function is that intracellular Ca2+ binding can allosterically couple to the voltage sensor movement and enhance channel activity (1). In 300 μm Ca2+, the V½ of Slo1 shifted by as much as 190 mV (Fig. 6A) compared with 0 [Ca2+]i. As mentioned above, Ca2+ sensitivity in Slo1 channels is mainly conferred by two sites, the RCK2 Ca2+-bowl (five consecutive Asp residues, 897–901 in mSlo1) and the RCK1 Asp367/Glu535 Ca2+ coordination site (see Fig. 1). Both Ca2+-bowl 5D5N mutant (D897N/D901N) and Asp367/Glu535 mutants significantly decreased the Ca2+-induced shift in V½ (Fig. 6, B–D and I). However, although the 5D5N (Fig. 6B) or Glu535 mutants (e.g. E535G or E535A) did not change the V½ in the absence of Ca2+ (Fig. 6C), Asp367 mutants (e.g. D367G or D367A) induced significant leftward shifts of V½ in the absence of Ca2+ (Fig. 6D). Mutation of the two basic residues flanking Asp367 (i.e. K366N and R368N; see Figs. 5A and 6, top right) caused similar left shifts of the V½ in the absence of Ca2+, without affecting the Ca2+-induced shift in V½ (Fig. 6, E and F). In contrast, mutants of the remaining two Asp residues of the KDRDD loop (D369N and D370N) did not show a significant effect (Fig. 6, G and H). Summarized data for ΔV½ compared with Slo1 WT in the presence of 300 and 0 μm Ca2+ are shown in Fig. 6, I and J. These results indicated that the KDR mutants of the KDRDD loop increased PIP2 affinity (Fig. 5) and left-shifted activation of the channel in the absence of Ca2+ (Fig. 6, D–F and J), suggesting that these mutants increase Slo1 activity by increasing the channel's PIP2 affinity.
FIGURE 6.

Asp367 and its flanking two basic residues exert an inhibitory effect on activation of Slo1 channels in the absence of [Ca2+]i. The inset at the top right shows the Ca2+ coordination site by the RCK1 Asp367 residue (in the KDRDD loop) and the Glu535 residue (between αH and βG) from a crystal structure (PDB code 3NAF), where the protein is shown in ribbon form, and the notable residues are displayed in stick mode and colored by atom type. The Ca2+ ion is shown in blue. A–H, normalized G-V curves for WT (A) and mutants (B–H) in 0 (open symbols) and 300 μm (filled symbols) [Ca2+]i. In the presence of 300 μm [Ca2+]i, the current traces for the G-V curves were obtained from voltage pulses with a 10-mV increment from −180 to +180 mV; the holding and repolarizing voltages were −120 mV. In the absence of [Ca2+]i, voltage was stepped from −100 to +300 mV, and the holding and repolarizing current was at −100 mV. For clarity, the currents shown in the insets are the traces elicited at −20, +40, +80, +120, and +160 mV in 300 μm [Ca2+]i or at 120, 160, 200, 240, and 280 mV in 0 [Ca2+]i. For easy comparison, the red-colored traces in the left set highlight the currents activated at +80 mV in 300 μm [Ca2+]i, and the cyan traces highlight the currents activated at −20 mV (near the V½ for Slo1-WT at 300 μm [Ca2+]i). The green-colored traces in the right set highlight the currents elicited at +200 mV. The solid lines are fits to the Boltzmann equation (see “Experimental Procedures”). For comparison, the G-V fitted curves from the Slo1 WT channel in A are also shown in dashed/dotted black lines in B–H. I, effect of mutations on Ca2+ sensitivity. ΔV½ (at 300 μm Ca2+) = V½(mut) − V½(WT) at 300 μm [Ca2+]i, where V½ is the voltage where the conductance (G) is half-maximal. Data points represent 5–15 determinations. J, effect of mutations on Ca2+-independent activation of Slo1 channels. ΔV½ at 0 [Ca2+]i = V½(mut) − V½(WT) at 0 μm [Ca2+]i. Data points represent 5–15 determinations. The dashed horizontal bars in I and J indicate a threshold level (ΔV½ = 15 mV) under which changes were not considered significant. *, p < 0.01; **, p < 0.005. Error bars indicate mean ± S.E.
Two Basic Residues in the αB Helix Involved in Direct Channel-PIP2 Interactions
To gain insight into how PIP2 interacts with Slo1, we performed 100 docking simulations of the PIP2 headgroup (diC1) with either of two Slo1 models. These two models included a common homology model of the transmembrane domain of Slo1, using the Kv1.2/2.1 chimera (PDB code 2R9R) as a template together with each of the two available crystal structures of the cytosolic domains of this channel in the presence and absence of Ca2+ (PDB code 3MT5 and 3NAF, respectively). The C1 atom of the diC1 in each of the 100 conformations obtained is represented by dots in Fig. 1C. In the absence of Ca2+, most of the diC1 molecules aggregated around the αB helix, involving the two basic residues, Lys392 and Arg393 (Figs. 1C (right) and 7A), in marked contrast to the docking simulations in the presence of Ca2+ bound to the Ca2+-bowl (Fig. 1C, left). Next, we tested experimentally whether these two residues are involved in PIP2 sensitivity. First, electrophysiological data showed that although both K392N and R393N mutants inhibited activation of Slo1 in the absence of Ca2+ (Fig. 7, B, C, and E), only the R393N mutant showed a parallel shift of V½ in the presence of Ca2+ (Fig. 7, C and E). Furthermore, both neutralization mutations of Lys392 and Arg393 right-shifted the diC8-PIP2 dose-response relationships, causing a 5–6-fold increase in the PIP2 EC50 (Fig. 7, F and G). These results could be explained by hypothesizing that the Arg393 interaction with PIP2 couples the Ca2+-induced conformational change, whereas the Lys392 residue interaction with PIP2 is independent of Ca2+ binding. The crystal structure and docking simulation results support this idea because Lys392 points away from the αB helix in the absence of Ca2+, whereas Arg393 points toward the αB helix (Fig. 1C, right). Accordingly, Ca2+ binding induces a helical conformational turn of αB to facilitate the Arg393 interaction with PIP2 (nearly a 90° turn) but has no effect on the Lys392 orientation.
FIGURE 7.

Slo1 residues that interact with PIP2 and affect channel activation. A, docking of PIP2 to the Slo1 cytosolic domain (PDB code 3NAF) revealed a direct interaction of PIP2 with Lys392/Arg393 residues in the αB helix. B and C, normalized G-V relations for K392N (B) and R393N (C) in 0 μm (open symbols) and 300 μm (filled symbols) [Ca2+]i. For clarity, the currents shown in the inset are the traces elicited at −20, +40, +80, +120, and +160 mV in 300 μm [Ca2+]i (the voltages before and after the steps are −120 mV) or at 120, 160, 200, 240, and 280 mV in 0 [Ca2+]i) (the voltages before and after the steps were −100 mV). For easy comparison, the red-colored traces in the left set highlight the currents activated at +80 mV in 300 μm [Ca2+]i, and the cyan traces highlight the currents activated at −20 mV (near the V½ for Slo1-WT at 300 μm [Ca2+]i). The green traces in the right set highlight the currents elicited at +200 mV. The voltage protocol for G-V curves is described under “Experimental Procedures.” Solid lines, fits to the Boltzmann equation. D, the shift in V½ from the G-V relationships at 300 μm (top) and 0 μm [Ca2+]i (bottom) for the K392N and R393N mutants relative to the WT. ΔV½ is defined as in Fig. 6, I (300 μm [Ca2+]i) and J (0 μm [Ca2+]i). E, V½ of G-V curves versus [Ca2+]i for WT, K392N, and R393N mutant channels (note the similar steepness between WT and R393N). F, PIP2 dose response for K392N and R393N channels in the absence of [Ca2+]i Relative currents (IPIP2/Imax) at V½ were obtained in response to PIP2 application subsequent to endogenous PIP2 depletion (by PIP2 Ab (1–2:1000) and poly-K+ (300 mg/ml)) at +240 mV, near the V½ for both mutations. Solid curves are fits to the Hill equation. Note that the maximum values were obtained from fits to the Hill equation. Data points represent 3–5 determinations. For comparison, the fitted results for WT (obtained at V½ of ∼170 mV) are shown in dashed/dotted lines. G, PIP2 EC50 values at V½ obtained from the Hill fits from F (n = 3–5) for the two mutant channels are plotted and compared with the WT. *, p < 0.01. Error bars indicate mean ± S.E.
Hydrophobic Coupling of the αA and αB Helices Plays a Critical Role in the Activation of Slo1 Channels
How could changes in the conformation of the KDRDD loop be communicated to the PIP2-interacting residues in the αB helix? Comparison of the 3MT5 (Asp367/Glu535 pointing away from each other; Fig. 1C, left) and 3NAF (Asp367/Glu535 pointing toward each other; Fig. 1C, right) structures reveals that in the 3MT5 structure, several residues between the αA and αB helices (αA, Val356, Leu360, Lys361, and Leu364; αB, Phe391 and Phe395) form predominantly hydrophobic interactions (Figs. 1C and 8, top, right inset). Mutants of these residues were tested for their involvement in (a) the [Ca2+]i-induced shift in V½ and (b) the effect on channel activation in the absence of [Ca2+]i. Whereas the V356A mutant showed no significant changes on either of the two effects (Fig. 8, A, G, and H), the L360A mutant significantly affected only the Ca2+-induced shift in V½ (Fig. 8, B, G, and H). In contrast, the K361N significantly left-shifted only the channel's activation in the absence of [Ca2+]i (Fig. 8, C, G, and H). Ala mutations of the remaining three hydrophobic residues, Leu364, Phe391, and Phe395, all significantly affected both effects (Fig. 8, D–H). Interestingly, F395A, unlike the other mutants, exhibited a greater inhibition on the channel's activation in the absence of [Ca2+]i (Fig. 8, F and H). Thus, mutation of hydrophobic residues whose side chains point toward the crevice between αA and αB enabled the Ca2+-dependent effect.
FIGURE 8.

Residues involved in the hydrophobic coupling between the αA and αB helices of the RCK1 domain affect Slo1 channel activation in the absence and presence of Ca2+. The inset at the top right shows amino acids that appear to be involved in the hydrophobic coupling between the αA and αB helices (PDB code 3MT5). The protein is shown in ribbon form, and the notable residues are displayed in stick mode and colored by atom type. A–F, normalized G-V relations for WT (gray) and the indicated mutants in 0 μm [Ca2+]i (open symbols) and 300 μm [Ca2+]i (filled symbols). The current traces to construct the G-V curves were obtained by voltage pulses from −180 to +180 mV in +20-mV increments in the presence of 300 μm [Ca2+]i or from −100 to +300 mV in the absence of [Ca2+]i. The voltages before and after pulses were −120 mV in 300 μm [Ca2+]i or −100 mV in 0 [Ca2+]i. Note that the data in this figure were obtained in a different batch of experiments with a different set of Ca2+ solutions; thus, the final Ca2+ concentrations are slightly different from those shown in Fig. 5. The solid lines are fits to the Boltzmann equation. Data points represent 4–13 determinations. G, effect of mutations on Ca2+ sensitivity. ΔV½ (at 300 μm Ca2+) is defined as in the legend to Fig. 6I. H, effect of mutations on Ca2+-independent activation of Slo1 channels. ΔV½ (at 0 μm Ca2+) is defined as in the legend to Fig. 6J. *, p < 0.05. Error bars indicate mean ± S.E.
Mutants of all four residues that significantly altered Slo1 activation in the absence of Ca2+ (αA, K361N and L364A; αB, F391A and F395A) also enhanced the apparent affinity for PIP2 (Fig. 9, A–F). The enhancement of the PIP2 apparent affinity was smallest for F395A (Fig. 9, D–F). This residue was the only one that stood out from the otherwise perfect correlation between inhibitory effects of residues on the channel's activation in the absence of Ca2+ and their inhibitory effects on PIP2 apparent affinity. Examination of our modeled structure of the full-length Slo1 channel that incorporated the 3NAF (Ca2+-free) crystal structure suggests that Phe395 may come in close proximity to the Tyr336 residue in the C-linker that immediately follows the S6 helix (Fig. 1C). Thus, it is possible that the F395A mutation affected the stability of the channel's open state in a manner that extended beyond its effect on PIP2 sensitivity. These results revealed that mostly hydrophobic interactions between the αA and αB helices decreased PIP2 affinity, suggesting that the coupling between the KDRDD loop and the PIP2 interaction residues is mediated through specific interactions in these two helices.
FIGURE 9.
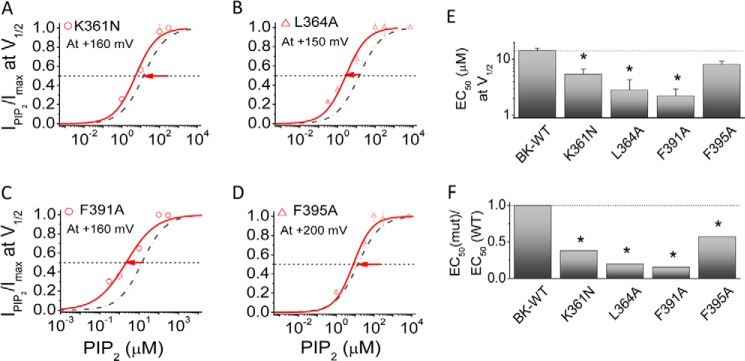
Residues involved in the coupling between the RCK1 αA (Lys361 and Leu364) and αB (Phe391 and Phe395) helices alter the PIP2 sensitivity of the channel. A–D, PIP2 dose response for mutants that changed the allosteric coupling of channel gating in the absence of [Ca2+]i (red symbols). Relative currents (IPIP2/Imax) at V½ were obtained in response to PIP2 application subsequent to the endogenous PIP2 depletion (PIP2 Ab, 1–2:1000; poly-K+, 300 mg/ml). Solid curves, fits to the Hill equation with PIP2 EC50 summarized in E. Slo1-WT is shown in the dashed/dotted line for comparison. Data points represent 3–6 determinations. E, EC50 at V½ obtained by the Hill fits from A–D. F, -fold change in PIP2 sensitivity of the indicated mutants relative to the WT. *, p < 0.01. Error bars indicate mean ± S.E.
Mutants with Decreased Apparent Affinity to PIP2 Exhibit Increased Current Rundown
Membrane patch excision of channels in ATP-free solutions frequently results in current rundown that can be reversed by application of PIP2 (e.g. (49). However, for channels with high affinity for PIP2, current rundown can be minimal or none. Slo1 excised inside-out patches in 100 μm [Ca2+]i display minimal current rundown (see single channel data shown in Fig. 3), probably due to their high affinity for PIP2 (apparent affinity for diC8-PIP2 is ∼6 μm; see Fig. 4G). In contrast, the K392N and R393N mutants that decreased the channel's apparent affinity for PIP2 ∼6–7-fold caused significant current rundown (Fig. 10, A–H), whereas channel activation and deactivation rates were significantly slowed down (data not shown).
FIGURE 10.

Properties of the PIP2-dependent rundown for the K392N and R393N mutants. A, time dependence of current amplitude after patch excision. Normalized current amplitude (It/I0) is plotted as a function of time in the experiment; I0 is the current amplitude immediately following patch excision. The insets show the currents for WT, K392N, and R393N at the time indicated by the arrows. Voltage was stepped from a holding potential of −120 to +100 mV and then back to −120 mV. C, control; R, rundown. B–D, averaged rundown current (percentage) at +100 mV 45 min following patch excision for Slo1 WT (B), K392N (C), and R393N (D), as shown in A. E, averaged rundown (percentage) 45 min following patch excision comparing the K392N and R393N mutants with WT at V½ (at the voltages indicated by the red dotted lines in F–H). F–H, normalized G-V relations of Slo1-WT (F), K392N (G), and R393N (H) mutants at 0 min (black) and 45 min (red) following patch excision. Recordings were performed in 100 μm [Ca2+]i. The green current trace in each of the representative traces indicates the current elicited in response to +100 mV. *, p < 0.01; **, p < 0.005. Error bars indicate mean ± S.E.
DISCUSSION
In this study, we examined the molecular determinants of the coupled relationship between Ca2+ and PIP2 in enhancing Slo1 activity. We found that Ca2+ relieved a KDRDD loop inhibitory influence on channel activation by increasing the apparent affinity to PIP2. Neutralization mutations of three KDRDD loop residues, Lys366, Asp367, or Arg368, also relieved this inhibition in the absence of Ca2+ by enhancing the channel's apparent affinity to PIP2. But where did PIP2 act on the channel, and how did the KDRDD communicate with PIP2? Docking simulations of PIP2 with models of mouse Slo1 channels (based on crystal structures of the human Slo1 cytosolic domain and the rat Kv1.2/2.1 chimera transmembrane domain) identified Lys392 and Arg393 in the αB helix as putative PIP2-interacting residues. Neutralization mutations of these two residues decreased PIP2 sensitivity and also the channel activation in the absence of Ca2+. Interestingly, Arg393, which points toward the αA helix, also decreased channel activation in the presence of 300 μm Ca2+, whereas Lys392, which points toward the membrane, did not (Fig. 7). This result prompted us further to examine residues that enabled communication between the αA and αB helices. The two available structures of the cytosolic domains reveal a large conformational change in the structural element of αA-KDRDD-αB from the RCK2 Ca2+-occupied site (3MT5) to the RCK1 site that could potentially be occupied by Ca2+ (3NAF). Mutation of four residues, two from the αA helix (K361N and L364A) and two from the αB helix (F391A and F395A), all affected channel activation in the absence of Ca2+ with a concomitant effect on the apparent affinity to PIP2. With the exception of F395A, all other mutants decreased channel activation in the absence of Ca2+ (Fig. 8H). Phe395 seems to come close to Tyr336 (located immediately following the S6 gate), a potential interaction that may influence the response beyond the effects of this residue in its communication with the αA helix. The Hill slopes of the PIP2 dose-response curves were typically less than 1. For Kir channels, the Hill slopes are around 1–2, suggesting that at least 1–2 PIP2 molecules are required for channel opening. Values less than 1 could signify negative cooperativity among subunits for channel opening. Alternatively, they may signify more than one PIP2 interaction site with similar affinities. The latter interpretation is consistent with our docking simulations of PIP2 to the two available crystal structures, which suggest state-dependent interaction modes for PIP2.
Our results have provided compelling evidence that when Ca2+ is bound to the Ca2+-bowl and Ca2+ coordination at the RCK1 site is absent, the αA and αB helices are tightly coupled to exert an inhibitory effect on channel PIP2 interactions. Ca2+ binding to the RCK1 site (or mutations that serve to “uncouple” the two helices) seems to relieve the RCK1-mediated decrease in PIP2 affinity and to enhance channel activation. Consideration of the two available structures (3NAF and 3MT5) suggests that simultaneous Ca2+ binding to both RCK1 and RCK2 sites may not be possible. Our data suggested that ablation of either the Ca2+-bowl site (5D5N mutant) or the RCK1 E535 coordination site, either of which decreases Ca2+ sensitivity, did not alter the RCK1 site inhibitory effect on activation of the Slo1α channel in the absence of Ca2+ (Fig. 6, B, C, and J). Only mutations in the αA-KDRDD-αB structural elements removed the inhibitory effect on channel activity and enhanced PIP2 sensitivity and activation of the Slo1 channel in the absence of Ca2+. These results strongly argue that it is not Ca2+ binding per se but rather the KDR residue conformations within the KDRDD loop that control channel activation in the absence of Ca2+ by decreasing PIP2 sensitivity. Ca2+ binding to Asp367 serves to relieve this inhibitory effect.
The β1 but not the β4 accessory channel subunits have been reported to potentiate PIP2-induced activation of BK channels (36). Using double mutant cycle analysis, the β2 subunit was found to enhance the Ca2+ sensitivity of the Slo1α pore-forming subunit by directly coupling its Glu44 and Asp45 residues, located just before the first β2 transmembrane domain, with the Lys392 and Arg393 residues of the αB helix of Slo1 (50). Because we found that Lys392 and Arg393 are critical residues for PIP2 sensitivity, it remains to be examined whether the β2-mediated enhancement of Slo1 currents is a reflection of altering channel-PIP2 interactions. Similarly, whether the β1 potentiation of PIP2-induced activation involves the same αB residues remains to be tested.
Our study focused on the relationship of Ca2+ and PIP2 sensitivity for Slo1 channel activation. We did not investigate channel residues that may also affect sensitivity to PIP2 but are not part of the αB helix. Could such residues be specifically coupled to gating by voltage? Recent work from different laboratories, including ours, has shown that Kv1.2 channels utilize the S4-S5 linker and the N terminus to couple the movement of the voltage sensor to PIP2 (51, 52). Thus, the relationship of PIP2 and voltage-dependent gating in Slo1α channels remains an open question to pursue.
A recent report examining PIP2 sensitivity of Kv channels in intact cells showed that voltage-gated channels other than Kv7 channels would not respond to a number of manipulations that decreased PIP2 (53). However, experiments from other studies from excised patches have shown that some of the same channels are sensitive to PIP2 (see Ref. 53 for discussion). Unlike most Kv channels tested, Kv1.2 and Shaker channels have been shown to be PIP2-sensitive in both intact cells and excised patches (51–54). Several reasons for the differences in PIP2 sensitivity seen between intact cells and excised patches have been considered (53), yet the relevant question is what is the physiological purpose of a high affinity interaction of a given channel with PIP2, if it is not that PIP2 depletion serves as a signal to inhibit channel activity? Slo1 channels are highly sensitive to PIP2. Our studies using dose-response curves with the soluble diC8-PIP2 following endogenous PIP2 depletion by scavengers suggest a Slo1a EC50 of ∼14 μm in the absence of [Ca2+]i versus an EC50 of ∼6 μm in 100 μm [Ca2+]i (Fig. 4). The Slo3 channel has shown even higher PIP2 sensitivity (EC50 ∼2.5 μm) (40). As has been shown for certain channels (55), the length of the acyl chain may also contribute to the apparent affinity of Slo1 channels to PIP2, making diC8 PIP2 assessments of apparent affinity less meaningful (36). Regardless of what the apparent affinity of Slo1 channels is to the native PIP2, it is clear that upon patch excision, the currents do not run down as they would for Kir channels with comparable apparent affinity for PIP2 (e.g. Kir2.1 with a diC8-PIP2 EC50 of ∼2–3 μm). Our study has shown that the strong apparent affinity of the Slo1α channel to PIP2 can be utilized in gating the channel by coupling the structural elements αA-KDRDD-αB and decreasing the apparent affinity of the channel for PIP2 (EC50 from ∼2 μm in the D367G mutant to ∼14 μm in the WT).
Acknowledgments
We thank Dr. Christopher Lingle for sending cDNAs and for advice throughout this project. We thank our colleagues Drs. Leon Avery, Linda Boland, Louis De Felice, and members of the Logothetis laboratory for critical reading of the manuscript. We are grateful to Sophia Gruszecki and Heikki Vaananen for preparation of Xenopus oocytes.
This work was supported, in whole or in part, by National Institutes of Health (NIH) Grants R01-HL059949 and R01-HL090882 (to D. E. L.) and by NIH, NCRR, Grant S10RR027411 (to M. C.). This work was also supported by American Heart Association Grant 09SDG2290002 (to Z. Z.).
- PDB
- Protein Data Bank
- PIP2
- phosphatidylinositol 4,5-bisphosphate
- 5D5N
- D897N/D901N
- Wtmn
- wortmannin
- G-V
- conductance-voltage
- Ab
- antibody
- poly-K+
- polylysine.
REFERENCES
- 1. Cui J., Aldrich R. W. (2000) Allosteric linkage between voltage and Ca2+-dependent activation of BK-type mslo1 K+ channels. Biochemistry 39, 15612–15619 [DOI] [PubMed] [Google Scholar]
- 2. Horrigan F. T., Aldrich R. W. (2002) Coupling between voltage sensor activation, Ca2+ binding and channel opening in large conductance (BK) potassium channels. J. Gen. Physiol. 120, 267–305 [DOI] [PMC free article] [PubMed] [Google Scholar]
- 3. Lingle C. J. (2002) Setting the stage for molecular dissection of the regulatory components of BK channels. J. Gen. Physiol. 120, 261–265 [DOI] [PMC free article] [PubMed] [Google Scholar]
- 4. Shelley C., Niu X., Geng Y., Magleby K. L. (2010) Coupling and cooperativity in voltage activation of a limited-state BK channel gating in saturating Ca2+. J. Gen. Physiol. 135, 461–480 [DOI] [PMC free article] [PubMed] [Google Scholar]
- 5. Wei A., Solaro C., Lingle C., Salkoff L. (1994) Calcium sensitivity of BK-type KCa channels determined by a separable domain. Neuron 13, 671–681 [DOI] [PubMed] [Google Scholar]
- 6. Schreiber M., Salkoff L. (1997) A novel calcium-sensing domain in the BK channel. Biophys. J. 73, 1355–1363 [DOI] [PMC free article] [PubMed] [Google Scholar]
- 7. Zhang X., Solaro C. R., Lingle C. J. (2001) Allosteric regulation of BK channel gating by Ca2+ and Mg2+ through a nonselective, low affinity divalent cation site. J. Gen. Physiol. 118, 607–636 [DOI] [PMC free article] [PubMed] [Google Scholar]
- 8. Bao L., Rapin A. M., Holmstrand E. C., Cox D. H. (2002) Elimination of the BKCa channel's high-affinity Ca2+ sensitivity. J. Gen. Physiol. 120, 173–189 [DOI] [PMC free article] [PubMed] [Google Scholar]
- 9. Xia X. M., Zhang X., Lingle C. J. (2004) Ligand-dependent activation of Slo family channels is defined by interchangeable cytosolic domains. J. Neurosci. 24, 5585–5591 [DOI] [PMC free article] [PubMed] [Google Scholar]
- 10. Xia X. M., Zeng X., Lingle C. J. (2002) Multiple regulatory sites in large-conductance calcium-activated potassium channels. Nature 418, 880–884 [DOI] [PubMed] [Google Scholar]
- 11. Shi J., Krishnamoorthy G., Yang Y., Hu L., Chaturvedi N., Harilal D., Qin J., Cui J. (2002) Mechanism of magnesium activation of calcium-activated potassium channels. Nature 418, 876–880 [DOI] [PubMed] [Google Scholar]
- 12. Bao L., Kaldany C., Holmstrand E. C., Cox D. H. (2004) Mapping the BKCa channel's “Ca2+ bowl”: side-chains essential for Ca2+ sensing. J. Gen. Physiol. 123, 475–489 [DOI] [PMC free article] [PubMed] [Google Scholar]
- 13. Zeng X. H., Xia X. M., Lingle C. J. (2005) Divalent cation sensitivity of BK channel activation supports the existence of three distinct binding sites. J. Gen. Physiol. 125, 273–286 [DOI] [PMC free article] [PubMed] [Google Scholar]
- 14. Lu R., Alioua A., Kumar Y., Eghbali M., Stefani E., Toro L. (2006) MaxiK channel partners: physiological impact. J. Physiol. 570, 65–72 [DOI] [PMC free article] [PubMed] [Google Scholar]
- 15. Behrens R., Nolting A., Reimann F., Schwarz M., Waldschütz R., Pongs O. (2000) hKCNMB3 and hKCNMB4, cloning and characterization of two members of the large-conductance calcium-activated potassium channel β subunit family. FEBS Lett. 474, 99–106 [DOI] [PubMed] [Google Scholar]
- 16. Riazi M. A., Brinkman-Mills P., Johnson A., Naylor S. L., Minoshima S., Shimizu N., Baldini A., McDermid H. E. (1999) Identification of a putative regulatory subunit of a calcium-activated potassium channel in the dup(3q) syndrome region and a related sequence on 22q11.2. Genomics 62, 90–94 [DOI] [PubMed] [Google Scholar]
- 17. Du W., Bautista J. F., Yang H., Diez-Sampedro A., You S. A., Wang L., Kotagal P., Lüders H. O., Shi J., Cui J., Richerson G. B., Wang Q. K. (2005) Calcium-sensitive potassium channelopathy in human epilepsy and paroxysmal movement disorder. Nat. Genet. 37, 733–738 [DOI] [PubMed] [Google Scholar]
- 18. Cavalleri G. L., Weale M. E., Shianna K. V., Singh R., Lynch J. M., Grinton B., Szoeke C., Murphy K., Kinirons P., O'Rourke D., Ge D., Depondt C., Claeys K. G., Pandolfo M., Gumbs C., Walley N., McNamara J., Mulley J. C., Linney K. N., Sheffield L. J., Radtke R. A., Tate S. K., Chissoe S. L., Gibson R. A., Hosford D., Stanton A., Graves T. D., Hanna M. G., Eriksson K., Kantanen A. M., Kalviainen R., O'Brien T. J., Sander J. W., Duncan J. S., Scheffer I. E., Berkovic S. F., Wood N. W., Doherty C. P., Delanty N., Sisodiya S. M., Goldstein D. B. (2007) Multicentre search for genetic susceptibility loci in sporadic epilepsy syndrome and seizure types: a case-control study. Lancet Neurol. 6, 970–980 [DOI] [PubMed] [Google Scholar]
- 19. Lorenz S., Heils A., Kasper J. M., Sander T. (2007) Allelic association of a truncation mutation of the KCNMB3 gene with idiopathic generalized epilepsy. Am. J. Med. Genet. B Neuropsychiatr. Genet. 144B, 10–13 [DOI] [PubMed] [Google Scholar]
- 20. Fernández-Fernández J. M., Tomas M., Vázquez E., Orio P., Latorre R., Sentí M., Marrugat J., Valverde M. A. (2004) Gain-of-function mutation in the KCNMB1 potassium channel subunit is associated with low prevalence of diastolic hypertension. J. Clin. Invest. 113, 1032–1039 [DOI] [PMC free article] [PubMed] [Google Scholar]
- 21. Sentí M., Fernández-Fernández J. M., Tomás M., Vázquez E., Elosua R., Marrugat J., Valverde M. A. (2005) Protective effect of the KCNMB1 E65K genetic polymorphism against diastolic hypertension in aging women and its relevance to cardiovascular risk. Circ. Res. 97, 1360–1365 [DOI] [PubMed] [Google Scholar]
- 22. Tomás M., Vázquez E., Fernández-Fernández J. M., Subirana I., Plata C., Heras M., Vila J., Marrugat J., Valverde M. A., Sentí M. (2008) Genetic variation in the KCNMA1 potassium channel α subunit as risk factor for severe essential hypertension and myocardial infarction. J. Hypertens. 26, 2147–2153 [DOI] [PubMed] [Google Scholar]
- 23. Nielsen T., Burgdorf K. S., Grarup N., Borch-Johnsen K., Hansen T., Jørgensen T., Pedersen O., Andersen G. (2008) The KCNMB1 Glu65Lys polymorphism associates with reduced systolic and diastolic blood pressure in the Inter99 study of 5729 Danes. J. Hypertens 26, 2142–2146 [DOI] [PubMed] [Google Scholar]
- 24. Kelley-Hedgepeth A., Peter I., Montefusco M. C., Levy D., Benjamin E. J., Vasan R. S., Mendelsohn M. E., Housman D., Huggins G. S., Mitchell G. F. (2009) The KCNMB1 E65K variant is associated with reduced central pulse pressure in the community-based Framingham Offspring Cohort. J. Hypertens. 27, 55–60 [DOI] [PMC free article] [PubMed] [Google Scholar]
- 25. Soroceanu L., Manning T. J., Jr., Sontheimer H. (1999) Modulation of glioma cell migration and invasion using Cl− and K+ ion channel blockers. J. Neurosci. 19, 5942–5954 [DOI] [PMC free article] [PubMed] [Google Scholar]
- 26. Köhler R., Degenhardt C., Kühn M., Runkel N., Paul M., Hoyer J. (2000) Expression and function of endothelial Ca2+-activated K+ channels in human mesenteric artery: a single-cell reverse transcriptase-polymerase chain reaction and electrophysiological study in situ. Circ. Res. 87, 496–503 [DOI] [PubMed] [Google Scholar]
- 27. Liu X., Chang Y., Reinhart P. H., Sontheimer H. (2002) Cloning and characterization of glioma BK, a novel BK channel isoform highly expressed in human glioma cells. J. Neurosci. 22, 1840–1849 [DOI] [PMC free article] [PubMed] [Google Scholar]
- 28. Khaitan D., Sankpal U. T., Weksler B., Meister E. A., Romero I. A., Couraud P. O., Ningaraj N. S. (2009) Role of KCNMA1 gene in breast cancer invasion and metastasis to brain. BMC Cancer 9, 258. [DOI] [PMC free article] [PubMed] [Google Scholar]
- 29. Seibold M. A., Wang B., Eng C., Kumar G., Beckman K. B., Sen S., Choudhry S., Meade K., Lenoir M., Watson H. G., Thyne S., Williams L. K., Kumar R., Weiss K. B., Grammer L. C., Avila P. C., Schleimer R. P., Burchard E. G., Brenner R. (2008) An African-specific functional polymorphism in KCNMB1 shows sex-specific association with asthma severity. Hum. Mol. Genet. 17, 2681–2690 [DOI] [PMC free article] [PubMed] [Google Scholar]
- 30. Lee U. S., Cui J. (2010) BK channel activation: structural and functional insights. Trends Neurosci. 33, 415–423 [DOI] [PMC free article] [PubMed] [Google Scholar]
- 31. Zhang G., Huang S. Y., Yang J., Shi J., Yang X., Moller A., Zou X., Cui J. (2010) Ion sensing in the RCK1 domain of BK channels. Proc. Natl. Acad. Sci. U.S.A. 107, 18700–18705 [DOI] [PMC free article] [PubMed] [Google Scholar]
- 32. Yuan P., Leonetti M. D., Pico A. R., Hsiung Y., MacKinnon R. (2010) Structure of the human BK channel Ca2+-activation apparatus at 3.0 Å resolution. Science 329, 182–186 [DOI] [PMC free article] [PubMed] [Google Scholar]
- 33. Wu Y., Yang Y., Ye S., Jiang Y. (2010) Structure of the gating ring from the human large-conductance Ca2+-gated K+ channel. Nature 466, 393–397 [DOI] [PMC free article] [PubMed] [Google Scholar]
- 34. Suh B. C., Hille B. (2008) PIP2 is a necessary cofactor for ion channel function: how and why? Annu. Rev. Biophys. 37, 175–195 [DOI] [PMC free article] [PubMed] [Google Scholar]
- 35. Logothetis D. E., Petrou V. I., Adney S. K., Mahajan R. (2010) Channelopathies linked to plasma membrane phosphoinositides. Pflugers Arch. 460, 321–341 [DOI] [PMC free article] [PubMed] [Google Scholar]
- 36. Vaithianathan T., Bukiya A., Liu J., Liu P., Asuncion-Chin M., Fan Z., Dopico A. (2008) Direct regulation of BK channels by phosphatidylinositol 4,5-bisphosphate as a novel signaling pathway. J. Gen. Physiol. 132, 13–28 [DOI] [PMC free article] [PubMed] [Google Scholar]
- 37. Tang Q. Y., Zeng X. H., Lingle C. J. (2009) Closed-channel block of BK potassium channels by bbTBA requires partial activation. J. Gen. Physiol. 134, 409–436 [DOI] [PMC free article] [PubMed] [Google Scholar]
- 38. Zhou Y., Tang Q. Y., Xia X. M., Lingle C. J. (2010) Glycine 311, a determinant of paxilline block in BK channels: a novel bend in the BK S6 helix. J. Gen. Physiol. 135, 481–494 [DOI] [PMC free article] [PubMed] [Google Scholar]
- 39. Zhang Z., Zhou Y., Ding J. P., Xia X. M., Lingle C. J. (2006) A limited access compartment between the pore domain and cytosolic domain of the BK channel. J. Neurosci. 26, 11833–11843 [DOI] [PMC free article] [PubMed] [Google Scholar]
- 40. Tang Q. Y., Zhang Z., Xia J., Ren D., Logothetis D. E. (2010) Phosphatidylinositol 4,5-bisphosphate activates Slo3 currents and its hydrolysis underlies the epidermal growth factor-induced current inhibition. J. Biol. Chem. 285, 19259–19266 [DOI] [PMC free article] [PubMed] [Google Scholar]
- 41. Zhang Z., Rosenhouse-Dantsker A., Tang Q. Y., Noskov S., Logothetis D. E. (2010) The RCK2 domain uses a coordination site present in Kir channels to confer sodium sensitivity to Slo2.2 channels. J. Neurosci. 30, 7554–7562 [DOI] [PMC free article] [PubMed] [Google Scholar]
- 42. Zhang Z., Tang Q. Y., Alaimo J. T., Davies A. G., Bettinger J. C., Logothetis D. E. (2013) SLO-2 isoforms with unique Ca2+- and voltage-dependence characteristics confer sensitivity to hypoxia in C. elegans. Channels 7, 194–205 [DOI] [PMC free article] [PubMed] [Google Scholar]
- 43. Tang Q. Y., Zhang Z., Xia X. M., Lingle C. J. (2010) Block of mouse Slo1 and Slo3 K+ channels by CTX, IbTX, TEA, 4-AP and quinidine. Channels 4, 22–41 [DOI] [PMC free article] [PubMed] [Google Scholar]
- 44. Thompson J. D., Higgins D. G., Gibson T. J. (1994) Improved sensitivity of profile searches through the use of sequence weights and gap excision. Comput. Appl. Biosci. 10, 19–29 [DOI] [PubMed] [Google Scholar]
- 45. Sali A., Blundell T. L. (1993) Comparative protein modelling by satisfaction of spatial restraints. J. Mol. Biol. 234, 779–815 [DOI] [PubMed] [Google Scholar]
- 46. Morris G. M., Goodsell D. S., Halliday R. S., Huey R., Hart W. E., Belew R. K., Olson A. J. (1998) Automated docking using a Lamarckian genetic algorithm and empirical binding free energy function. J. Comput. Chem. 19, 1639–1662 [Google Scholar]
- 47. Rohács T., Lopes C. M., Michailidis I., Logothetis D. E. (2005) PI(4,5)P2 regulates the activation and desensitization of TRPM8 channels through the TRP domain. Nat. Neurosci. 8, 626–634 [DOI] [PubMed] [Google Scholar]
- 48. Yang J., Krishnamoorthy G., Saxena A., Zhang G., Shi J., Yang H., Delaloye K., Sept D., Cui J. (2010) An epilepsy/dyskinesia-associated mutation enhances BK channel activation by potentiating Ca2+ sensing. Neuron 66, 871–883 [DOI] [PMC free article] [PubMed] [Google Scholar]
- 49. Zhang H., He C., Yan X., Mirshahi T., Logothetis D. E. (1999) Activation of inwardly rectifying K+ channels by distinct PtdIns(4,5)P2 interactions. Nat. Cell Biol. 1, 183–188 [DOI] [PubMed] [Google Scholar]
- 50. Hou P., Zeng W., Gan G., Lv C., Guo X., Zhang Z., Liu H., Wu Y., Yao J., Wei A. D., Wang S., Ding J. (2013) Inter-α/β subunits coupling mediating pre-inactivation and augmented activation of BKCa(β2). Sci. Rep. 3, 1666. [DOI] [PMC free article] [PubMed] [Google Scholar]
- 51. Rodriguez-Menchaca A. A., Adney S. K., Tang Q. Y., Meng X. Y., Rosenhouse-Dantsker A., Cui M., Logothetis D. E. (2012) PIP2 controls voltage-sensor movement and pore opening of Kv channels through the S4-S5 linker. Proc. Natl. Acad. Sci. U.S.A. 109, E2399–E2408 [DOI] [PMC free article] [PubMed] [Google Scholar]
- 52. Abderemane-Ali F., Es-Salah-Lamoureux Z., Delemotte L., Kasimova M. A., Labro A. J., Snyders D. J., Fedida D., Tarek M., Baró I., Loussouarn G. (2012) Dual effect of phosphatidylinositol (4,5)-bisphosphate PIP2 on Shaker K+ [corrected] channels. J. Biol. Chem. 287, 36158–36167 [DOI] [PMC free article] [PubMed] [Google Scholar]
- 53. Kruse M., Hammond G. R., Hille B. (2012) Regulation of voltage-gated potassium channels by PI(4,5)P2. J. Gen. Physiol. 140, 189–205 [DOI] [PMC free article] [PubMed] [Google Scholar]
- 54. Kruse M., Hille B. (2013) The phosphoinositide sensitivity of the KV channel family. Channels 7, 530–536 [DOI] [PMC free article] [PubMed] [Google Scholar]
- 55. Rohács T., Chen J., Prestwich G. D., Logothetis D. E. (1999) Distinct specificities of inwardly rectifying K+ channels for phosphoinositides. J. Biol. Chem. 274, 36065–36072 [DOI] [PubMed] [Google Scholar]
- 56. Long S. B., Tao X., Campbell E. B., MacKinnon R. (2007) Atomic structure of a voltage-dependent K+ channel in a lipid membrane-like environment. Nature 450, 376–382 [DOI] [PubMed] [Google Scholar]